Heavy Metals in Foliar Dust: Utilizing Ziziphus spina-christi Leaves in Estimating Levels of Vehicular Pollution
Funding: The authors received no specific funding for this work.
ABSTRACT
The study investigates the Ziziphus spina-christi leaves as bioindicators for vehicular traffic-related air pollution. The analysis primarily focused on the elevated concentration of metals built up on the leaf surface. The accumulated dust on the leaves of Z. spina-christi was analyzed for the presence of several metals, including aluminum (Al), barium (Ba), cadmium (Cd), chromium (Cr), copper (Cu), calcium (Ca), iron (Fe), potassium (K), magnesium (Mg), manganese (Mn), lead (Pb), and zinc (Zn), using inductively coupled plasma optical emission spectrometry (ICP-OES). ArcGIS was used to map the spatial distribution of metal concentrations across the study sites. The study revealed strong correlations among metals, such as Al, Cr, Fe, Cu, and Zn with vehicular traffic, whereas Ca and Mg exhibited weaker correlations. Barium showed a moderate correlation, suggesting the presence of other emission sources. The pollution load index (PLI) and contamination factor (CF) assessments indicated moderate contamination levels at the study sites, and strong inter-elemental correlations suggested shared emission sources, primarily linked to traffic-related activities. The morphological study and the spatial distribution of metal concentrations were consistent with the data obtained from the chemical analysis.
1 Introduction
Air pollution caused by particulate matter (PM) is of significant concern in numerous urban areas globally, with automotive emissions being identified as a prominent contributor to this universal problem. Heavy metals are known contaminants in air particulates, which are transported over long distances, aggravating metal pollution in foliar dust, plant leaves, and soil [1-3]. The plant–soil system is an important sink of atmospheric PM. The main contributors to heavy metal pollution in roadside plants and soils are vehicular exhausts and non-exhaust emissions, such as brake wear, tire wear, and dust resuspension [3, 4], into the environment in the form of particles or fumes [5]. Vehicular exhaust emissions release various metallic elements into the atmosphere, including Fe, Al, Ba, Cd, Cu, Pb, Zn, Mn, Ni, and Cr [6]. Although precious metals, such as platinum (Pt), palladium (Pd), and rhodium (Rh), are emitted from autocatalytic converters in lower concentrations, the limitations of the inductively coupled plasma optical emission spectrometry (ICP-OES) method in detecting them impede accurate quantification; nonetheless, their environmental impact remains significant [7-9]. Sources of atmospheric Al emissions include automotive exhaust, Al manufacturing processes, and the incineration of waste materials [10-12]. Wang et al. [13] found that emissions of the metals in the Ca–Mn group are related to exhaust emissions, Ba–Cu group are related to brake wear, and Fe–Ti group are related more to road dust resuspension. Zn is derived from lubricating oils and the wear of tires, whereas Cu is released as a result of brake wear. Fe is a product of engine wear, whereas Cd is derived from tire wear. Additionally, Cr, Ni, and V result from the processes of fuel combustion and the use of additives [2, 14-16]. Despite the widespread adoption of unleaded fuel and the large reduction in its release into the environment, the presence of previously deposited amounts of Pb still presents a substantial concern [17]. Several heavy metals also exhibited an increase in non-vehicular exhaust emissions, including but not limited to Ba, Cd, Cu, Cr, Fe, Mn, Pb, and Zn [13, 18]. Major contributors of non-vehicular exhaust emissions include dust generated by tire and brake wear, combustion emissions, and asphalt fly ash [23]. These emissions primarily stem from vehicle operations, with non-exhaust emissions from tire and brake wear alongside combustion-related exhaust and particles from asphalt. Jeong [19] found that Ni, Zn, Sn, and Sb had higher concentrations in domestic tires (South Korea), whereas Cu, Cd, and Pb concentrations were relatively higher in imported tires. In China, Cu ranked among the five most prevalent metals released into the atmosphere due to brake lining wear, amounting to approximately 3.2 kt in 2020 [20], whereas Zn content in tires was found to be from 0.4% to 4.3% [21]. The detrimental impact of heavy metals emitted by automobiles on ecosystems and their natural generation of dust on roadways is mostly attributed to the chemical and mechanical degradation processes, as well as the deposition of windblown dust and soil particles. Soil minerals also contribute to around 60% of road dust, with quartz contributing 40%–50% of this composition, whereas the other minerals, such as albite, microcline, chlorite, and muscovite, can undergo erosion or atmospheric processes that result in the formation of clay minerals [22]. Organic matter in road dust from factory emissions is minimal at 2%.
Qatar is experiencing unprecedented growth and development. Its national vision aims to transform the country into an advanced nation by 2030, with a focus on economic diversification and sustainable development. The primary income of Qatar derives from oil and natural gas exports, and due to the cheaper price of petroleum, the primary means of transportation is by road. Several highways and road systems, especially in the city areas, are being upgraded in response to the rapidly increasing population and use of automobiles. In fact, on the basis of the Qatar Monthly Statistics Traffic Violations, the total number of registered automobiles in Doha from March 2018 to October 2022 was 953 757. The findings show a 50.3% monthly and 26.4% yearly increase in emissions [24], contributing to higher atmospheric pollutant levels. Additionally, frequent sandstorms from the Arabian Desert, rich in calcite and quartz minerals, impact Qatar [25]. In their study, Kazmerski et al. [26] reported that Ca, Si, Mg, Al, and Fe were identified as the predominant metallic elements present in the dust that had accumulated on the solar panels in Qatar over a 2-month period in 2015.
Plants act as passive biomonitors and provide a dense network of sample locations that have been successfully used to map air pollution in urban environments [27]. They can intercept atmospheric PM on the leaf surface, thereby forming foliar dusts [3, 28]. As a passive pollution indicator, foliar dusts have the potential to be used for atmospheric pollution monitoring [3]. PM can be retained on the leaf surface due to their architectural peculiarities [30]. The deposition rate of PM on the surface of leaves has been found to be influenced by the atmospheric relative humidity (RH), which leads to the buildup of PM on the leaves [31]. Ziziphus spina-christi, also known as Sidra, is classified as a tropical evergreen tree predominantly cultivated in close proximity to road constructions, rendering them vulnerable to exposure to PM, particularly on their leaf surfaces [29], and has the potential to serve as a significant recipient of pollution. Their leaves have the capacity to retain not only gaseous pollutants but also particulates, which could be utilized to directly mitigate air pollution by either removing pollutants or inhibiting the formation of secondary pollutants [32]. Their leaves showed 1.36–1.79 times greater ability to adsorb and accumulate the PM compared to other plant species, such as Eucalyptus camaldulensis, Prosopis juliflora, and Dodonaea viscosa [31]. The genus Ziziphus, belonging to the family Rhamnaceae, encompasses over 100 species of both deciduous and evergreen plants and shrubs. These species are predominantly found in tropical locations across the globe that are drought-tolerant and have exceptional regenerative power [33]. The utilization of plants for the purpose of biomonitoring air pollution has garnered significant interest over the past 20 years. This approach has been recognized as an effective, straightforward, and cost-effective method for tracking the dispersion of contaminants in the atmosphere [34-36]. A study examined heavy and toxic metal pollution in foliar samples from plant leaves along the outer-ring expressway of China's largest city [37] and found Zn and Cu were higher in foliar dust than roadside dust, whereas Pb and Cd were higher in roadside dust. Aerial deposition is the main source of Cd and Pb in dust, whereas highway traffic is the main source of Cu and Zn [37]. An investigation conducted in Budapest, Hungary, revealed that the inclusion of foliar dust deposits is crucial for assessing the air purification potential of urban trees [38]. Traffic emissions, industrial activities, and natural weathering were the main sources of heavy metals in road and foliar dust [39].
Z. spina-christi (Sidra) is a prevalent tree species ubiquitous in Qatar's metropolitan areas; however, research using its leaves as a bioindicator for detecting environmental contaminants is scarce. This study shows the plant's suitability as a bioindicator for monitoring atmospheric pollution in Qatar, potentially offering an alternative to the time-consuming and expensive active monitoring samplers. Moreover, the study assessed the levels of contamination using pollution indices.
2 Materials and Methods
2.1 Sampling Area
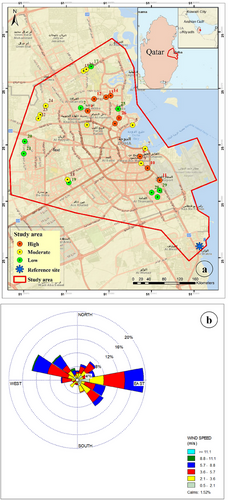
Doha, Qatar is situated within the geographical coordinates of 25° 09′ 30″–25° 25′ 00″ N and 51° 23′ 30″–51° 38′ 00″ E. Its average elevation is roughly 10 m above sea level, encompassing an area of approximately 368 km2 (Figure 1). The region experiences annual temperature fluctuations, ranging from 45°C during the summer months with elevated levels of RH ranging between 41.0% and 71.0% [40] to approximately 5°C during the winter season. This RH is positively correlated (r = 0.53) with the PM deposition [41]. The average annual precipitation in this area amounts to 78 mm [42]. Qatar's desert climate has hot summers and temperate winters, with precipitation mainly occurring in winter and early spring. The northern regions experience 30% more precipitation than the southern ones [43]. Recent studies show an increase in rainy days from December to February, decreasing from March to April [44]. Samples were collected over the course of a week, from October 16 to 23, 2022, to evaluate the concentrations of metals and density of PM in foliar dust samples. The investigation occurred in the aftermath of a substantial rainfall event in Qatar on July 28, 2022. The rain may have affected the amount of dust accumulated on the leaves of the trees adjacent to the roadways. Leaves of Z. spina-christi were collected randomly from specific roadsides and gardens as representatives for 29 sampling locations. Descriptions on the sampling sites are given in Table S1 (https://data.mendeley.com/datasets/79grjj6brf/2). Al-Wakra public garden was chosen as a reference site (refer to Figure 1 and Table S1) as this site is located 21 km outside of Doha city and away from the traffic. These locations encompass urban areas with varying levels of traffic intensity (number of vehicles/hour), classified as high (>10 000), moderate (<10 000 and >6000), and low (<6000), based on data provided by the Public Works Authority of Qatar (Ashghal, personal communication, November 6, 2022) (refer to Table S2). The EPA [45] asserts that background samples can be obtained from reference locations situated away from the location in question. On each roadside, a total of three sites were chosen, and within each site, three individual trees were picked by a random sampling process. Wind speed and direction were considered during sampling. The wind parameters were measured using meteorological instruments, including sensors for wind speed, wind direction, ambient temperature, RH, sun radiation, and air pressure. The Vantage2 Pro system from Davis, USA was utilized for this purpose. The WRPLOT software was employed to conduct frequency analysis of wind direction and speed. A total of 30 leaves, in two replicates, were gathered from each site at a height ranging from 1.5 to 2 m. The leaves were carefully placed in sealed plastic bags for preservation. The samples were stored in a hermetically sealed plastic bag at a temperature of 4°C prior to analysis.
2.2 Sample Preparation
The leaves were rinsed with double-distilled water (DDW) (IQ 7010, Merck, USA), while brushing with fine bristles to allow any PM on the leaf surface to be gathered into the water [31, 46]. The dust particles suspended in the DDW were filtered using a (Whatman, UK) nitrate cellulose membrane (47 mm diameter, 0.22 µm pore size) pre-dried at 50°C to constant weight [46]. Prior to metal analysis, the filter papers were calculated for PM density as discussed in Section 2.4. Samples in filter paper were added with a mixture of 9 mL of 65% nitric acid (Puriss, Honeywell, USA) and 2 mL of 48% hydrofluoric acid (ARISTAR, VWR Chemicals, Belgium) in a 50 mL PTFE digestion tube. The samples were digested using a microwave digestion system (MARS 6, CEM, USA) and preserved in 2 mL of nitric acid diluted to a 50 mL final volume prior to analysis [47].
2.3 Metal Analysis
The digested samples were mixed and divided into equal portions, then transferred into 15 mL conical centrifuge tubes (Falcon, Fisher Scientific, USA) for subsequent analysis. The metals Al, Ba, Cd, Cr, Cu, Ca, Fe, K, Mg, Mn, Pb, and Zn were analyzed using ICP-OES with the Optima 5300 DV instrument (Perkin Elmer, USA). Simultaneous multi-calibration curve fitting with auto-fit and background correction was used, and the signal-to-background ratio was taken into consideration throughout the analysis. The calibration curve was prepared using a multi-element calibration solution (Custom Inorganic Standard, HPS-137-647-100, USA), consisting of six data points. The metal concentrations were utilized to create a distinct distribution pattern in relation to the levels of traffic intensity. The calibration and analysis were validated using trace metals certified reference material (CRM) solution (National Institute of Standards and Technology [NIST]-1643f, USA). The data were processed using WIN LAB 32 software. The distribution analysis was conducted using the ordinary Kriging method and the spherical semi-variogram model, which is a spatial analyst tool integrated into ArcGIS Desktop (version 10.8.1), and consistent parameters were implemented across all evaluated metals. Moreover, our study area was designated as a mask in raster analysis and as an extent in the processing extent tool within the environmental settings. The Kriging method assigns weights based not solely on the distance between the measured points and the prediction site (as in the inverse distance weighting [IDW]), but also on the comprehensive spatial configuration of the measured points [48].
2.4 PM Density in Leaf Surface
2.5 Contamination Factor (CF)
CF values were classified into four categories: no/low contamination (CF < 1), moderate contamination (1 ≤ CF < 3), considerable contamination (3 ≤ CF < 6), and very high contamination (CF ≥ 6).
2.6 Pollution Load Index (PLI)
The PLI was introduced by Tomlinson et al. [51] to evaluate pollution levels in estuaries and is considered the standardized criterion for comparing contamination degrees across various sites. In this study, a variety of CFs will be established for the individual metals evaluated at each site as analyzed in the foliar dusts collected from the surface of the leaves.
Pollution can be quantified as follows: PLI value <1 indicates the absence of pollution and minimal ecological risk. 1 < PLI < 2 (unpolluted-to-moderate pollution), 2 < PLI < 3 (moderate), 3 < PLI < 4 (moderate-to-high), 4 < PLI < 5 (high), PLI > 5 (severe) [52].
2.7 Morphological Analysis
Leaf samples from the same sites and trees were dehydrated and treated for scanning electron microscopy coupled with energy-dispersive x-ray (SEM/EDX) spectroscopy (Nova NanoSEM 450, FEI, USA). SEM-EDX analysis was performed according to Singh et al. [46] using ethanol (absolute ≥99.5%, VWR Chemicals, USA) solutions of varying concentrations (50%, 60%, 70%, 80%, 90%, and 100%) for two cycles, each lasting 15 min. The dehydrated leaves were sputter coated with gold layer using SEM coating equipment (AGAR SPUTTER COATER, Agar Scientific, UK). The surface area of the collected leaves was measured using a flatbed scanner model HP Scanjet 5590 and ImageJ 1.53e software (http://imagej.nih.gov/ij). The SEM-EDX analyzed the size and density of the leaf's stomata, surface fractures, and leaf surface contamination (element map).
2.8 Quality Assurance and Quality Control (QA/QC)
Reagent blanks, spiked solutions, and CRMs were used to assess the accuracy and reliability of the analysis. A minimum of 10% of the collected samples were employed as replicate samples [53]. Indoor Dust CRM (NIST-2584) and the Marine Sediment Certified Reference Material (PACS-3) from the NIST were used as reference standards. All samples were analyzed in triplicate with an average weight of 0.1 ± 0.05 g. The limit of detection (LOD) was established by calculating the standard deviation of 10 blank samples and then multiplying that value by 3 [54]. LOD was evaluated using a signal-to-noise ratio (S/N) ranging from 3:1 to 5:1 [55]. The limit of quantification (LOQ) was determined by calculating the standard deviation of 10 blank samples and then multiplying that value by 10. The LOQ must align with an S/N ratio from 5:1 to 10:1 [55]. LOQ and LOD, including percentage recovery of the analyzed metals, are presented in Table S3. All results obtained were within the percent (%) recovery range of 85%–115% [53].
2.9 Statistical Analysis
The dataset was analyzed using various statistical software, including IBM SPSS Statistics 29, Minitab 17.3.1, Past 4, and Origin Lab (OriginPro 2021). The Shapiro–Wilk test was conducted to validate the assumptions for parametric testing and to assess normality. The variables failing to meet normality were subjected to log transformation. Levene's test was utilized to evaluate the homogeneity of variances. ANOVA was performed to investigate statistically significant differences in metal concentrations across varying traffic intensity levels categorized as low, moderate, and high [56], followed by post hoc Tukey's honestly significant difference (HSD) test to pinpoint specific group mean differences, such as between low and high traffic intensity.
Traffic intensity clustering was executed using Minitab software, employing the Ward Linkage method alongside a Euclidean distance dendrogram. The Ward linkage method merges nearest clusters iteratively using Euclidean distance, minimizing within-cluster variation. The resultant dendrogram visually illustrates the merging process. Principal component analysis (PCA) was also utilized to reduce dataset dimensionality and visually depict the relationships between metallic deposits on leaf surfaces and traffic intensity [57]. To ensure that all features contributed equally to the analysis, the data were normalized using Z-score normalization before applying PCA. The CF was calculated by dividing the metal concentration at sample sites to that of reference sites, providing insights into the relative availability of trace metals from polluted versus unpolluted sites. The Pearson correlation coefficient was computed using SPSS to assess the linear relationship between traffic intensity and metal concentration [58]. This coefficient ranges from −1 to 1, with values near these extremes indicating a strong relationship. Finally, discriminant analysis was conducted using Past 4 software to categorize samples and predict dependent variable groups. Discriminant analysis was used to categorize samples based on metallic deposits on leaf surfaces (dependent variable) and traffic intensity (independent variables). Before applying the analysis, assumptions of multivariate normality, homogeneity of variance–covariance matrices, and independence of observations were checked. Discriminant functions were determined by identifying linear combinations of the predictor variables that best separated the groups, using a training dataset where group membership was known [59].
3 Results and Discussion
3.1 Vehicular Traffic-Related Metals
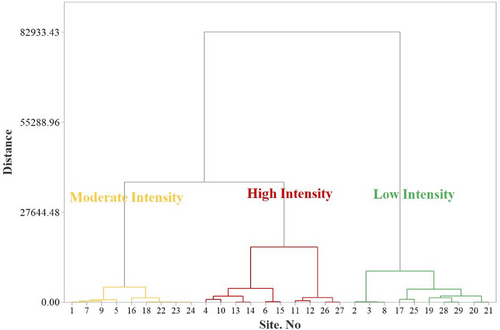
Three groups of traffic intensity (low, moderate, and high) were categorized using the Ward Linkage with Euclidean distance cluster analysis, along with 2 weeks of hourly traffic counts data obtained from Ashghal (Table S2 and Figure 2). The mean metal concentrations (in mg/kg) found in foliar dust collected in Z. spina-christi were classified into three distinct groups based on the level of vehicular activity (Table 1). In the present study, the metals with the highest concentrations in high traffic intensity sites were Al (Site 26), Cr (Site 26), Cu (Site 14), Fe (Site 26), K (Site 27), Mn (Site 26), Pb (Site 4), and Zn (Site 27), with maximum metal concentrations reaching up to 50 580, 183.0, 260.4, 30 049.3, 13 770, 545.8, 158.6, and 1281 mg/kg, respectively (Table 1). In moderate traffic intensity sites, Ca (Site 15) and Cd (Site 1) obtained the highest concentrations of 193 200 and 1.5 mg/kg, respectively. In low traffic intensity sites, Ba (Site 19) and Mg (Site 21) had a maximum concentration of 495.4 and 54 990 mg/kg, respectively. Metal accumulation in plant leaves through foliar transfer happens after deposition of dust particles on the leaf surface. It is, however, difficult to determine whether the accumulated metals in plant leaves are derived from the soil by root absorption or from the atmospheric dust deposit on the leaf surface. Studies have reported that the foliar dust exhibited a greater concentration of heavy metals compared to the road dust samples [39] than the corresponding background soil [60]. This disparity can be attributed to the prolonged accumulation of heavy metals in the foliar samples over an extended period.
| Sample sites | ||||||||||||
|---|---|---|---|---|---|---|---|---|---|---|---|---|
| High traffic intensity | Moderate traffic intensity | Low traffic intensity | ||||||||||
| Metal | Mean | Max | Min | Mean | Max | Min | Mean | Max | Min | Reference site | F | p value |
| Al | 35 960 ± 7344 | 50 580 | 23 330 | 31 780 ± 5858 | 40 340 | 13 650 | 30 450 ± 4908 | 41 020 | 22 380 | 13 530 ± 189.4 | 4.53 | 0.015* |
| Ba | 328.8 ± 81.2 | 462.2 | 218.9 | 346.4 ± 60.7 | 412.9 | 193.8 | 350.2 ± 77.3 | 495.4 | 234.9 | 122.3 ± 1.7 | 0.23 | 0.795 |
| Ca | 117 700 ± 23 040 | 149 900 | 70 660 | 141 600 ± 34 810 | 193 200 | 62 990 | 139 000 ± 25 960 | 185 000 | 91 240 | 205 500 ± 2877 | 3.93 | 0.026* |
| Cd | 0.8 ± 0.3 | 1.2 | 0.3 | 0.5 ± 0.4 | 1.5 | 0.1 | 0.7 ± 0.3 | 1.3 | 0.2 | 0.1 ± 0.01 | 1.92 | 0.159 |
| Cr | 140.6 ± 26.6 | 183.0 | 86.5 | 118 ± 21.6 | 164.5 | 55.0 | 113.3 ± 15.8 | 135.6 | 89.0 | 44.7 ± 0.6 | 8.36 | 0.001* |
| Cu | 165.2 ± 43.7 | 260.4 | 94.8 | 119.5 ± 35.7 | 190.0 | 75.3 | 127.3 ± 51.3 | 244.4 | 61.4 | 20.7 ± 0.3 | 5.68 | 0.006* |
| Fe | 25 040 ± 3637 | 30 050 | 18 320 | 22 200 ± 2856 | 28 480 | 16 880 | 21 470 ± 3048 | 25 560 | 16 610 | 16 890 ± 236.5 | 6.77 | 0.002* |
| K | 8774 ± 2191 | 13 770 | 5596 | 8831 ± 2445 | 15 610 | 3426 | 8094 ± 1943 | 12 520 | 5229 | 3325 ± 46.6 | 1.12 | 0.334 |
| Mg | 40 790 ± 4598 | 45 420 | 32 070 | 41 570 ± 6619 | 51 970 | 28 030 | 45 430 ± 5752 | 54 990 | 36 880 | 31 670 ± 443.5 | 2.17 | 0.125 |
| Mn | 447.5 ± 65.3 | 545.8 | 264.8 | 396.6 ± 66.2 | 544.6 | 253.9 | 390.8 ± 49.6 | 483.0 | 304.5 | 268.7 ± 3.8 | 5.08 | 0.010* |
| Pb | 52.6 ± 38.8 | 158.6 | 10.5 | 44.2 ± 40.9 | 186.0 | 8.0 | 39.3 ± 35.8 | 125.5 | 7.9 | 3.9 ± 0.8 | 0.53 | 0.593 |
| Zn | 770.8 ± 289.9 | 1281 | 289.5 | 517.8 ± 226.2 | 1249 | 186.1 | 531.3 ± 272.1 | 1192 | 211 | 65.4 ± 0.9 | 5.55 | 0.006* |
- * The mean difference is significant at the 0.05 level.
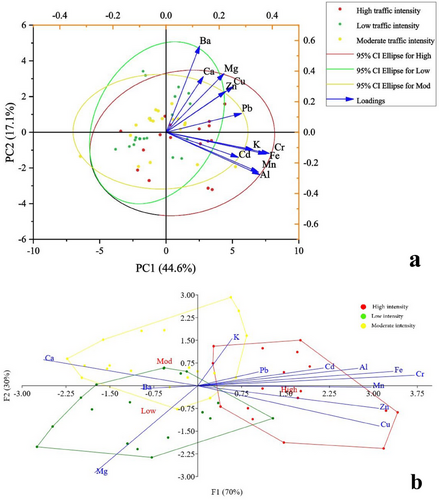
The ANOVA test (Table 1) revealed a significant difference (p < 0.05) in the metals’ concentrations (mg/kg) of Cr, Fe, Cu, Zn, Mn, Al, and Ca among the high, moderate, and low traffic intensity groups. Other metals did not show any significant difference. PCA was utilized to examine the correlation between metal content and traffic load. The biplot of the first two principal components (PCs) was obtained using the Varimax rotation approach, and the rotation process successfully converged in three rounds. This biplot accounts for approximately 61% of the overall variance (Figure 3, Table 2).
| Initial eigenvalues | Loadings | |||||
|---|---|---|---|---|---|---|
| Component | Total | % of variance | Cumulative % | Variables | PC1 | PC2 |
| 1 | 5.353 | 44.61 | 44.61 | Al | 0.817 | |
| 2 | 2.053 | 17.11 | 61.72 | Cr | 0.901 | |
| 3 | 1.847 | 15.39 | 77.11 | Mn | 0.805 | |
| 4 | 1.141 | 9.511 | 86.62 | Fe | 0.871 | |
| 5 | 0.649 | 5.406 | 92.03 | K | 0.758 | |
| 6 | 0.312 | 2.596 | 94.62 | Cd | 0.613 | |
| 7 | 0.245 | 2.042 | 96.67 | Pb | 0.659 | |
| 8 | 0.166 | 1.385 | 98.05 | Cu | 0.588 | |
| 9 | 0.083 | 0.694 | 98.74 | Zn | 0.520 | |
| 10 | 0.074 | 0.613 | 99.36 | Ba | 0.815 | |
| 11 | 0.055 | 0.461 | 99.82 | Mg | 0.541 | |
| 12 | 0.022 | 0.183 | 100.0 | Ca | 0.502 | |
The initial two PCs accounted for 44.6% and 17.1% of the variance, respectively (Figure 3a, Table 2). Hjortenkrans et al. [18] and Moghadas et al. [61, 62] stated that Cd, Cr, Cu, Pb, and Zn are characterized as traffic-related metals generated from the roadside and urban air emissions. Moreover, Al, Fe, and Mn are identified as sources that arise from emissions connected to natural processes and road activity, whereas Ca, K, and Mg originate only from natural sources [63]. Ca accumulation in urban vegetation can also be attributed to the widespread use of artificial Ca-rich materials [64-66]. Discriminant analysis was applied to demonstrate the metals associated with traffic intensity groups [67]. Figure 3b provides evidence of a significant positive correlation among Al, Cr, Mn, Fe, K, Cd, Pb, Cu, and Zn and high traffic intensity. This correlation supports the assertion that these metals are associated with vehicular traffic. In contrast, it can be observed that Ba, Mg, and Ca have a negative correlation with high traffic intensity, indicating that they do not originate from sources associated with traffic-related metals. Our findings were consistent with the results reported by Alexandrino et al. [63]. Upon comparing the mean concentrations derived from the sample sites, it is evident that there is a significant increase (p < 0.05) in concentrations for all metals as traffic intensity increases, with the exception of Ba, Ca, and Mg (Table 1). The concentrations of metals (except for Ca) observed at the sampling sites were found to be higher compared to the concentrations documented at the reference site (Table 1).
The implementation of additional traffic lights and roundabouts plays a crucial role in the regulation of traffic flow. However, it is worth noting that the braking of vehicles that concentrate on these junctions can significantly contribute to non-exhaust emissions originating from the tire wear, resulting in the increase of Zn, Cd, Cr, Cu, and Pb. Brake linings also contribute to the emission of Fe, Cu, Sb, Ba, Al, Zn, Cr, Pb, and a small quantity of Cd. [23]. A Pearson correlation coefficients test was performed among the analyzed metals, and the results showed that several metals had strong positive correlations with each other, indicating that they often co-occur in the environment (Table 3). Fe–Cr (0.907), Mn–Fe (0.882), Cr–Al (0.864), Mn–Cr (0.854), and Mn–Al (0.802) showed a very strong positive correlation, which suggests that these metals likely have common sources or similar environmental behaviors. They could be associated with similar pollution sources or geological features. Cu–Ca (−0.132), Ca–Cr (−0.107), Ba–Cd (−0.103), and Mn–Ca (−0.086) showed a very weak negative correlation, suggesting that there are no strong direct relationships between the studied variables. The traffic intensity showed moderate positive correlations with Al (0.437), Cr (0.485), Cu (0.357), Fe (0.415), and Zn (0.424); weak positive correlations with Cd (0.265) and Mn (0.307); and weak negative correlations with Mg (−0.232) and Ca (−0.261). This suggests that traffic intensity is associated with higher levels of several metals, particularly Al, Cr, Fe, Cu, and Zn. This could be due to various factors, such as vehicle emissions, tire and brake wear, or road dust. The Pearson correlation test results were consistent with the results obtained from the PCA.
| Traffic intensity | Al | Ba | Ca | Cd | Cr | Cu | Fe | K | Mg | Mn | Pb | Zn | |
|---|---|---|---|---|---|---|---|---|---|---|---|---|---|
| PLI | 0.291a | 0.488b | 0.217 | 0.138 | 0.572b | 0.530b | 0.488b | 0.462b | 0.447b | 0.374b | 0.406 | 0.628 | 0.328a |
| Traffic intensity | 1 | 0.437b | 0.000 | −0.261 | 0.265a | 0.485b | 0.357b | 0.415b | 0.185 | −0.232 | 0.307a | 0.137 | 0.424b |
| Al | 1 | 0.128 | 0.098 | 0.555b | 0.864b | 0.287a | 0.781b | 0.764b | 0.243 | 0.802b | 0.342b | 0.329a | |
| Ba | 1 | 0.323a | −0.103 | 0.302a | 0.589b | 0.302a | 0.190 | 0.515b | 0.149 | 0.103 | 0.455b | ||
| Ca | 1 | 0.193 | −0.107 | −0.132 | −0.062 | 0.348b | 0.483b | −0.086 | 0.247 | −0.017 | |||
| Cd | 1 | 0.458b | 0.200 | 0.426b | 0.633b | 0.332a | 0.474b | 0.708b | 0.248 | ||||
| Cr | 1 | 0.637b | 0.907b | 0.610b | 0.325a | 0.854b | 0.453b | 0.548b | |||||
| Cu | 1 | 0.570b | 0.196 | 0.352b | 0.399b | 0.485b | 0.732b | ||||||
| Fe | 1 | 0.607b | 0.292a | 0.882b | 0.359b | 0.445b | |||||||
| K | 1 | 0.391b | 0.609b | 0.555b | 0.206 | ||||||||
| Mg | 1 | 0.344b | 0.542b | 0.219 | |||||||||
| Mn | 1 | 0.332a | 0.217 | ||||||||||
| Pb | 1 | 0.384b | |||||||||||
| Zn | 1 |
- a Correlation is significant at the 0.05 level (2-tailed).
- b Correlation is significant at the 0.01 level (2-tailed).
3.2 Metal Distribution on the Leaf Surface
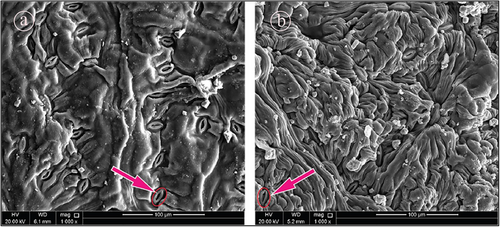
The observed range of leaf surface area was found to be between 5.5 and 28.1 cm2, leaf length varied between 3.2 and 6.4 cm, whereas leaf breadth ranged from 2.3 to 4.2 cm at Sites S11 (a site with high traffic density) and S6 (a park), respectively. The observations found were consistent with the morphological and anatomical characteristics documented by Al-Obaidy et al. [68] in their study on Z. spina-christi. Heavy metal identification originating from traffic and other anthropogenic activities can be determined via morphological and elemental composition analysis [69]. Figure 4 depicts the qualitative elemental content and morphology of the foliar dust that has been deposited on the surface of the Z. spina-christi leaf as analyzed using SEM-EDX.
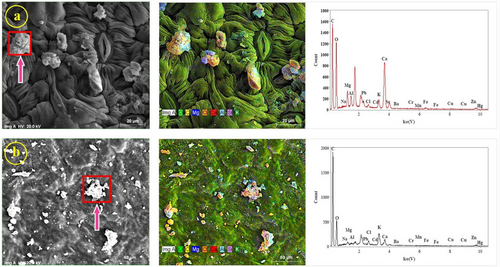
The results of the morphological study corroborated the conclusions drawn from the chemical analysis, which found traces of Fe, Cu, Zn, Cr, Cd, Ba, Mn, and Pb that are traffic-related metals [70, 71], and also the presence of C, Ca, Mg, K, S, O, and Na, which are unrelated traffic-associated element sources [63] (see Figure 4). Al-Obaidy et al. [68] found that the emissions of air pollution in Baghdad City, Iraq, had an impact on the morphological characteristics of Z. spina-christi L., resulting in reduced variability among these attributes. The observed reduction in morphological properties can be attributed to the plant leaves’ response to air pollutants, as they employ this strategy to maintain water balance in leaf tissues. This is achieved by reducing the leaf area, which decreases as the plant experiences more stress and water loss, ultimately enhancing its resistance to adverse conditions [72]. The ongoing phenomenon of dust deposition diminishes the levels of PM within the surrounding atmosphere. This process enhances air quality by capturing and retaining dust particles on leaf surfaces. The SEM-EDX provides unequivocal evidence of the presence of dust grains on both the upper (adaxial) and lower (abaxial) surfaces of the leaves (Figure 5). Nevertheless, variability exists in the quantity of dust deposition observed on various sides of surfaces. It was observed that a greater amount of dust accumulates on the upper surface of leaves. This phenomenon can be explained by the process of sedimentation [73]. The dust on the bottom of the leaf surface is more likely to be impacted by wind currents. The anatomical characteristics of leaf tissues, such as the density of trichomes and stomata, contribute to their ability to effectively trap dust particles [74]. Figure 5 shows a notable number of stomata, accompanied by an adaxial surface characterized by a pronounced roughness. The density of foliar dust deposition during the designated study duration in Sites S17 and S15 represent areas with low and high traffic density, respectively.
3.3 Spatial Distribution of Metals
The spatial distribution of heavy metals in Doha, as assessed through the PLI, reveals distinct patterns that align with local atmospheric dynamics. The wind rose in Figure 1B illustrates that, during the study period, prevailing winds predominantly originated from the west–northwest, accounting for 24% of all hourly wind directions with a peak speed of 11.1 m/s, whereas winds from the east (Arabian Gulf) comprised 19% with a maximum speed of 8.8 m/s. Southwest winds, in contrast, were infrequent. These observations suggest that heavy metals emitted from sources west–northwest of the study area—potentially urban areas with high- to moderate-intensity traffic—may be transported toward the southeast, contributing to elevated PLI values in those regions. Conversely, the lower frequency of southwest winds may limit pollutant dispersal from that direction. This west–northwest-to-southeast wind flow pattern is consistent with Méndez and Bicer [75], who documented a similar directional trend across three locations in Qatar, reinforcing the role of wind as a key factor in shaping the spatial heterogeneity of heavy metal concentrations observed in this study. Figure 6 illustrates spatial patterns of metal distribution in foliar dust samples collected from the leaves of Z. spina-christi L.; which areas are exposed to metal emissions from vehicular traffic (refer to Figure 1)? It is observed that the concentrations of Al, Fe, K, Mn, Cr, Cu, Zn, Pb, and Cd are significantly correlated with high- and moderate-vehicular traffic areas (the northern part of Doha City). Ca, Mg, and Ba levels are correlated with the borders of the study area, where low-intensity traffic and sandstorms are likely to happen.
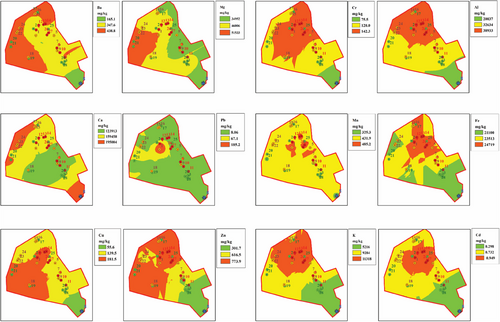
Considerable levels of Zn, Cu, Fe, Cr, Mn, and Al (see Table 1) were detected in dust samples collected from Zones 63 and 66 covering Sites S13, S14, S26, and S27. These sites are characterized by high traffic speed and intensity and a high number of traffic signals along the streets in addition to moderate PM density. These traffic characteristics with a high-rise building around the area may lead to increased levels of deposited metals in dust samples.
Pb, Cd, and K levels were significant in Sites S4 and S1 (Table 4) and were characterized by traffic intensity fluctuating from high to moderate and low density of PM (refer to Table S1). These sites, however, are close to or surrounded by buildings that may hinder wind movement. High-rise buildings are crucial for urban population growth, but their expansion must be managed to reduce environmental harm. The formation of “street canyons” from these buildings can trap pollutants, worsening air quality due to limited air circulation [76]. Building layouts influence the dispersion of ultrafine particles from traffic, increasing pedestrian exposure to harmful pollutants [77]. Cavazzin et al. [27] found that urban–industrial areas with dense high-rise configurations can elevate toxic metal levels, such as Ni and Cr, particularly near industrial sites. This accumulation poses significant health risks to residents, highlighting the need for careful urban planning. A high level of Mg was observed in Sites S20 and S21 (Table S1) at Zone 53 with low traffic intensity and high PM density. A high concentration of Ba was found in Site S19 (Table S1), located at Zone 55 with low traffic intensity and high PM density. The Ca level was substantial only in the reference sites S8 and S15 (Table S1) located in Zones 90 and 68, respectively. These sites were characterized by low-to-moderate traffic intensity and high PM density. Goudie and Middleton [78] found Fe and Al fluxes come from dust deposition extending from the northwest of the Arabian Desert through Qatar down to Oman and the Arabian Sea. Dust from this desert is also reported to be rich in Ca, silicon (Si), Mg, Al, and Fe [26]. Distribution and the variation in the concentration of metals obtained may have been affected by the presence and absence of barriers, for example, surrounding buildings, dust deposition, wind speed and direction, and traffic intensity. The spatial distribution of metals in the study area, as depicted in Figure 6, demonstrates a distinct association between metal discharges and vehicular traffic. The notable occurrence of metals, such as Al, Fe, K, Mn, Cr, Cu, Zn, Pb, and Cd, in the northern region of Doha City corresponds to areas with substantial to moderate levels of vehicular activity. This indicates that automotive travel is a main source of these metals. Conversely, the dispersion of Ca, Mg, and Ba in the vicinity of the research region's boundaries, where traffic volume is low and sandstorms occur frequently, suggests that these metals might stem from natural origins, such as the deposition of dust from the surrounding desert. The prevailing wind direction from the east, while west–northwest, also influences the spread of these metals.
| Contamination factor (CF) | |||||||||||||
|---|---|---|---|---|---|---|---|---|---|---|---|---|---|
| Site. no. | Al | Ba | Ca | Cd | Cr | Cu | Fe | K | Mg | Mn | Pb | Zn | PLIsite |
| S1 | 3.0 | 2.2 | 0.7 | 22.2 | 3.4 | 6.3 | 1.6 | 4.1 | 1.6 | 2.0 | 100.3 | 5.1 | 2.0 |
| S2 | 2.4 | 2.4 | 0.8 | 14.4 | 2.5 | 5.0 | 1.3 | 3.0 | 1.5 | 1.6 | 63.1 | 4.4 | 1.8 |
| S3 | 2.1 | 2.4 | 0.6 | 4.8 | 2.4 | 3.1 | 1.2 | 2.1 | 1.4 | 1.5 | 9.1 | 3.5 | 1.5 |
| S4 | 2.6 | 2.8 | 0.6 | 16.5 | 3.4 | 10.4 | 1.5 | 3.0 | 1.4 | 1.7 | 111.5 | 13.4 | 2.1 |
| S5 | 2.4 | 2.3 | 0.5 | 6.2 | 2.9 | 5.1 | 1.3 | 2.5 | 1.0 | 1.4 | 14.7 | 7.4 | 1.6 |
| S6 | 2.2 | 1.8 | 0.4 | 12.0 | 2.5 | 4.8 | 1.2 | 2.3 | 1.1 | 1.7 | 19.7 | 6.5 | 1.6 |
| S7 | 2.2 | 2.8 | 0.7 | 3.8 | 2.2 | 3.8 | 1.2 | 2.5 | 1.2 | 1.4 | 14.2 | 6.6 | 1.6 |
| S9 | 1.6 | 2.5 | 0.5 | 4.8 | 2.0 | 6.6 | 1.2 | 1.6 | 1.1 | 1.3 | 11.9 | 4.8 | 1.5 |
| S10 | 2.4 | 3.1 | 0.6 | 4.7 | 2.7 | 7.0 | 1.4 | 2.4 | 1.1 | 1.5 | 10.3 | 5.0 | 1.6 |
| S11 | 2.2 | 3.3 | 0.5 | 5.4 | 3.0 | 9.2 | 1.5 | 2.0 | 1.4 | 1.7 | 19.4 | 11.4 | 1.8 |
| S12 | 2.2 | 2.1 | 0.5 | 11.2 | 2.5 | 8.3 | 1.2 | 1.7 | 1.1 | 1.2 | 55.7 | 13.9 | 1.8 |
| S13 | 2.9 | 3.0 | 0.7 | 15.8 | 3.4 | 7.1 | 1.7 | 3.1 | 1.4 | 1.9 | 42.8 | 13.1 | 2.0 |
| S14 | 2.9 | 3.7 | 0.7 | 14.6 | 3.7 | 11.1 | 1.7 | 3.4 | 1.4 | 1.7 | 61.1 | 17.1 | 2.1 |
| S15 | 2.5 | 3.0 | 0.9 | 9.3 | 2.3 | 4.8 | 1.1 | 3.2 | 1.4 | 1.3 | 28.4 | 7.7 | 1.8 |
| S16 | 2.2 | 3.0 | 0.7 | 5.8 | 2.7 | 6.5 | 1.3 | 2.2 | 1.2 | 1.3 | 29.3 | 15.4 | 1.7 |
| S17 | 2.2 | 3.0 | 0.6 | 5.7 | 2.6 | 5.6 | 1.3 | 2.2 | 1.3 | 1.3 | 16.3 | 9.0 | 1.7 |
| S18 | 1.9 | 3.2 | 0.5 | 2.3 | 2.7 | 7.7 | 1.4 | 2.1 | 1.4 | 1.5 | 18.2 | 9.2 | 1.6 |
| S19 | 2.2 | 4.1 | 0.6 | 2.8 | 3.0 | 11.3 | 1.5 | 2.3 | 1.4 | 1.6 | 24.9 | 15.1 | 1.8 |
| S20 | 2.4 | 3.2 | 0.7 | 16.5 | 2.8 | 8.7 | 1.3 | 2.8 | 1.7 | 1.5 | 96.5 | 14.5 | 2.0 |
| S21 | 1.7 | 3.5 | 0.9 | 9.8 | 2.1 | 6.7 | 1.0 | 2.0 | 1.7 | 1.2 | 47.7 | 8.0 | 1.8 |
| S22 | 2.6 | 3.4 | 0.9 | 10.2 | 2.8 | 6.0 | 1.4 | 3.0 | 1.5 | 1.6 | 43.2 | 5.0 | 1.9 |
| S23 | 2.5 | 3.0 | 0.8 | 9.0 | 2.8 | 4.7 | 1.3 | 2.8 | 1.5 | 1.5 | 63.8 | 10.1 | 1.9 |
| S24 | 2.7 | 3.2 | 0.8 | 17.1 | 2.8 | 6.9 | 1.4 | 2.9 | 1.4 | 1.6 | 47.4 | 8.8 | 1.9 |
| S25 | 3.0 | 2.7 | 0.7 | 11.6 | 2.9 | 5.0 | 1.5 | 3.7 | 1.2 | 1.6 | 23.2 | 6.1 | 1.8 |
| S26 | 3.8 | 1.9 | 0.5 | 14.3 | 4.1 | 7.3 | 1.8 | 2.7 | 1.3 | 2.0 | 29.2 | 10.9 | 1.9 |
| S27 | 3.2 | 2.7 | 0.7 | 20.2 | 3.2 | 6.9 | 1.6 | 4.2 | 1.4 | 1.7 | 51.7 | 19.8 | 2.1 |
| S28 | 2.0 | 2.0 | 0.5 | 6.8 | 2.1 | 4.5 | 1.1 | 1.8 | 1.3 | 1.3 | 8.1 | 6.0 | 1.5 |
| S29 | 2.4 | 2.8 | 0.7 | 2.8 | 2.7 | 6.2 | 1.3 | 2.2 | 1.5 | 1.6 | 8.4 | 7.4 | 1.6 |
3.4 Assessment of Metal Pollution in Each Site
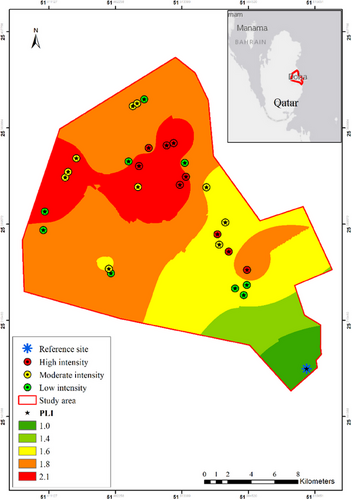
The degree of pollution for the individual metals in each sampling site was calculated using the CF and PLI within sites (PLISite) and is represented in Table 4. In the low traffic intensity sites (S2, S3, S17, S19, S20, S21, S25, S28, S29), CF values show moderate contamination, especially with Cd, Cr, Cu, Pb, and Zn, whereas the same sites were considerably contaminated with Al, Ba, Fe, K, Mg, and Mn. The PLI presented unpolluted-to-moderate pollution (1.47–2.08) in the low traffic intensity sites. In the moderate traffic intensity sites (S1, S5, S7, S9, S16, S18, S22, S23, S24), CF values presented moderate contamination with Cd, Cr, Cu, Pb, and Zn. Although these sites were under considerable contamination with Al, Ba, Fe, K, Mg, and Mn, the PLI was considered unpolluted to moderate pollution (1.66–2.11). In the high traffic intensity sites (S4, S6, S10, S11, S12, S13, S14, S15, S26, S27), CF values show moderate contamination with Cd, Cr, Cu, Pb, and Zn, and considerable contamination with Al, Ba, Fe, K, Mg, and Mn. PLI was unpolluted to moderately polluted (1.50–2.08) in the same high traffic intensity sites. The low traffic intensity sites show moderate contamination for most metals and unpolluted-to-moderate pollution levels. The moderate traffic intensity presented a similar contamination level to low traffic intensity with slightly higher PLI values, indicating a trend toward moderate pollution. The high traffic intensity sites showed consistent moderate contamination across metals with PLI values indicating unpolluted-to-moderate pollution, but with a tendency toward higher pollution levels compared to low and moderate traffic intensity sites. Figure 7 illustrates the fluctuation in contamination levels across several sites through a spatial distribution of pollution, utilizing the PLI in conjunction with traffic intensities. Moreover, PLI showed significant correlations with the analyzed metals. PLI is significantly positively correlated (p > 0.05) with Al, Cd, Cr, Cu, Fe, K, Mg, Mn, Pb, and Zn, indicating that higher concentrations of these metals contribute to higher pollution levels. Traffic intensity shows significant positive correlations (p > 0.05) with Al, Cd, Cr, Cu, Fe, Mn, and Zn, suggesting that higher traffic intensity is associated with higher concentrations of these metals. Our results were comparable with those obtained by Alexandrino et al. [63].
4 Conclusion
The study investigated the dispersion and origins of heavy metals (Al, Ba, Cd, Cr, Cu, Ca, Fe, K, Mg, Mn, Pb, and Zn) in foliar dust accumulated on Z. spina-christi leaves along roadsides of Qatar. The study categorized sampling locations into three groups of vehicular traffic intensity (low, moderate, and high) using Ward Linkage with Euclidean distance cluster analysis and 2 weeks of hourly traffic counts data from Ashghal. The morphological study confirmed the presence of vehicular traffic-related metals as trace metals, whereas other elements like C, Ca, Mg, K, S, O, and Na were unrelated to vehicular traffic sources. Dust grains were found on the upper and lower surfaces of Z. spina-christi leaves, with a greater amount accumulating on the upper surface. The study underscored the significant role of vehicular traffic in elevating environmental pollution levels, with strong correlations observed for metals like Al, Cr, Fe, Cu, and Zn, whereas Ca and Mg showed weaker correlations, suggesting additional sources. Ba exhibited a moderate correlation with traffic. The PLI and CF assessments revealed moderate contamination levels across the study sites, with strong inter-elemental correlations suggesting common emission sources, primarily attributed to traffic-related activities. On the basis of our findings, it is suggested to utilize Z. spina-christi leaves as a bioindicator of traffic-related metals and an alternate suitable environmental monitor. Further research is needed to illustrate the effectiveness of this plant as a sustainable bioindicator for monitoring air quality in urban areas.
Author Contributions
All authors contributed to the study conception and design. Material preparation, data collection, and analysis were performed by Ahmed Abou Elezz, Noora Al-Naimi, Azenith Castillo, and Hamood Abdulla Alsaadi. The first draft of the manuscript was written by Ahmed Abou Elezz, and all authors wrote and reviewed previous and final versions of the manuscript. All authors approved the final manuscript.
Acknowledgments
The authors would like to thank the Public Parks Department at the Ministry of Municipality for providing the needed information to locate streets and parks that have Ziziphus spina-christi and the Roads Operation & Maintenance Department at the Public Works Authority for providing the traffic count data. The Scanning Electron Microscopy coupled with Energy Dispersive X-ray (SEM/EDX) Spectroscopy (Nova NanoSEM 450, FEI, USA) was analyzed in the Central Laboratories Unit, Qatar University. We acknowledge the support of our Technical Manager, Mrs. Thoraya Alyafei, and the help of the technical staff while conducting the analysis. Our thanks also go to Prof. A. Goody for the review of the English language.
Conflicts of Interest
The authors declare no conflicts of interest.
Open Research
Data Availability Statement
The data that support the findings of this study are available from the corresponding author upon reasonable request.


