The Impact of Partial Cake Reslurrying on Displacement Washing
Abstract
Displacement washing is a common process to enhance product quality by removing solutes or contaminants from filter cakes after filtration. However, partial reslurrying of the cake surface during wash liquid application unintentionally contaminates the wash liquid early, reducing washing efficiency. This study identifies partial cake reslurrying as a novel limiting mechanism, demonstrated through experimental wash curves. The resulting wash liquid contamination, quantified by the cake reslurry ratio φ, deteriorates washing outcomes. Experimental evaluation and discussion of various process parameters highlight their influence on washing outcomes, leading to practical recommendations for the optimization of displacement washing processes.
1 Motivation
In industrial processes, filter cakes are commonly washed after formation to remove impurities or recover valuable substances dissolved in the pore liquid. Displacement washing is employed across various industries, including chemical, pharmaceutical, food, pigment, and mining sectors. It is performed using either continuous (e.g., belt filters) or batch-operated equipment (e.g., nutsch filters), under vacuum or overpressure conditions. The wash liquid is typically applied to the surface of the filter cake using nozzles, drip plates, or other distribution systems. However, during wash liquid application, the kinetic energy of the liquid can partially destroy the cake structure, leading to reslurrying of the cake surface. This reslurrying causes the pore liquid—containing dissolved substances—to mix with the wash liquid, resulting in contamination. Such contamination limits the effectiveness of the washing process, as it reduces the purity of the wash liquid and thus the overall washing performance.
Recent studies in the field of displacement washing show the influence of various aspects on the success of washing. Brückner et al. show the effect of pre-dewatering on the washing result [1]. Ottoboni et al. show the influence of cake washing on the material properties of a pharmaceutical product [2]. Kinnarinen et al. describe the recovery of sodium from bauxite residue by pressure filtration and cake washing on a vertical filter press [3]. Yildiz et al. report on the dewatering of segregated filter cakes by vibration compaction on horizontal belt filters [4]. Sauer et al. describe the influence of inhomogeneous cake geometries on the result of dewatering and cake washing [5] and present a modeling approach to mechanical gas dewatering of filter cakes with non-uniform cake height [6]. In another publication, they investigate the effect of fine particle top layers on the outcome of displacement washing of filter cakes [7]. The impact of crystallization conditions and cake washing on the crystal shape is shown by Martynek et al. [8]. A potential impact of wash liquid application on the washing result is often overlooked. Although a negative influence of the wash liquid application and the associated partial cake reslurrying has already been reported by several authors [9, 10], no quantitative evaluation of its impact on the washing result has been carried out to date.
In practice, process control strategies to prevent partial cake reslurrying are largely based on empirical knowledge. A quantitative description of this phenomenon has not been available until recently. Henn et al. have introduced a method for quantitatively assessing the extent of partial filter cake reslurrying [11]. By introducing the cake reslurry ratio φ, a quantitative assessment of the extent of partial cake reslurrying during wash liquid application is enabled. This study investigates the impact of partial cake reslurrying on the outcome of displacement washing by applying the newly established concept of the cake reslurry ratio φ, thereby addressing a critical gap in the quantitative description of wash liquid application effects.
2 Theoretical Background
The industrial-relevant wash ratios are in the range of 0.5 < W < 3.0 [12]. For the evaluation of washing experiments, the residual content X is usually plotted as a function of the wash ratio W, resulting in a wash curve. Fig. 1 shows a typical wash curve for displacement washing processes, compared to ideal displacement.
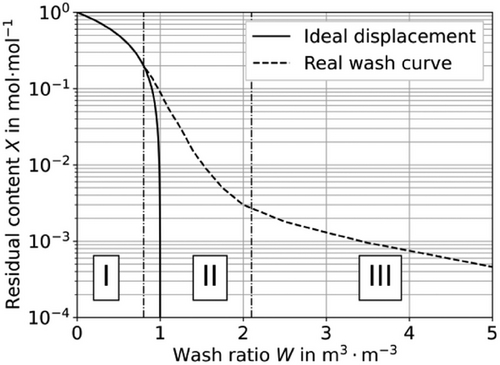
In ideal displacement, the pore liquid is removed by the wash liquid in a plug flow manner. Once the pore liquid is fully displaced (W = 1), the residual content drops to X = 0. Flow inhomogeneities within real filter cakes cause deviations of the actual wash curve from the ideal displacement behavior. According to the current state of knowledge, a wash curve can be divided into three regimes, each named after the dominant mechanism of solute transport. In the displacement regime (I), the washing can be described by ideal displacement of the pore liquid. In the dispersion regime (II), the experimented wash curve detaches from ideal displacement due to flow-induced backmixing processes, i.e., dispersion effects within the filter cake [12-17]. In the diffusion regime (III), the washing process is considered to be limited by process time due to the diffusion or desorption of impurities from the particle surface or impermeable pores [10, 13, 17, 18].
The removal of pore liquid by dewatering leads to a reduction of the residual content X. The influence of pre-dewatering of filter cakes on the washing result has been described by various authors [1, 9, 12, 19].
2.1 Partial Cake Reslurrying
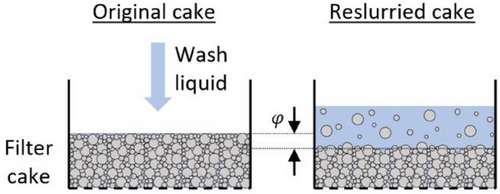
The cake reslurry ratio φ is limited to values in the range of 0 ≤ φ ≤ 1. The impurity concentration c0 in the mother liquid prior to washing is usually known or can be easily measured.
From a previous publication by [11], it follows that the cake reslurry ratio φ increases with the wash ratio W. For evaluating reslurrying experiments, the cake reslurry ratio φ can be plotted against the wash ratio W as depicted in Fig. 3.
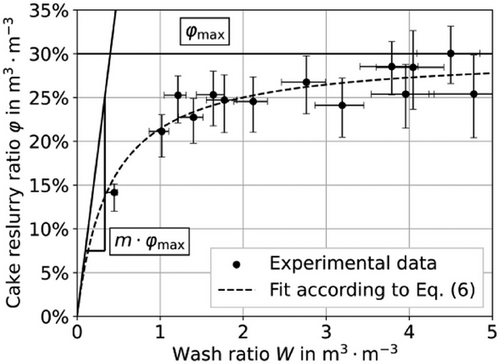
The experimental φ(W)-data show a degressive slope with increasing wash ratio W. The cake reslurry ratio φ remains approximately constant above a certain wash ratio. This behavior is due to a protective effect of the wash liquid supernatant forming on the cake surface during wash liquid application [11]. Above a certain supernatant height, the supernatant almost completely protects the cake surface from the mechanical impact of the wash liquid, effectively preventing further reslurrying.
As shown in Fig. (3), the resulting fitting curve approaches the limit value φ (W) = φmax with increasing wash ratio W, and its slope can be described by dφ/dW = m · φmax at low wash ratios.
3 Materials and Methodology
3.1 Experimental Setup
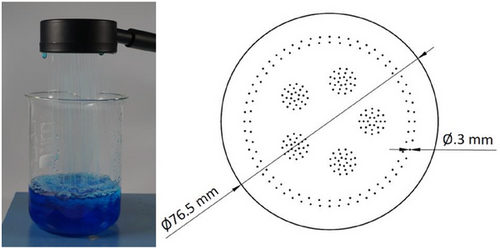
Laboratory vacuum nutsch filters with a diameter of d = 85 mm are used for washing experiments. The experimental setup is identical to that described by [11]. The filter cake surface is exposed during filtration and washing. Wash liquid is applied from a pressure vessel with a wash liquid application system. A hand shower (Fig. 4) with a diameter d = 76.5 mm is used to distribute wash liquid on the cake surface (KAIISSA HD0001). The wash liquid is discharged from a total of 234 outlets with a diameter of d = 0.3 mm.
Ground calcite (Juraperle 130, Eduard Merkle) is used as a particle system with a Sauter mean diameter of x1,2 = 53 µm and a median diameter of x50,3 = 72 µm. The equivalent diameters are obtained from dynamic image analysis of the wet-dispersed solid by measuring the minimum Feret diameter (QICPIC, Sympatec). The solid density determined with a gas pycnometer (AccuPyc, Micromeritics) is ρs = 2.74 g cm−3. A cake height of hc ≈ 1.5 cm is used, the cake porosity is ε ≈ 0.48. Sodium chloride dissolved in deionized (DI) water is used as the model impurity (c0 = 80 g L−1). For each washing experiment, a suspension with a solids volume fraction cV = 0.33 is prepared. The conductivity of mother liquid is measured using a conductometer (Conductometer 912, Metrohm) at room temperature. In case of low salt concentrations, an additional Na+-ion selective measurement is carried out (Na 61, SI Analytics). Deionized water is used as wash liquid (cW = 0 g L−1).
3.2 Experimental Procedure
Before conducting a washing or reslurrying experiment, a filter cake must first be formed. The height of the empty nutsch filter is determined from the upper edge to the bottom using a depth caliper. After applying a filtration pressure difference of Δp = 500 mbar using a vacuum pump (ME 2 NT, Vacuubrand), the suspension is swiftly but gently filled into the nutsch filter and vacuum filtration is started. After complete cake formation, the pressure difference is steered off. The filter cake is completely saturated at this point (S = 1), and suspension liquid has fully penetrated into the cake surface, which therefore has a mattish appearance.
Before applying the wash liquid, the nutsch filter wall is cleaned to prevent contamination of the wash liquid supernatant by adhering impurities. The height from the edge of the nutsch to the cake surface is measured. The cake height hc is determined from the difference with the previous measurement of the empty nutsch filter. The wash liquid is then applied to the cake surface using a liquid distributor. The distance from the wash liquid distributor to the cake surface is 85 mm. The pressure differences set on the dosing tank (pressure vessel) and the resulting area-specific flow rates for wash liquid application are summarized in Tab. 1.
| Pressure difference Δp [mbar] | Wash liquid flow rate [cm · s−1] |
|---|---|
| 250 | 0.47 |
| 500 | 1.59 |
| 1000 | 3.26 |
The wash liquid does not penetrate the cake during its initial application into the nutsch filter. Cake washing begins after the wash liquid application by reapplying the same pressure differential used during filtration. Throughout the washing process, the filter cake remains completely covered with wash liquid.
After cake washing, the filter cake is gently removed from the nutsch filter. To evaluate the cake saturation S, the mass of the wet and dried filter cake is determined. To measure the amount of remaining impurities, the dried filter cake is mixed with a defined amount of deionized water to dissolve remaining salt in the filter cake. This salt amount contained in the filter cake after washing is determined by conductivity measurements. The residual content X of the remaining salt after cake washing, the wash ratio W as well as the porosity ε and saturation S are determined separately for each washing experiment. Each experiment provides a single point of the wash curve.
The experimental procedure for reslurrying experiments—specifically, measuring the supernatant concentration csup and thereby determining the cake reslurry ratio φ—largely follows the same procedure as that of washing experiments. In contrast, the wash liquid is removed directly after its application to the cake surface using a hand suction pump (HUM AEROsuc Rescue). To remove reslurried particles from the wash liquid, the contaminated supernatant is first transferred to a centrifuge tube and centrifuged for 15 min at 4000 rpm. The concentration of the model impurity is determined by a polynomial fitting equation according to Hoffner [13]. By a conductometric analysis of the supernatant concentration csup, the cake reslurry ratio φ is calculated according to Eq. (5). The wash liquid supernatant and the filter cake are discarded after measurement. A combination of washing and reslurrying in one single experiment is not used due to the otherwise insufficient reproducibility of measurement results.
3.3 Reference Wash Curve
To assess the influence of partial cake reslurrying on the washing result, a reference wash curve is required, which is not predominantly influenced by this effect. An alternative experimental procedure is employed to minimize the negative impact of wash liquid application on the washing outcome. The wash liquid is applied to the cake surface as gently as possible, in multiple successive portions of equal volume, using a baffle plate similar to that described by Brückner et al. [19, 20]. Hereafter, the number of wash liquid portions will be referred to as the number of washing intervals i.
The amount of wash liquid is divided into approximately 10 intervals of same size ().
During multiple wash liquid application, the filter cake is partially reslurried several times with each application interval. The wash liquid penetrates completely into the cake after each interval. As a result, the pore concentration in the reslurried cake layer is reduced with each application interval. It is assumed that the wash liquid supernatant concentration after multiple cake reslurrying can be calculated according to a dilution washing approach modified with the cake reslurry ratio φ as a measure for the reslurried cake fraction. The basic equations for dilution washing have already been described by several authors [21-25].
4 Experimental Results
Partial cake reslurrying during wash liquid application leads to an unwanted contamination of wash liquid with solutes. During washing, the contaminated wash liquid penetrates the filter cake and displaces the pore liquid contained there. At the end of washing, the contaminated wash liquid remains within the pores of the filter cake. It can therefore be assumed that the washing result, that is, the maximal cake purity, is limited due to the wash liquid contamination. To assess the impact of partial cake reslurrying, several washing experiments are carried out and wash curves are evaluated.
4.1 Determination of the Cake Reslurry Ratio φ(W)
To describe the extent of partial reslurrying, the cake reslurry ratio φ for the cases to be investigated is determined in preliminary experiments. Experimental φ(W)-data are fitted according to Eq. (6). Tab. 2 shows the corresponding fitting parameters for the later discussed experimental scenarios. Some datasets have already been evaluated in the context of a previous publication, which are marked accordingly [11]. Tab. 2 is used to discuss the washing results shown later.
| Experimental case [figure] | [cm · s−1] | S0 [−] | i [−] | Δp [mbar] | φmax | m |
|---|---|---|---|---|---|---|
| Reslurried cake (Fig. 7) | 3.26 | Saturated | 1 | 0 | 1.0 | 0.32 |
| Pressure difference (Fig. 8) | 3.26 | Saturated | 1 | 0 | 0.910 | 0.355 |
| 3.26 | Saturated | 1 | 500 | 0.463 | 0.879 | |
| Specific dosage flow rate [11] (Fig. 9) | 3.26 | Saturated | 1 | 0 | 1.0 | 0.32 |
| 1.59 | Saturated | 1 | 0 | 0.335 | 1.021 | |
| 0.47 | Saturated | 1 | 0 | 0.056 | 5.919 | |
| Cake saturation (Fig. 10) | 3.26 | Saturated | 1 | 0 | 0.910 | 0.355 |
| 3.26 | 0.85 | 1 | 0 | 0.748 | 0.257 | |
| 3.26 | 0.70 | 1 | 0 | 0.879 | 0.099 | |
| Application intervals (Fig. 12) | 3.26 | Saturated | 1 | 0 | 0.910 | 0.355 |
| 3.26 | Saturated | 2 | 0 | 0.910 | 0.355 |
4.2 Reference Wash Curve
The reference wash curve shown in Fig. 5 is used for comparison with the washing results of partially reslurried filter cakes. The error bars show the result from the largest error calculation, which is carried out separately for each washing experiment.
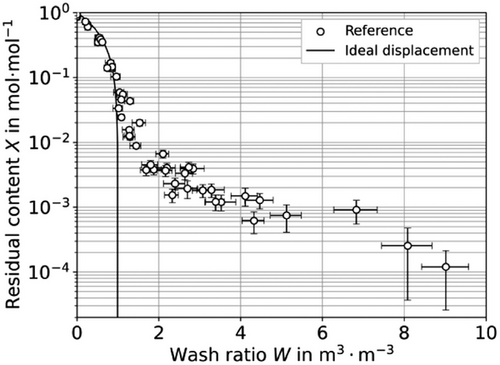
The reference wash curve detaches from the ideal displacement at wash ratio W = 0.8. The dispersion and diffusion regime of the wash curve is clearly pronounced. Residual contents of the order of X = 10−3 to 10−4 are achieved in the investigated range (W ≤ 9).
csup,i/c0 describes the supernatant concentration csup,i after the application of the last wash liquid interval i in relation to the initial pore concentration c0. Here, i describes the number of washing intervals and ΔWi the wash ratio per interval (). The cake reslurry ratio φi is assumed to be constant for each interval applied.
Considering the experimental procedure, csup,i/c0 is in the range of 10−5 > csup,i/c0 > 10−13 for wash ratios 0.8 < W < 9 according to Eq. (7), assuming a constant cake reslurry ratio φi = 5 % and a number of washing intervals i = 10. Since the reference wash curve exceeds these values by several orders of magnitude in the respective regimes, the washing result of the reference wash curve is not dominated by wash liquid contamination due to partial reslurrying of the filter cake surface. The course of the reference curve can be explained by dispersion, diffusion, and other kinetic effects as described in Sect. 2. Therefore, partial reslurrying can be excluded as a limiting factor, and the reference wash curve shown serves as a good reference for comparison with experimental data influenced by partial reslurrying shown later.
4.3 Influence of Partial Reslurrying on Wash Curves
To assess the influence of partial cake reslurrying on cake washing, it must be ensured that impurities from the cake are carried into the wash liquid supernatant due to partial cake reslurrying. For this purpose, a supernatant analysis is conducted. Filter cakes are first prepared and wash liquid is applied subsequently. During wash liquid application, no pressure difference is applied to the filter cake, i.e., no wash liquid penetrates the filter cake during application.
The wash liquid is applied in one single interval (all at once) in each experiment, and further experimental parameters are shown in Tab. 2. The wash liquid flow rate is related to the filter cake area Ac for scalability. The supernatant is then removed for analysis, and its concentration csup is measured. The results of the supernatant concentration measurements related to the initial pore concentration c0 for different wash ratios are shown in Fig. 6.
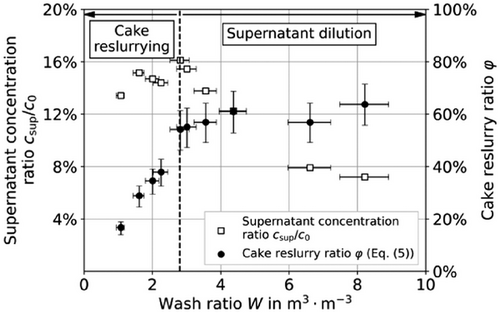
As shown in Fig. 6, the selected experimental procedure leads to a wash liquid contamination caused by partial cake reslurrying. In the range of small wash ratios W < 2.8, the supernatant concentration increases to a maximum value of at W ≈ 2.8 followed by a decrease to a significantly lower level. The in- and decrease can be explained by transport of impurities into the supernatant due to cake reslurrying and the subsequent dilution of the supernatant as two competing effects.
The cake reslurry ratio φ for the identical dataset is calculated according to Eq. (5) and additionally plotted in Fig. 6. At low wash ratios W, the filter cake is initially intensely reslurried, which is shown by the large slope dφ/dW. An approximately constant cake reslurry ratio φ ≈ 60 % is achieved at a wash ratio W ≥ 2.8, meaning that the wash liquid penetrates to an average depth of 9 mm into the cake. During the reslurrying process, impurities from the cake are carried into the supernatant, as a result the supernatant concentration ratio csup/c0 also increases. Once the cake reslurry ratio φ remains constant and further cake reslurrying is negligible, the supernatant concentration decreases due to dilution. The diagram can thus be divided into two regimes where either partial cake reslurrying or supernatant dilution dominates the supernatant concentration.
For washing experiments, filter cakes are prepared, and wash liquid is applied without a filtration pressure difference subsequently. In contrast to reslurrying experiments, the cake is washed after wash liquid application. During washing, the pre-contaminated wash liquid supernatant penetrates completely into the filter cake. Cake washing is started after the complete application of wash liquid at a constant filtration pressure difference Δp ≈ 500 mbar. For the evaluation of washing experiments, the residual content X and wash ratio W are determined. The results are shown in Fig. 7.
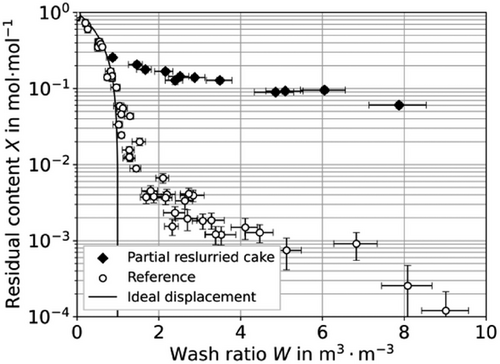
Fig. 7 shows the wash curve of a partially reslurried filter cake, compared to the reference wash curve with negligible influence of partial cake reslurrying. Each point on the wash curve represents an individual washing experiment, demonstrating excellent reproducibility of the experimental procedure for both the reference and partially reslurried filter cakes. The detachment point from ideal displacement is at similar wash ratios for both wash curves. In the further course, the wash curves show substantially different progressions. The wash curve of the partially reslurried filter cake has a lower gradient and approaches a residual content X ≈ 5 · 10−2 in the examined area. The reference wash curve reaches residual contents of up to X ≈ 10−4 in the same range. For wash ratios W ≥ 3, the residual contents X of both wash curves differ more than 2 orders of magnitude.
It is hypothesized that contaminated supernatant liquid remains within the pores of the filter cake after washing. In this case, the normalized supernatant csup/c0 concentration should correspond to the residual content X. To show the influence of a supernatant contamination caused by partial reslurrying on the wash curve for partial reslurried cakes, the normalized supernatant concentrations csup/c0 are plotted in Fig. 8. The comparison between washing results and the supernatant concentration shows that the washing result corresponds to the concentration ratio of the contaminated wash liquid, e.g., X(W) ≈ csup/c0. For the given experimental conditions, the washing result is thus limited by the effects of partial cake reslurrying.
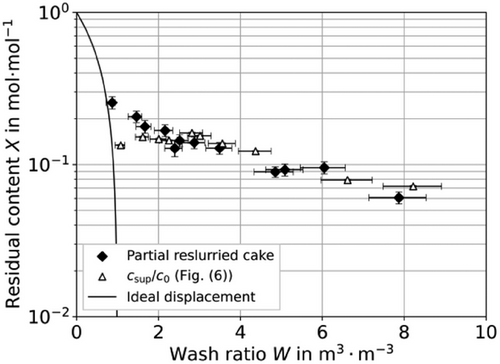
If X(W) > csup(W)/c0, the washing result is limited by other kinetic effects such as dispersion or diffusion. In practical applications, the supernatant concentration ratio csup(W)/c0 should always be kept below the desired residual content X(W) to avoid limiting the washing performance due to supernatant contamination. Based on this procedure, it is possible to identify if a washing result is dominated by the negative effects of partial reslurrying by means of a supernatant analysis without the need for an elaborate washing experiment.
From these results, it can be concluded that partial cake reslurrying can have a highly pronounced negative effect on the course of wash curves and can lead to a limitation of the washing result. The wash curve for partially reslurried filter cakes shows a course typical of displacement washing. However, this can be attributed to the effects of partial cake reslurrying. In this context, there is a risk to attribute the high deviations of an achieved residual content X to mass transfer mechanisms such as dispersion or diffusion.
As can be seen from the results shown, the washing result is determined by the partial reslurrying of the filter cake and the subsequent dilution of the contaminated wash liquid supernatant. The more the supernatant is diluted, the lower the supernatant concentration and thus the less pronounced the negative influence of partial reslurrying on the washing result. Since the washing results can be described using a modified dilution washing approach with the cake reslurry ratio φ(W) as a further parameter for partial cake reslurrying, we propose the term “dilution regime” to describe the progression of a wash curve influenced by this effect. The extent and position of this dilution regime depend on the wash liquid contamination due to partial reslurrying, which can be quantitatively described by the cake reslurry ratio φ(W). In the following sections, the effect of different process parameters on this dilution regime is studied.
4.4 Wash Liquid Application With Applied Pressure Difference
In the previous experiments, wash liquid was applied to the cake surface in each case without an applied filtration pressure difference, i.e., the wash liquid did not penetrate the filter cake during application. In industrial processes, the filter cake is usually permeated simultaneously to the wash liquid application.
Due to an applied pressure difference, the filter cake structure is stabilized during cake washing [26]. It is assumed that an applied filtration pressure difference reduces partial cake reslurrying during wash liquid application. To show the influence of an applied pressure difference on the washing result, two identical filter cakes are formed. The wash liquid is applied to the saturated filter cake (S = 1) directly after cake formation in each case. In one case, wash liquid is fed with applied filtration pressure difference (Δp = 500 mbar) and with the pressure difference steered off in the other case. The filter cake is washed and analyzed subsequently. The wash liquid is applied at a constant specific flow rate of in both cases. The results are shown in Fig. 9.
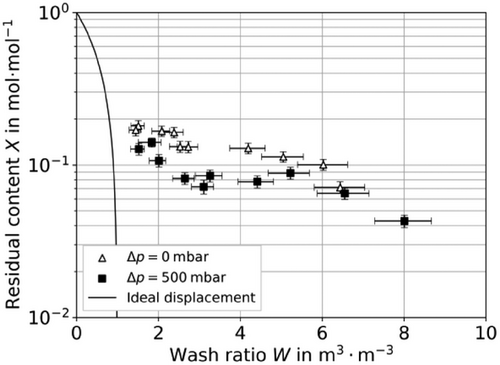
Better washing results are achieved by the application with applied pressure difference compared to with no applied pressure difference. In the range of wash ratios 2 < W < 6, the washing results differ by up to a factor of 2. The results show that the negative effects of partial reslurrying can be reduced by an applied pressure difference during wash liquid application. For practical application, this approach is therefore recommended as it is easy to implement in industrial processes and done anyways in most cases.
However, the experimental procedure with no applied pressure difference is well suited for fundamental experiments on the influence of partial reslurrying on the washing result. Due to the simplified and reproducible experimental procedure, the experiments in the following sections are carried out with no applied pressure difference during wash liquid application. In addition, this procedure can avoid discrepancies in the calculation of the cake reslurry ratio φ, as no wash liquid penetrates the filter cake during wash liquid application and time-related errors in the execution of the experiment can be avoided.
4.5 Variation of Wash Liquid Flow Rate
Henn et al. [11] showed that the cake reslurry ratio φ increases with rising specific dosage flow rates of wash liquid. This effect can be attributed to the increasing kinetic energy of wash liquid at identical geometrical liquid distribution. Washing results are thus expected to deteriorate with increasing kinetic energy and wash liquid dosing velocity. To show the influence of velocity, washing experiments with three different specific dosage flow rates of wash liquid are carried out. The experimental washing results for different specific dosage flow rates are shown in Fig. 10.
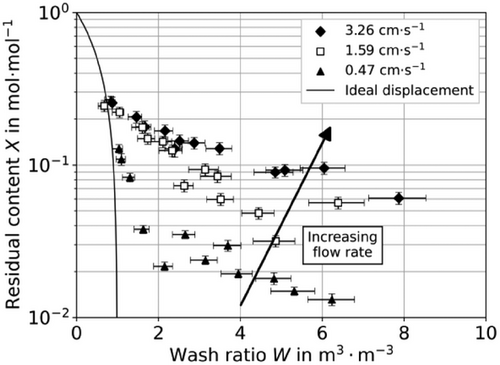
The wash curves shown detach at a wash ratio of 0.7 < W < 0.8 and show clear stratification in the further course, which seems to depend on the specific dosage flow rate of wash liquid during application. The washing result deteriorates with increasing dosage flow rate. At high wash ratios W > 5, the washing results differ by up to one order of magnitude.
Considering the cake reslurry ratio φ from Tab. 2 for different dosage flow rates, the washing results X(W) correlate with the cake reslurry ratio φ(W). The experimental results thus prove that the washing result is impaired with increasing wash liquid dosage flow rate.
4.6 Variation of Cake Saturation Prior to Washing
In industrial processes, filter cakes are often pre-dewatered to prevent mixing of suspension and wash liquid on the cake surface during washing. During dewatering, impurities are removed from the top filter cake already before wash liquid application, which prevents them from being carried into the supernatant by cake reslurrying. In addition, the filter cake is stabilized by pre-dewatering [26], which potentially also leads to the reduction of partial reslurrying due to higher mechanical cake stability. It is therefore assumed that these effects of pre-dewatering reduce partial reslurrying and its negative effect on the washing result.
To assess the influence of pre-dewatering, washing experiments with filter cakes with different initial cake saturations S0 are carried out. For this purpose, filter cakes are pre-dewatered for a defined pre-dewatering time tpd by keeping a pressure difference applied to the filter cake directly after cake formation. Afterward, the pressure difference is steered off. The subsequent procedure is identical to the previous experiments. The wash liquid is applied in each case with a flow rate of . Fig. 11 shows experimental results for filter cakes with initial saturation of S0(Δtpd = 5 s) ≈ 0.85 and S0(Δtpd = 30 s) = 0.70 compared to a saturated filter cake (S = 1).
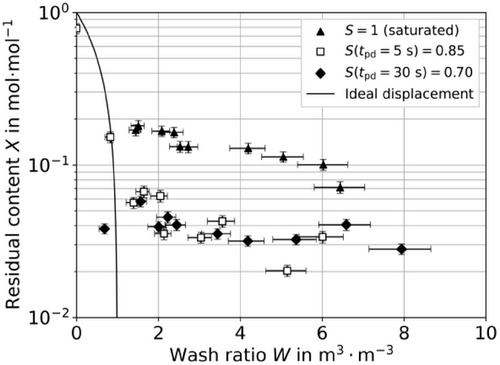
The wash curves for different initial cake saturations S0 show different progressions, compared to the wash curve of a saturated cake. Compared to a saturated cake, the wash curves of pre-dewatered filter cakes detach from ideal displacement at higher wash ratios. The achievable residual content X in the diffusion regime is about one order of magnitude lower for pre-dewatered cakes. The course of wash curves for different initial saturations is identical within the limits of measurement accuracy for the investigated cases. Wash curves influenced by partial reslurrying show an approximately parallel course. The level of the reference wash curve is not reached in the range investigated.
The delayed detachment of the wash curves from the ideal displacement curve can be attributed to the influence of mechanical pre-dewatering. A washing effect is already achieved by pre-dewatering, which also leads to a delayed detachment point [20]. From the comparison of the washing results X(W) with the cake reslurry ratio φ(W) from Tab. 2 for pre-dewatered filter cakes, it is evident that the stratification of the wash curves can be explained by the different extent of partial reslurrying. For the given conditions, even a short pre-dewatering time tpd = 5 s (S = 0.85) is sufficient to improve the washing result X(W) by an order of magnitude by the reduction of cake reslurrying.
Pre-dewatering leads to the reduced contamination of the wash liquid supernatant. This can be shown by plotting the normalized supernatant concentrations csup/c0 as a function of the wash ratio W. Fig. 12 shows the normalized wash liquid supernatant concentrations after application on filter cakes with different initial saturations S0.
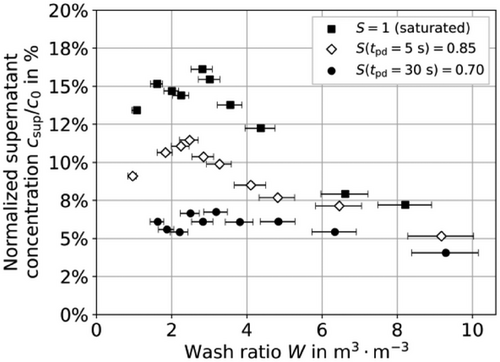
The supernatant concentrations differ significantly depending on the initial filter cake saturation, especially in the industrially relevant area of W < 3. The lower the initial cake saturation S0, the lower the supernatant contamination csup/c0 for a specific wash ratio W. At high wash ratios, the supernatant concentrations differ only slightly.
Schubert [26] demonstrated that the tensile strength of a filter cake increases following dewatering. Starting from a maximum tensile strength at equilibrium saturation of the capillary inlet pressure, the tensile strength decreases with decreasing saturation but is always higher, compared to a saturated filter cake. For an initial cake saturation S = 0.85, higher tensile strengths of the filter cake can therefore be expected than for S = 0.70. This could be a reason for the agreement of the washing results of pre-dewatered cakes. At a saturation S = 0.70, a higher amount of impurities has already been removed from the filter cake; however, it is more unstable and therefore more susceptible to partial reslurrying. In total, both effects could lead to the washing results for different initial saturations matching. However, a separation of these effects is not considered further here.
The experimental results confirm that the effect of partial cake reslurrying can be reduced by the integral effects of pre-dewatering. The development of a scale to differentiate the respective contributions of cake stability and the purification effect of dewatering on the improvement of the washing result is the subject of future work. For industrial applications, pre-dewatering can be a possible measure to prevent a negative influence of partial cake reslurrying.
4.7 Variation of Washing Intervals
When filter cakes are washed in nutsch filters or belt filters, wash liquid is usually applied to the cake surface several times in small portions. Even in continuous washing processes, the wash liquid is applied multiple times with the same quality, e.g., distributed over several nozzle bars. Consequently, the top cake layer is reslurried several times during washing, but the reslurried cake layer is already precleaned from previous wash liquid applications.
To show the influence of this washing procedure, further washing experiments are carried out. A specific wash liquid dosage flow rate of is used. To assess the influence of the wash liquid application in several portions, the wash liquid volume is divided into i = 2 intervals of equal size. In the first step, half of the wash liquid is applied to the filter cake. The second half is applied as soon as the first interval fully penetrated the cake surface.
As a result to this application procedure, the filter cake is partially reslurried twice during washing. After the first washing interval, a lower concentration is already present in the upper cake layer. The wash liquid is thus less contaminated in the second interval. As a further effect, the cake reslurry ratio φ and thus the deterioration of the washing result is lower, the smaller the portion of washing liquid applied, i.e., if φ(W/i) < φ(W). The experimental results are shown in Fig. 13, compared to the reference curve. Due to the characteristics of the experimental setup, only wash ratios W ≥ 3 can be investigated for 2 application intervals.
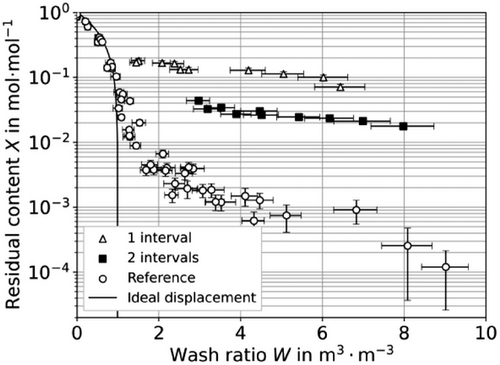
The wash curves for a different number of washing intervals show significantly different courses. The residual contents X for i = 2 intervals achieved are about one order of magnitude below the residual contents for i = 1 interval. The washing result can be improved tremendously by multiple application of wash liquid, provided that partial reslurrying dominates the washing process. By increasing the number of application intervals, the wash curve for reslurried cakes approaches the reference curve.
It must be verified if the washing result of multiple partially reslurried cakes can be predicted by a modified dilution washing approach according to Eq. (7) as well. Assuming that the pore liquid concentration c at the end of cake washing is equal to the concentration of the contaminated supernatant csup, the achievable residual content in the filter cake X can be estimated using Eq. (7). The cake reslurry ratio φ is assumed to be identical for each application interval, i.e., φi = φ (ΔWi) = const.
Tab. 3 shows the results of the estimation of the residual content X(W = 6) for a wash liquid application in i = 1 and i = 2 intervals. The cake reslurry ratio φ(W) is calculated using the data given in Tab. 2. For comparability, the experimentally determined residual contents X are linearly interpolated on the log(X)-W-scale.
From the comparison of the estimated data according to Eq. (7) with experimental data, the estimate is in good agreement. The absolute deviation of the estimate ΔX is within the range of experimental measurement accuracy. The estimation of a washing result using the cake reslurry ratio φ offers a promising approach, provided the washing process is dominated by partial reslurrying. The experimental effort is low, compared to the preparation of a wash curve since the assessment is solely based on a supernatant analysis, i.e., a set of reslurrying experiments. The cake reslurry ratio φ provides a method to determine if washing results are limited by the effects of partial cake reslurrying. The development of models to estimate the washing result based on φ(W)-data will not be further discussed here and is the subject of future work.
4.8 Comparison of Considered Cases
The experimental results show that partial cake reslurrying has a major influence on the outcome of a washing process. The procedure of wash liquid application massively influences the course of the wash curve, which can cause residual impurity contents to differ by several orders of magnitude. For the considered cases, the following experimental conditions led to the worst washing results:
- … at highest specific dosage flow rate studied ()
- … to a saturated cake surface (S = 1)
- … in one single interval
- … without applied filtration pressure difference Δp
- Reduction of the specific dosage flow rate
- Predewatering, i.e., reduction of the initial cake saturation S0
- Adding wash liquid in multiple application intervals i
- Application of a filtration pressure difference Δp during the wash application
For a quantitative comparison, the residual impurity contents for each experimental case are compared with the worst case for an identical wash ratio (W = 3). To describe the washing results, the experimental data from each series are linearly interpolated on the log(X)-W-scale. A wash ratio W = 3 corresponds to the diffusion regime of the reference wash curve.
Eq. (8) is used to rank the washing results on a linear scale between the worst case and the reference wash curve. The residual content Xref(W) based on the reference wash curve represents the best possible washing result under the given conditions, i.e., the reference curve serves as a best-case scenario. X(W) describes the washing result for the respective process parameter variation at a wash ratio W = 3.
A value of ΔX/ΔXref = 0 % means that the washing results could not be improved, compared to the worst case. A value of ΔX/ΔXref = 100 % means that maximum possible improvement has been achieved. The comparison of the various process parameters is shown in Tab. 4.
| Experimental case | X(W = 3) [%] | ΔX/ΔXref [%] |
|---|---|---|
| Reference (best case) | 0.2 | 100 |
| Worst case (see above) | 11.9 | 0 |
| 9.9 | 17.0 | |
| 2.7 | 78.2 | |
| S = 0.85 | 4.5 | 62.9 |
| S = 0.70 | 3.8 | 69.3 |
| 2 application intervals | 4.2 | 65.1 |
| Δp applied during application | 8.4 | 30.0 |
-
Gentle and slow wash liquid application has a positive effect on the washing result.
-
Pre-dewatering of the filter cake can help mitigate the adverse effects of partial cake reslurrying.
-
The negative influence of partial cake reslurrying on the washing result is reduced if wash liquid is applied in multiple intervals.
-
A pressure difference applied to the filter cake during wash liquid application can reduce the negative influence of partial cake reslurrying. However, for the conditions investigated, the influence is only slight, compared to other parameters.
The experiments describe a general procedure for evaluating the influence of partial cake reslurrying on the washing result. Further solids should be investigated to ensure the suitability of this approach.
5 Conclusion
In industrial washing processes, a filter cake is partially reslurried due to the impact of wash liquid during wash liquid application. As a result, impurities contained in the pore liquid mix early with the wash liquid and contaminate it. The achievable washing result is impaired by the wash liquid contamination. The negative influence of partial reslurrying on the washing result has been demonstrated by washing experiments. Partial cake reslurrying can lead to residual impurity contents up to two orders of magnitude worse than the case of the best possible wash liquid application. The cake reslurry ratio φ serves as a good measure for the quantitative description of partial reslurrying. Washing results for partially reslurried filter cakes can be predicted using basic equations for dilution washing modified with the cake reslurry ratio φ as an additional parameter. The progression of wash curves can be explained by partial reslurrying as a new limiting effect for displacement washing. In this context, the term “dilution regime” is introduced.
Experimental results demonstrate that adjusting various process parameters can effectively reduce both the extent and location of the dilution regime. The slow and gentle wash liquid application shows a positive effect on the washing result. Furthermore, pre-dewatering of the filter cake and the application of a filtration pressure difference during wash liquid application as well as the wash liquid application in several intervals reduces the negative effects of partial reslurrying on the washing result. Recommendations are developed by a comparison of experimental results.
Acknowledgments
This work was carried out as part of the AiF project “Systematization, description and evaluation of imperfections in the displacement washing of filter cakes” (IGF 21688 N). The authors would like to thank the GVT e.V., the AiF, and the Federal Ministry of Economic Affairs and Climate Action for their support. The authors declare that no funds, grants, or other support were received during the preparation of this manuscript.
Open access funding enabled and organized by Projekt DEAL.
The authors have declared no conflict of interest.
Symbols used
-
- X
-
- [mol · mol−1]
-
- n
-
- [mol]
-
- c
-
- [mol · m−3]
-
- W
-
- [m3 · m−3]
-
- V
-
- [m3]
-
-
- [m3 · s−1]
-
- S
-
- [m3 · m−3]
-
- m
-
- [–]
-
- d
-
- [m]
-
- x
-
- [m]
-
- x1,2
-
- [m]
-
- x50,3
-
- [m]
-
- p
-
- [mbar]
-
- h
-
- [m]
-
- A
-
- [m2]
-
- t
-
- [s]
Greek letters
-
- ε
-
- [m3 · m−3]
-
- φ
-
- [m3 · m−3]
-
- ρ
-
- [g · cm−3]
Sub- and superscripts
-
- 0
-
- initial condition
-
- W
-
- wash liquid
-
- c
-
- filter cake
-
- sup
-
- supernatant
-
- max
-
- maximum
-
- pd
-
- pre-dewatering
-
- i
-
- interval number
-
- s
-
- solid
-
- l
-
- liquid
-
- V
-
- volume/volumetric
Open Research
Data Availability Statement
The datasets generated during and/or analyzed during the current study are available from the corresponding author upon reasonable request.


