Gas-Liquid Flow Patterns in a Rectangular Milli-Structured Channel with Static Mixing Elements
Abstract
The gas-liquid flow behavior through a milli-scaled channel provided with a staggered herringbone-like static mixer was investigated using high-speed recordings. For three different substance systems consisting of water, 5 wt % acetic acid in aqueous solution, and propylene glycol as liquid phase and nitrogen as gas phase, flow patterns and their transitions were determined by analyzing image sequences of the flow and summarized in flow pattern maps. Surge flow, slug flow, and bubbly flow were observed at different flow rates. The flow distribution and transitions between flow patterns mainly depend on the viscosity and surface tension of the liquid phase. By just reducing the surface tension, slug flow is not observed, and thus an early transition into a bubbly flow regime takes place. An increase in viscosity counteracts this effect.
1 Introduction
The miniaturization of process equipment as an approach to process intensification has been the focus of research for several years. Compared to conventional apparatus concepts, small-scale apparatuses offer higher transport rates and thus provide the potential to reach higher space-time yields 1. Another option for process intensification is the modification of the apparatus geometry. For example, flat rectangular channels have a higher surface-to-volume ratio compared to circular ones, which leads to shorter diffusion paths and thus increases the heat and mass transport performance 2. Further geometry adjustments such as shaping or structuring of the channels, e.g. by using static mixers, lead to faster mixing or higher interfacial areas in the case of two-phase fluid systems. Due to these characteristics, micro- and milli-structured reactors are especially recommended for fast and highly exothermic as well as for mass transport-limited reaction systems 1.
In case of multiphase processes, the definition of suitable operating windows requires a fundamental knowledge of the apparatus characteristics in terms of hydrodynamics and transport parameters. Various research studies have shown that in continuous co-current flows the performance of transport phenomena such as heat and mass transfer is strongly related to the flow patterns 3-5. The development of flow pattern maps is a common approach to classify flow patterns. For this, it is necessary to investigate which flow patterns occur and under which conditions their transitions take place. The most common method is the analysis of photographic recordings of the flow through a transparent test section. Several flow pattern investigations of micro- and milli-channels with circular cross-sections 6-10 and rectangular cross-sections 11-15 have been described in the literature. However, it is generally known that flow patterns strongly depend on the channel dimensions and geometries, and thus, for unique designs, e.g. containing mixing inserts, new experimental data is always necessary.
This study shows an experimental investigation of the gas-liquid flow patterns in a Miprowa® reactor, which consists of milli-scaled rectangular channels equipped with staggered herringbone-like static mixing elements. Flow transitions were analyzed visually and flow pattern maps are presented for three different substance systems, considering the influence of surface tension and viscosity.
2 Experimental Setup and Procedure
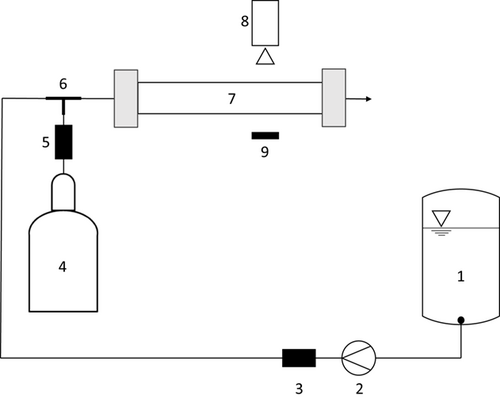
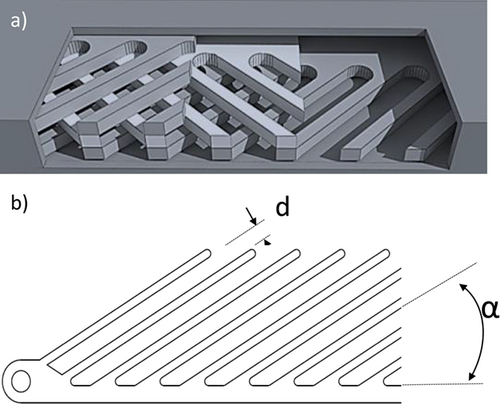
A scheme of the experimental setup is given in Fig. 1. The liquid phase is pumped through the test rig using a gear pump (Heidolph, PD 5230) and a Coriolis mass flowmeter (Endress + Hauser, Promass 80A). The gas phase is dosed by a mass flow controller (Bronkhorst, FG-201CV). Both phases get in contact through a T-junction and enter the horizontally oriented test section after passing a capillary with a length of 20 mm. Due to the apparatus walls, which are generally made from metallic materials, Miprowa® reactors do not offer the possibility to optically examine flow behaviors inside the channels. In order to ensure an insight view of the flow, a test channel made of polymethyl methacrylate (PMMA) was used for the following experiments. The PMMA test channel is formed by a rectangular cross-section of 3.2 × 18 mm2, and thus the channel cross-section is identical to that of Miprowa® reactors on the pilot and production scale. The length of the test section is 200 mm. Further, the channel is equipped with a Miprowa® static mixer, which is created by three layers of staggered herringbone-like mixing inserts. As shown in Fig. 2a, these layers are arranged in alternating orientations and thus form a grid-like structure, which fills the entire width and heights of the channel. The geometry of one layer is presented in Fig. 2b. In this study, mixing inserts with a tooth distance of d = 2 mm and a tooth angle of α = 45° were used.
 ()
()where  is the volumetric flow rate of the considered phase and A is the channel cross-section including the static mixer. Water, 5 wt% acetic acid in aqueous solution (AAAS), and propylene glycol (PG) were used as liquid phases, and nitrogen (Air Liquide, purity > 99.999 %) was used as the gas phase. The liquid properties are given in Tab. 1.
In order to determine the flow patterns and their transitions optically, image sequences for 100 combinations of gas and liquid flow rates per substance system were analyzed with the human eye. Each image sequence consisted of 500 frames with a high time resolution of 100 fps (frames per second). This also allows the evaluation of the flow behavior behind the structures, since it is possible to observe how bubbles disappear and reappear. Therefore, a high-speed CCD camera (Dalsa, Genie Nano M800) with a telecentric lens (Sill Optics, S5LPJ2224) was used. The channel was illuminated in a transmitted light configuration using an LED light source. Each image covers the entire channel width of 18 and 28.4 mm of the main flow direction and has a resolution of 800 × 600 pixels.
3 Results and Discussion
3.1 Flow patterns
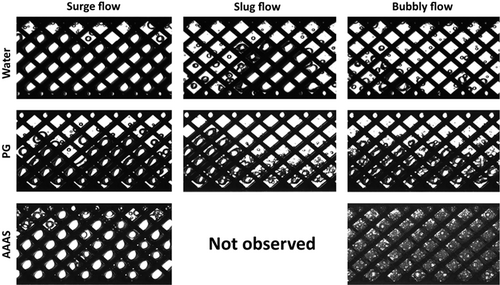
Examples of gas-liquid flow patterns in Miprowa® channels as obtained from the image sequences are depicted in Fig. 3. The arrangement of the images shows a classification in terms of flow patterns (vertically oriented) with associated liquid phases (horizontally oriented). Due to the non-uniformly aligned three-layer mixer design, with two layers oriented in the same direction and one layer in the other direction, it is noticeable that in water and PG systems the gas phase flows mainly on the side of the channel to which the teeth of the outer two mixing elements are oriented. In contrast to this, the gas bubbles in AAAS are distributed across the complete channel width. In general, three different flow patterns, defined as surge flow, slug flow, and bubbly flow, were observed in the Miprowa® channels.
3.1.1 Surge Flow
Surge flow is characterized by a high gas content (> 50 vol %), which is trapped by the mixer structures and flows through the channel in an impulsive manner. In the case of water and AAAS, the gas phase is distributed across the entire channel. With PG as the liquid phase, it is noticeable that, due to a comparatively higher viscosity, the gas phase appears compressed. In addition, the increasing flow resistance due to the high viscosity hinders coalescence 15.
3.1.2 Slug Flow
In this work, slug flow is defined by larger gas bubbles or bubble clusters, so-called “mother bubbles” separated by liquid slugs. As described by Gopal and Jepson 20, due to mixing vortexes, small bubbles are trapped within the liquid slugs. For water as the liquid phase, it can be observed that the gas phase coalesces between the liquid slugs to a large bubble. For the PG system, this kind of so-called mother bubble is also recognizable, but due to the combination of low surface tension and high viscosity it presents as a stable bubble cluster. Furthermore, small gas bubbles remaining in the liquid slugs appear much more finely dispersed. In the system AAAS-nitrogen, slug flow is not observed. In general, it is observed that increasing the liquid flow rate leads to smaller main bubbles or bubble clusters and more distorted gas bubbles within the liquid slugs.
3.1.3 Bubbly Flow
Bubbly flow is characterized by gas bubbles that are finely dispersed. Depending on the liquid properties, the bubbles are differently distributed and formed. Bubbly flow in water and PG systems shows gas bubbles of different sizes and larger bubbles are deformed by the shear of the liquid flow. The bubble deformations occur increasingly in the viscous system. In case of lower viscosity and lower surface tension as given with AAAS, the bubbles have a small volume with a nearly spherical shape. At constant gas content, this leads to a significant increase in the amount of bubbles, which can be clearly seen in the flow pattern.
Compared to the literature, the observed flow patterns contrast with those of Sengen et al. 21, who also observed flow patterns in Miprowa® channels with the same geometry and similar flow rates using deionized water and nitrogen. They defined bubbly, plug, and annular flow as the leading flow patterns. They observed that bubbly flow occurred in a wider range and particularly at low liquid flow rates. Considering bubbly flow while using water in the present work, it occurs only at very high liquid flow rates and low gas flow rates. Plug flow was similarly defined to the slug flow of this work but appeared in a smaller range. Furthermore, they observed annular flow at moderate superficial gas and high superficial liquid velocities. This was not observed in the present investigation. Since their examinations were carried out without a camera system, it is assumed that the present results describe the actual reactor behavior more precisely. Roes et al. 22 investigated the gas-liquid flow through a vertically orientated Sulzer static mixer (SMVTM 16). In experiments with water and nitrogen, they investigated the transition of slug flow and bubbly flow. Although their experiments considered a larger scale, observing these flow patterns shows a good agreement with the present study. Surge flow has similarities to stratified flow of rectangular mini-channels 13, but without the influence of the flow resistance due to the mixing inserts. According to this, it is assumed that surge flow is directly related to the staggered herringbone-like Miprowa® static mixer.
3.2 Flow Pattern Maps
A classification of all obtained images into surge flow, slug flow, and bubbly flow requires a strict definition of the flow transitions, since flow transitions are more likely to be observed as transition regions rather than sharp transitions. To decrease uncertainties in transition areas, the following criteria were used to differentiate flow patterns. The transition from surge flow to slug flow begins when no further trapping of the gas due to the static mixers is observed and slugs can be determined. Slug flow ends and bubbly flow begins if bubbles shrink until there is no possible further distinction between mother bubbles or bubble clusters and smaller bubbles.
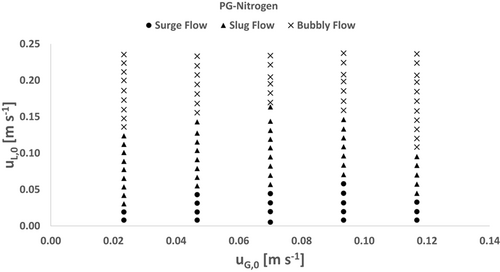
Flow pattern maps are depicted as a function of the superficial gas velocities (x-axis) and the superficial liquid velocities (y-axis), as can be seen in Figs. 4–6 for the investigated substance systems.
3.2.1 Water-Nitrogen
In Fig. 4, the flow pattern map of the water-nitrogen test system is shown. Surge flow is observed for low superficial liquid velocities in the range of 0.012–0.105 m s−1, depending on the superficial gas velocities. In general, the expectancy range of surge flow increases with increasing gas contents. It is noticeable that the transition from surge flow to slug flow occurs at a gas content of approximately 50 %. Overall, slug flow is the dominant flow pattern in water systems, which occurs in the entire middle and upper range of the investigated superficial velocities. Bubbly flow is only observed at very low gas flow rates and high liquid flow rates.
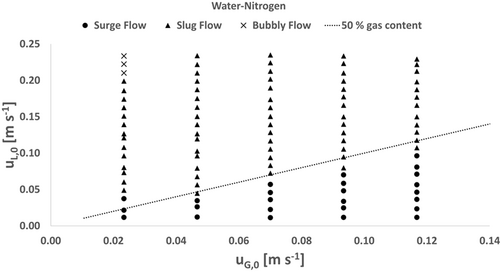
To the authors' knowledge, no comprehensive flow pattern maps of channels provided with static mixers are available. However, a comparison with an empty rectangular channel on a similar scale also shows that flow patterns such as plug flow and slug flow are dominant and bubbly flow only occurs at high liquid flow rates 13. This in turn shows that, in spite of the presence of the static mixer, due to the high surface tension of water, the examined flow rates are not sufficient for a bubble breakup.
3.2.2 AAAS-Nitrogen
The classification results of the AAAS-nitrogen test system are summarized in the flow pattern map shown in Fig. 5. Surge flow is observed at all investigated gas flow rates and superficial liquid velocities up to 0.023 m s−1, and no dependence on the gas content is found. With higher liquid flow rates, the flow distribution turns directly into a dispersed bubbly flow and thus slug flow is not observed. As the total flow rate increases, the size of the bubbles decreases and thus the number of bubbles increases.
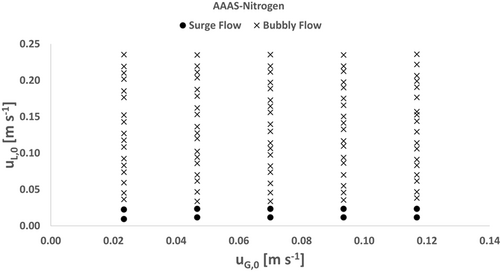
Due to the lower surface tension of the aqueous acetic acid, the bubble surfaces are less stable and thus the bubble structures are more effectively broken up by the mixing structures and the inertial forces affected by the flowing liquid 15. Previous studies for empty rectangular micro-channels confirm that flow pattern transitions are shifting towards small superficial liquid velocities with lower surface tensions 10, 14. However, they detected slug flows in liquids with a significantly lower surface tension than AAAS, which was not observed in this study, and thus the assumption that static mixers have an additional impact on dispersions is confirmed.
3.2.3 PG-Nitrogen
The flow pattern map for PG-nitrogen is illustrated in Fig. 6. Surge flow is observed in the entire range of investigated superficial gas velocities at low superficial liquid velocities. It can be noted that the flow behavior at lower gas contents is similar to that of water, but above a superficial gas velocity of 0.093 m s−1, the transition to slug flow begins at lower superficial liquid velocities. Slug flow occupies a wide range up to a superficial liquid velocity of 0.16 m s−1. It can be seen that, at superficial gas velocities above 0.07 m s−1, the transition from slug to bubbly flow shifts to lower liquid flow rates with increasing gas superficial velocity. Overall, bubbly flow occurs along the entire investigated range of gas flow rates. Although the surface tension of PG is significantly lower than the surface tension of AAAS, the flow pattern map shows clear differences in flow transitions and more similarities to the water system at lower liquid flow rates. This indicates that viscosity partly counteracts the effects of lower surface tensions. The turn of the slug-to-bubbly transition at a superficial gas velocity of 0.7 m s−1 shows that areas of lower total flow rates are dominated by effects of viscosity and areas of higher total flow rates are dominated by effects of surface tension.
4 Conclusion and Outlook
Flow patterns and their transitions were determined for a milli-scaled rectangular channel with a staggered herringbone-like static mixer. Three different flow patterns – surge flow, slug flow, and bubbly flow – were observed. Depending on the fluid properties, the transitions between these flow patterns occur at different flow rates. It was shown that slug flow is the dominant flow pattern in water-nitrogen systems and bubbly flow only occurs at high liquid flow rates and low gas contents, while surge flow occurs at gas contents over 50 %. By reducing the surface tension, slug flow is not obtained any more, and thus an increase of the flow rate leads to a direct transition from surge flow to a bubbly flow that appears finely dispersed. Increasing the viscosity while maintaining low surface tensions leads to the occurrence of slug flow and flow transitions shift from lower to higher flow rates, and thus effects of viscosity counteract those of surface tension.
Acknowledgements
Open access funding enabled and organized by Projekt DEAL.
The authors have declared no conflict of interest.
Symbols used
-
- A [m2]
-
channel cross-section
-
- d [mm]
-
tooth distance
-
- uG,0 [m s−1]
-
superficial gas velocity
-
- uL,0 [m s−1]
-
superficial liquid velocity
-
 [m3s−1]
 -
volumetric gas flow rate
-
 [m3s−1]
 -
volumetric liquid flow rate
Greek symbols
-
- α [°]
-
tooth angle
-
- η [Pa s]
-
viscosity
-
- ρ [kg m−3]
-
density
-
- σ [N m−1]
-
surface tension
Abbreviations
-
- AAAS
-
acetic acid in aqueous solution
-
- PG
-
propylene glycol
-
- PMMA
-
polymethyl methacrylate


