Transient Effects during Dynamic Operation of a Wall-Cooled Fixed-Bed Reactor for CO2 Methanation
Abstract
The power-to-gas process is an option to transform fluctuating renewable electric energy into methane via water electrolysis and subsequent conversion of H2 by methanation with CO2. The dynamic behavior of the methanation reactor may then be a critical aspect. The kinetics of CO2 methanation on a Ni-catalyst were determined under isothermal and stationary conditions. Transient isothermal kinetic experiments showed a fast response of the rate on step changes of the concentrations of H2, CO2; in case of H2O, the response was delayed. Non-isothermal experiments were conducted in a wall-cooled fixed-bed reactor. Temperature profiles were measured and the effect of a changing volumetric flow was studied. The experimental data were compared with simulations by a transient reactor model.
1 Introduction
The growing energy demand of the developed and emerging economies is still mainly satisfied by oil, gas, and coal. However, the consequences of the climate change as a result of fossil fuel consumption, i.e., high CO2 emissions, are becoming more and more obvious. Thus, renewable energy sources such as wind and solar enabling the substitution of fossil fuels are gaining importance, but their drawback is still the gap in demand and supply. In times of low winds and low or no sun radiation, electricity production lacks the demand, whereas on the other hand windy and sunny periods may yield a surplus of available electrical energy. Consequently, energy storage systems are needed to level the fluctuating production and use of energy 1-3.
 (1)
(1)SNG production has two advantages: CO2 can be utilized and a technically mature storage and transport infrastructure for natural gas is already present in many countries 6. SNG can substitute natural gas in existing applications, e.g., heat and power production or generation of syngas 7. Hence, PtG provides an attractive link between the electrical and natural gas grid.
Beside CO2 from flue gases of power plants or of the steel and cement industry 6, biogas is also an interesting CO2 source. It contains about 60 % CH4 and 40 % CO2 and could be directly upgraded into SNG by addition of the respective amount of hydrogen (according to Eq. 1 4 mol H2 per mol CO2) and subsequent methanation 6, 8, 9.
The fluctuating production of renewable H2 may lead to the need of temporary H2 (and CO2) storage facilities in a PtG plant. In addition, the PtG chain may also require novel concepts for reactor operation which are optimized for smaller plant sizes and for intermittent or dynamic operation of the methanation unit. If the reactor is, e.g., suitable for a variation of the volume rate of the feed gas, this would help to reduce the size of gas storage tanks 10.
Several phenomena are reported for reactors in dynamic operation, which make stable and safe operation as in case of the exothermic methanation difficult: Experimental data and numerical modeling show wrong-way behavior, travelling hotspots and variations in the conversion of the syngas in cooled fixed-bed reactors 11. Further simulations indicate also advantages of dynamic reactor operation such as a decreasing hotspot temperature 12 and higher conversion 13. In literature optimizations for start-up, load changes, or mass and heat recycle are described 14-17, but steady-state kinetics are frequently assumed 12-17, although transient kinetic effects on the catalyst surface are also reported 18-21. Hence, a reliable transient model that describes the main effects in dynamic operation of a reactor needs an experimental validation with regard to transient effects on the catalyst surface.
In this work, the kinetics of methanation were at first determined at isothermal steady-state conditions. With regard to transient operation it is necessary to know if steady-state kinetics can be assumed as transient kinetics, i.e., if the response of the reaction rate on changes of gas composition or temperature is fast. Therefore, step changes of the inlet gas concentrations of H2, CO2, and H2O were performed to investigate the transient behavior of the catalyst. Moreover, dynamic and non-isothermal experiments with regard to a step change of the volume rate of the syngas were conducted in a wall-cooled single-tube fixed-bed reactor. The experimental data were then compared with a suitable transient reactor model.
2 Experimental Setup and Procedure
2.1 Stationary and Transient Isothermal Kinetic Measurements
The setup for the isothermal kinetic measurements (Fig. S1 in Supporting Information) consists of a gas dosing unit, a small fixed-bed reactor, and a gas analysis. The feed rates of the gases H2, CO2, N2, and CH4 were adjusted by mass flow controllers. Steam was added by a water saturator and the respective pipes were heated to prevent condensation. All experiments were conducted with a volumetric flow rate of 50 L h−1 (STP) and at 1 bar.
The lab-scale reactor was externally heated and cooled by a thermo-oil thermostat to provide isothermal conditions. The reactor had a diameter of only 1.4 cm and was charged with 1.5 g (1.8 g for transient experiments) of catalyst particles (NiSat 310 RS from Clariant) diluted with 7.5 g of inert quartz sand to ensure isothermal conditions. The bed length was about 5 cm. Data of the catalyst are given in Tab. 1.
|
Parameter |
Value |
|---|---|
|
Particle diameter dp [mm] |
2.1 |
|
Particle density ρp [kg m−3] |
3690 |
|
BET surface area [m2g−1] |
184 |
|
Average pore diameter [nm] |
6.6 |
|
Ni content on Al2SiO5/Al2O3 [wt %] |
56.7 |
|
Heat capacity at 190 °C cp [J kg−1K−1] |
842 |
For temperature measurements to prove isothermal conditions, a guiding tube for a thermocouple with a diameter of 2 mm was placed in the center of the tubular reactor.
For the steady-state and isothermal kinetic experiments, the product gas passed through cooling traps at 0 °C and at –78 °C, respectively, and was then analyzed by a gas analyzer (Fisher-Rosemount MLT 2) for CO, CO2, CH4, and H2. The experiments were conducted in a temperature range from 170 °C to 230 °C with syngas consisting of 4–20 % CO2, 5–80 % H2, 0–45 % H2O, and 0–25 % CH4. Nitrogen was only added to adjust the concentrations, e.g., to vary the concentration of only one reactant.
For the transient kinetic experiments the product gas was analyzed by a mass spectrometer (Pfeiffer MS Thermostar). By this, the response time of the gas analysis to a change of the adjustment of the mass flow controllers was lower than 10 s. In addition, a small amount of helium (1 L (STP) h−1; typically 2 % of the total gas flow) was continuously added as an inert internal standard allowing the detection of volume flow fluctuations, e.g., an increasing signal of helium indicates a lower volume flow. Furthermore, the helium signal was used for the dead-time correction. The step change experiments between two concentrations were performed at 220 °C and the response signal was observed.
2.2 Transient Volume Flow Step Change Experiments with a Cooled Single-Tube Methanation Reactor
For the cooled single-tube methanation reactor (Fig. S2), a mass flow controller for a premixed syngas (63 % H2, 15.3 % CO2, and 21.7 % N2) was applied. The reactor was a jacketed stainless-steel tube (inner diameter 2 cm, length 1 m). It was heated and cooled by an oil thermostat (LAUDA USH 400) and contains a 10-cm filling of glass spheres for consistent conditions at the inlet and subsequent 88-cm filling of catalyst. A guiding tube in the center of the reactor (3 mm diameter) over the total length was used to measure the axial temperature profile by means of a movable thermocouple.
Two cooling traps were placed downstream of the reactor to condense the product water, one at room temperature and the other one at 0 °C. The dry gas composition was analyzed by an infrared gas analyzer for CO, CO2, as well as CH4 and a thermal conductivity detector for H2.
For axial temperature profile measurements, a sled driven by a stepper motor moved the thermocouple downwards the reactor. A computer controlled the mass flow controller in the same way as the stepper motor moved the thermocouple and recorded the measured temperature and gas concentration data from the gas analyzer. The experiment started with a volume flow of 60 L h−1 for 45 min at a cooling temperature of 183 °C. Then, a step change of the flow to 7.5 L h−1 was conducted for 45 min. This procedure was also done with a reverse step change (7.5 L h−1 → 60 L h−1).
To record the transient temperature profile with only one thermocouple (Fig. S3), both experiments were repeated 29 times at different positions of the thermocouple inside the reactor. Hence, the total experimental time of both step change experiments was 45 h. Within the first 10 cm of the reactor – the hotspot region – the temperature was measured in intervals of 1 cm. For the next 10 cm of the reactor length, the thermocouple was moved in intervals of 2 cm and from this part of the reactor onwards to the end of the catalyst bed in the reactor in intervals of 5 cm.
3 Modeling a Wall-Cooled Fixed-Bed Methanation Reactor
 (2)
(2) (3)
(3) (4)
(4)The gas density ρg under reaction conditions was calculated using the reactor cooling temperature as reference. Both the thermal conductivity λg and viscosity ηg of the gas were calculated according to the Wassiljewa relation and the Mason Saxena modification 22. The heat capacity cp of the gas was determined using a correlation given in 23. The stagnant thermal conductivity of the fixed bed λbed, calculated on the basis of the model of Zehner-Bauer-Schlünder, was 0.27 W m−1K−1 23. Correlations for Nu, λrad, and αw were also taken from 23.
In order to determine the radial heat conduction λrad and the heat transfer from the fixed-bed to the cooled reactor wall αw, an overall heat transfer coefficient Ubed was defined 24. The (radial) maximum temperature in the center of the reactor (measured in the experiments) was calculated based on the modeled mean temperature, and the values of λrad and αw 24. For the reaction rate rm, the kinetic parameters determined at steady-state conditions (see Sect. 4.1) were used. Hence, the reactor model only accounts for transient thermal effects, while, e.g., transient kinetic effects like ad- and desorption kinetics are not considered. Mass transport limitations by pore diffusion were negligible, as proven by an estimation of the Thiele modulus. Values of the model parameters under the conditions of the experiments with the wall-cooled methanation reactor are depicted in Tab. 2.
|
Parameter |
Value |
|
|---|---|---|
|
Reactor diameter dr [cm]/length Lr [cm] |
2/88 |
|
|
Bulk porosity (ε) |
0.82 |
|
|
Stagnant thermal conductivity (λbed) [W m−1K−1] |
0.27 |
|
|
Total pressure (p) [bar] |
1 |
|
|
Cooling temperature (Tcool ) [°C] |
183 |
|
|
Volume rate of syngas (STP) [L h−1] |
7.5 |
60 |
|
Nu (internal wall, depends on λg and thus on conversion) [–] |
3.6–11.9 |
3.9–7.6 |
|
Radial thermal conductivity (λrad) [W m−1K−1] |
0.27 |
0.29 |
|
Heat transfer coefficient (αW) [W m−2K−1] |
238 |
260 |
|
Overall heat transfer coefficient (Ubed) [W m−2K−1] |
74 |
80 |
4 Results and Discussion
4.1 Steady-State Kinetics of Methanation
 (5)
(5) (6)
(6) (7)
(7) (8)
(8)Due to low conversion of CO2 (< 15 %), differential conditions are assumed. A high conversion of CO2 and thus a high concentration of steam were simulated by addition of H2O to the feed gas. All experimentally determined parameters are listed in Tab. 3.
|
k0,m |
9.2 × 10⁻² mol(kg s Pa)−1 |
|
EA |
46.8 kJ mol−1 |
|
K0,1 |
4.5 × 10⁻⁶ Pa−0.5 |
|
Δads,1H |
–29.4 kJ mol−1 |
|
K0,2 |
1.7 × 10⁻⁵ Pa−0.5 |
|
Δads,2H |
–23.4 kJ mol−1 |
|
K0,3 |
1.5 × 10⁻⁶ Pa−0.5 |
|
Δads,3H |
–34.7 kJ mol−1 |
LHHW approaches contain different mechanistic assumptions, but there is still no agreement about the reaction steps actually occurring 29. The reaction orders of H2 and CO2 (both 0.5) were determined by experiments with varied concentration of both components (for CO2 see also Fig. 1). The order for CO2 indicates a dissociative adsorption of CO2 into CO and atomic O on the surface followed by CO methanation 18, 30; the reaction order of H2 can be explained by dissociative adsorption. Thus, CO2 and H2 each occupy two active sites. For SNG production, a high conversion of CO2 is demanded. This yields significant amounts of CH4 and H2O, and product inhibition may occur. Thus, the influence of both product compounds on the methanation kinetics was also investigated. The experimental data gave no evidence for an influence of methane, but steam (water) is an inhibiting agent (Fig. 1).

Fig. 1 shows a decreasing reaction rate for constant H2 and CO2 partial pressures caused by an increasing partial pressure of water; this was also observed by Marwood et al. 19, who reported a decreasing CO coverage on the catalyst when water was added, and thus a reduction of adsorbed C-species. In the literature 25, 31, 32, the reaction order of water in the respective adsorption term is assumed to be unity.
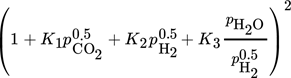
Inhibition effects are represented by the adsorption terms for CO2, H2, and H2O in the denominator of the LHHW approach. The strength of each inhibition is indicated in Tab. 4 by the comparison of the respective adsorption terms at a typical reaction temperature of 220 °C and different degrees of CO2 conversion. Inhibition by H2 and CO2 declines with increasing conversion; for steam this is reverse.
|
Adsorption term / reaction rate |
XCO2 = 25 % |
XCO2 = 50 % |
XCO2 = 75 % |
|---|---|---|---|
|
|
0.75 |
0.65 |
0.49 |
|
|
1.32 |
1.14 |
0.87 |
|
|
0.31 |
0.79 |
1.80 |
|
|
11.4 |
12.9 |
17.3 |
|
rm,CO2 [mol kgcat−1s−1] |
3.0 × 10⁻³ |
2.0 × 10⁻³ |
0.84 × 10⁻³ |


The inhibiting effect of steam on the rate and conversion of CO2, respectively, is also demonstrated in Fig. 2; just for comparison, the hypothetical case without H2O inhibition is also depicted. Up to 20 % CO2 conversion, the formed steam has almost no influence on the rate, but at higher conversion, inhibition becomes more and more relevant. Note that for the conditions given in Fig. 2 (220 °C, 1 bar, 20 % CO2, 80 % H2), the thermodynamic equilibrium conversion of CO2 is 98.4 %. Almost full conversion can only be reached for lower temperatures (e.g., XCO2,eq = 99.3 % at 180 °C), and higher temperatures are unfavorable with regard to CO2 methanation (e.g., XCO2,eq = 94.9 % for 300 °C).

Finally, a parity plot of the experimental results is presented in Fig. 3. The agreement of measured and calculated values is mainly in a range of ± 10 %.

4.2 Transient Response on the Kinetics on Partial Pressure Step Changes
In Sect. 4.1 the intrinsic steady-state kinetics were discussed. However, for dynamic operation it is necessary to know how fast the catalyst responds to changes of the reaction conditions such as the inlet gas composition, and whether and how fast steady-state conditions are again reached. Therefore, step change experiments were conducted. For example, if the time delay is very short, the kinetics determined at steady-state kinetics can be assumed to be valid also for a transient operation of a reactor, which simplifies the respective modeling.
The transient kinetic experiments were conducted under isothermal conditions. A mass spectrometer was used to analyze the feed and product gas. With helium as internal standard, changes of the volume flow during the initial phase of the step change and the dead time, respectively, could be identified and separated from real catalyst effects. The focus of the transient experiments was to investigate the influence of a stoichiometric change of the partial pressures of H2 and CO2 (Figs. 4 and 5) as well as of H2O (Fig. 6).
Figure 4 reveals that the catalyst responds fast to a partial pressure step change of the feed gases CO2 and H2 from initially low to high values. The H2-to-CO2 ratio was thereby kept constant at a value of 4. While the contents of CO2, H2, and CH4 are already constant after about 25 s, the water content exhibits a certain delay before a stable value is achieved. Obviously, water, which is formed to a higher extent after the step change compared to before, adsorbs on the surface until the corresponding new adsorption equilibrium is reached. This corresponds to an initially slightly higher conversion (lower content) of CO2 compared to the finally reached stationary value as water adsorption inhibits the reaction rate.

This behavior is similar but now in the reverse direction, if the step change is done from high to low partial pressures of CO2 and H2 (Fig. 5). Again, the new adsorption equilibrium for water is established with a certain delay as compared to H2 and CO2, which now leads to an initially slightly lower conversion of CO2 (more pronounced visible by lower methane content). Now, the amount of water formed after the step change is lower compared to before the change, and the inhibition by a water adsorbed on the surface, until the new adsorption equilibrium is established by desorption after about 1 min, leads to a decrease of the reaction rate.

So, ad- and desorption of steam is obviously the main effect prolonging the time required to reach steady-state conditions. In order to study this more explicit, only the steam content was now changed stepwise from 20 % to a feed gas free of steam (Fig. 6). As expected, the content, i.e., the production rate, of methane is lower before the step change due to the higher (surface) concentration of water and the corresponding inhibiting effect by steam adsorption. After the step change from a rather high steam content of 20 % to a feed gas free of steam, methane production increases until after about 7 min the expected values (and accurately calculated by the kinetic model) for steady state are reached. The influence of the “delayed” steam ad- and desorption is also important to a certain extent for the transient operation of a wall-cooled fixed-bed reactor, as inspected is in the next Sect. 4.3.

4.3 Effects of Changing Volume Flow in a Wall-Cooled Fixed-Bed Reactor
Subsequent to the studies on the isothermal steady-state kinetics and on transient effects on the kinetics, experiments were conducted in a non-isothermal wall-cooled fixed-bed reactor. The transient behavior of the reactor was studied by a step change of the total volume rate. The reactor was also modeled as described in Sect. 3. For calculation of the conversion and heat production, the steady-state kinetics (see Sect. 4.1) were used. The experiment focused on biogas upgrading.
Biogas typically contains 60 % CH4 and 40 % CO2. Hence, at least 4 mol H2 has to be admixed per mol CO2 to achieve 100 % conversion of CO2 to CH4. Here, a slightly higher ratio of 4.2 was applied for adjusting a small H2 excess to ensure full conversion. Methane was not added to the feed gas; instead, the respective amount of N2 was added. Before presenting the dynamic measurements, the steady-state temperature profiles are illustrated in Fig. 7. The model describes the measured temperature profile and the location of the hotspot temperature satisfactorily. For the shorter residence time (higher volume rate), the model predicts a slightly higher CO2 conversion, i.e., 69 % compared to 60 % measured, which may be explained by inaccuracies at high H2O-to-H2 ratios.

The transient experiments with the wall-cooled fixed-bed reactor were of interest as the hotspot behavior during a load change is important for safe operation. In order to achieve the strongest effect, a step change was chosen, while in industrial practice the load change would be realized by a ramp. Note that the equilibrium conversion of CO2 to methane is 100 % for the given low reaction temperature of around 190 °C. The transient temperature profiles were measured as described in Sect. 2.2.
In Fig. 8, the temperature profile at different times after the step change and in Fig. 9 only the measured and modeled hotspot temperatures (i.e., maximum axial temperatures as depicted as filled marks in Fig. 8) are displayed.


The model predicts a faster adjustment of the steady-state hotspot temperature after about 2 min, whereas 5 min are needed experimentally (Fig. 9). Furthermore, the model fails to describe the change of the hotspot in this interval. The model shows an immediate increase of the hotspot temperature, whereas in the experiment the temperature of the hotspot decreases initially and then rises subsequently. This is observed over the whole length of the reactor (see Fig. 8). The measured temperature rise at the rear end of the reactor at t = 60 s is probably due to the exothermic adsorption of CO2 and H2, which is not present before in the rear section prior to the step change because of almost complete conversion of these components.
The reason for this unexpected measured “wrong-way behavior” of the reactor is the delay of the establishment of the new adsorption equilibrium of steam being not considered by the model, which assumes that the steady-state reaction rate at a given temperature is instantaneously reached. Hence, the model only accounts for transient thermal effects, and the desorption kinetics and the adsorption capacity of the catalyst are not considered. So, the overall response time of the reactor of in total 5 min is in about equal amounts the result of the “delayed” ad-/desorption of steam and of the “thermal” behavior. The former effect is not reflected by the model that only considers the steady-state kinetics (only depending on temperature and the gas-phase concentrations of CO, H2, and H2O) and the general transient mass and heat balance.
The transient kinetic experiments presented in Sect. 4.2 clearly show that the reaction rate and the adsorption equilibrium, respectively, require some time to reach steady state, if the steam content in the syngas changes (Fig. 6). The hotspot position at the higher volumetric flow of 60 L h−1 (STP) is located at a reactor length of 5 cm. At this position, the (modeled) CO2 conversion and, therefore, the content of steam in the syngas is lower (2.4 %) compared to 16 % steam for the lower flow rate (7.5 L h−1) adjusted before the step change from a low to a high volumetric rate was conducted (subfigure of Fig. 9). Thus, the reaction rate and in turn the level of the hotspot temperature are diminished until the respective surplus of adsorbed steam has desorbed into the gas phase.
Fig. 10 illustrates the result of an experiment conducted in reverse direction, i.e., step change from high to low volumetric flow. Again, the model predicts that the steady state is reached earlier. Now the hotspot temperature slightly moves towards the entrance of the reactor (from l = 5 cm to 4 cm according to the experiment), and a clear but small temperature rise is observed before the new steady state is reached. This is a consequence of the pseudo-homogeneous model used in this work.

At the initially high volume flow, the content of steam at the hotspot position is only 2 %, while at the same reactor position 13 % of steam is present (at steady state). This again leads to the “wrong-way behavior”, but now with a higher rate and hotspot temperature, respectively, in the transitional period (0 < t < 120 s). Now a certain additional amount of steam adsorbs in the front region located near the hotspot, which at first has to be produced through the reaction. This takes about 120 s to a higher rate and hotspot temperature in that period compared to the model (not considering this effect).
5 Conclusions
Transient effects on CO2 methanation were studied both in an isothermal reactor with regard to kinetic effects as well as in a wall-cooled fixed-bed reactor with regard to additional thermal effects. The steady-state kinetics of CO2 methanation follow a Langmuir-Hinshelwood approach. The reaction rate is strongly inhibited by steam formed during the reaction.
Isothermal transient kinetic experiments (step change of syngas composition) show a very fast adjustment of the new steady-state reaction rate in case of a step change of the concentrations of CO2 and H2. On the contrary, the steady-state rate is reached with a certain delay (here about 7 min), if the content of steam is changed during a step change from 20 % H2O to a syngas free of steam. Consequently, the instantaneous establishment of steady-state kinetics is not valid in general.
The overall response time of the wall-cooled methanation reactor (here 5 min) is in about equal amounts the result of the “delayed” ad/desorption of steam and of the “thermal” behavior, if steady-state kinetics (only depending on temperature and the gas-phase concentrations of CO, H2, and H2O) and the general transient mass and heat balance are (only) taken into account.
With regard to practical applications, i.e., for the dynamic operation of a methanation reactor, the overall response time is still short, and the rise in the hotspot temperature is small compared to the steady state. Hence, the danger of a thermal runaway is very low even if the feed rate of the syngas is rapidly changed from a high to a low value.
Acknowledgements
The authors gratefully acknowledge the support of the TechnologieAllianzOberfranken and Center of Energy Technology of the University of Bayreuth.
The authors have declared no conflict of interest.
Symbols used
-
- c [mol m−3]
-
molar concentration
-
- cp [J kg−1K−1]
-
thermal capacity
-
- d [m]
-
diameter
-
- EA [J mol−1]
-
activation energy
-
- ΔadsH [J mol−1]
-
adsorption enthalpy
-
- ΔRH [kJ mol−1]
-
reaction enthalpy
-
- k0 [mol(kg s bar)−1]
-
reaction rate constant
-
- K0,1 [bar−0.5]
-
adsorption constant for CO2
-
- K0,2 [bar−0.5]
-
adsorption constant for H2
-
- K0,3 [bar−0.25]
-
adsorption constant for H2O
-
- Kp [–]
-
equilibrium constant
-
- Nu [–]
-
Nusselt number
-
- p [bar]
-
partial pressure
-
- rm [mol kg−1s−1]
-
reaction rate
-
- R [J kg−1mol−1]
-
gas constant (8.314)
-
- T [K]
-
absolute temperature
-
- Tcool [C]
-
cooling temperature
-
- Ubed [W m−2K−1]
-
overall heat transfer coefficient
-
- us [m s−1]
-
superficial velocity
-
 [m3s−1]
 -
volume flow
-
- X [–]
-
conversion
-
- y [–]
-
content (in gas phase)
Greek letters
-
- α [W m−2K−1]
-
heat transfer coefficient [mg3mr−3]
-
- ε [mg3mr−3]
-
porosity
-
- λ [W m−1K−1]
-
thermal conductivity
-
- η [kg m−1s−1]
-
viscosity
-
- ρ [kg m−3]
-
density
-
- ν [–]
-
stoichiometric factor
Sub- and superscripts
-
- 1
-
CO2 concerning constants
-
- 2
-
H2 concerning constants
-
- 3
-
H2O concerning constants
-
- ax
-
axial
-
- bed
-
fixed-bed
-
- eq
-
equilibrium
-
- g
-
gas
-
- p
-
particle
-
- r
-
reactor
-
- tot
-
total
-
- w
-
wall
Abbreviations
-
- LHHW
-
Langmuir-Hinshelwood-Hougen-Watson
-
- PtG
-
power-to-gas
-
- SNG
-
synthetic natural gas