Maximum Spreading of Urea Water Solution during Drop Impingement
Abstract
Droplet impingement of urea water solution (UWS) is a common source for liquid film and solid deposits formed in the tailpipe of diesel engines. In order to better understand and predict wetting phenomena on the tailpipe wall, this study focuses on droplet spreading dynamics of urea water solution. Impingement of single droplets is investigated under defined conditions by high-speed imaging using shadowgraphy technique. The experimental studies are complemented by numerical simulations with a phase-field method. Computational results are in good agreement with experimental data for the advancing phase of spreading and the maximum and terminal spreading radius, whereas for the receding phase notable differences occur. For the maximum spreading radius, an empirical correlation derived for glycerol-water-ethanol mixtures is found to be valid for millimeter-sized UWS droplets as well. A numerical simulation for a much smaller droplet however indicates that this correlation is not valid for the tiny droplets of UWS sprays in technical applications.
1 Introduction
Ammonia selective catalytic reduction (SCR) is an effective technology for removal of nitrogen oxides from the exhaust gas of diesel engines. A urea water solution (UWS) with 32.5 wt % urea (AdBlue®) is injected into the hot exhaust gas pipe to provide the necessary reducing agent ammonia. Through evaporation, thermolysis, and hydrolysis, UWS is converted into ammonia 1-4. On the SCR catalyst downstream, ammonia will finally convert harmful NOx into non-pollutant nitrogen and water 5. In this UWS-based SCR system, technical problems often arise under real driving conditions due to the incomplete conversion of the UWS spray into ammonia. While droplet sizes in the primary spray are typically below 100 µm 6, liquid films may form at the mixer element 7 releasing droplets of millimeter size. At transient operating conditions, the spray will inevitably impinge on the exhaust gas pipe. Liquid films will be formed on the wall leading to undesired formation of solid deposits 8-14. As a result, NOx conversion decreases while backpressure increases, affecting both pollutant emissions and engine performance. Avoidance of solid deposit formation can be achieved by prevention of UWS liquid film formation. Therefore, a good understanding of wetting phenomena of single UWS droplets as central process in liquid film formation is needed.
In the past decades, the interaction of single droplets with solid substrates has been extensively investigated 15-17 and various theories and scaling laws have been proposed to describe wetting/spreading dynamics 18. Most of the experimental studies on single-droplet impingement use model fluids like water, ethanol, or glycerol-water mixtures 19-23. Of particular interest are spreading dynamics on surfaces of different roughness, microstructure, or wettability 24-26. As a powerful alternative to experimental studies, numerical simulations have been applied to explore the droplet wetting process. In literature, various computational methods are used in this context such as volume-of-fluid (VOF) 27-29, level-set 30, front-tracking 31, Lattice-Boltzmann 32 and phase field 33-38.
In spite of a large number of investigations as mentioned above using water and other model fluids, no studies are found on the wetting/spreading behavior of UWS droplets relevant to the SCR application. As a step to fill this gap, the present study combines experimental and numerical investigations of the orthogonal impact and subsequent spreading of a single UWS droplet on a flat surface. The spreading process is investigated for droplets of two different sizes, i.e., 1.95 and 2.96 mm, and three different impact speeds in the range of 1.39–3.36 m s−1. In the experiment, the spreading radii over time curves are determined by a high-speed camera and image analysis.
The numerical simulations are performed with a phase-field method implemented in OpenFOAM which was already validated for various wetting-related flow problems 33, including droplet impact and rebound on micro-grooved structures 39. The underlying code phaseFieldFoam has also been used to study potential bubble formation during back-suction of UWS from the delivery line 40. The experimental and numerical results are compared with each other and with correlations for the maximum spreading radius from literature. By one numerical simulation for a much smaller droplet, the validity of a suitable correlation identified for millimeter-sized UWS drops is tested for tiny droplets occurring in sprays of real SCR application.
2 Experiment
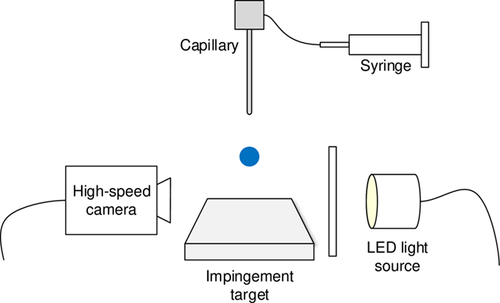
Fig. 1 presents a schematic of the experimental setup. A description of the trigger mechanism as well as details on the verification method and accuracy of image analysis are provided in 13. For this reason, only a brief overview is given below.
2.1 Setup
The liquid used for the experiments is an aqueous urea solution containing 32.5 wt % urea (Merck; > 99.5 % purity) with physical properties as displayed in Tab. 1. Single droplets are produced by a droplet delivery system consisting of a syringe pump supplying liquid to a vertically arranged microcapillary stainless-steel tube. Droplet detachment is induced by gravity, while the initial droplet diameter (D0) is regulated by taking capillaries of two different sizes featuring inner diameters of 110 and 510 µm and outer diameters of 210 and 830 µm, respectively. The resulting droplet sizes, measured by mass and verified by image analysis, are D0 = 1.95 and 2.96 mm, respectively. Both values are close to the capillary length scale, which is 2.65 mm.
Adjustment of impact velocity (U0) is regulated by the falling distance of the droplets independently from droplet size. Theoretical values of the impact velocities are verified by image analysis. The impingement target is mounted for perpendicular impact. The stainless-steel target features an equilibrium contact angle of θ = 50.3° for the UWS, which is measured from sessile droplets. The surface roughness of the polished steel is measured to be Ra = 0.6 µm with a Perthen perthometer M4P. A high-speed camera (LaVision HighSpeedStar 5.1, 1024 × 1024 pixel) is installed to record droplet impingement using shadowgraphy imaging technique. A laser beam captured by a photodiode is used to trigger image acquisition by detection of falling drops. Droplet spreading dynamics are monitored with frame rates of 1000 to 5000 frames per second.
|
Property |
Value |
|---|---|
|
Density ρL [kg m−3] |
1087 |
|
Viscosity μL [mPa s] |
1.29 |
|
Surface tension σ [N m−1] |
0.075 |
Tab. 2 summarizes the parameters of six experimental cases. Each experiment is repeated three times. For these six main cases, temporal spreading curves averaged over the three realizations are presented below. For further experiments with identical droplet size but different impact velocities not listed in Tab. 2, results for the maximum spreading radius will be given only. The variation of the maximum spreading radius in the three realizations is very small with a deviation of less than 2 % only. For all cases, the droplets deposit on the solid surface without splashing.
 (1)
(1)|
D0 [mm] |
Eo |
Oh |
U0 [m s−1] |
Re |
We |
|---|---|---|---|---|---|
|
1.95 |
0.540 |
3.235 × 10⁻³ |
1.39 |
2280 |
54.4 |
|
|
|
|
1.95 |
3204 |
107.5 |
|
|
|
|
3.29 |
5406 |
305.9 |
|
2.96 |
1.245 |
2.626 × 10⁻³ |
1.39 |
3472 |
83.1 |
|
|
|
|
2.24 |
5587 |
215.3 |
|
|
|
|
3.36 |
8381 |
484.3 |
2.2 Image Analysis
An image analysis script for automatic evaluation of the spreading dynamics was written in Matlab. In the first step of this routine all images showing contact between droplet and wall are distinguished and re-labeled. After contrast adjustment, a gray level threshold is calculated from the first image in a series. Based on this, all images are converted to inversed, binary images followed by a connected-components analysis and a filling operation. In case of small deviations in the horizontal arrangement of the impingement target or camera view (impact angle 90°), an inclination correction and image truncation is performed. An automatic detection function for the droplet contour delivers pixel data of the droplet spreading length, which is extracted for each image. The spreading length is converted to metric units using a scaling factor of 0.0122 mm per pixel, which was determined by calibration of a reference image. By this scaling factor, a droplet diameter of 1.95 mm is represented by 161 pixels.
3 Numerical Simulation
3.1 Governing Equations and Code Implementation
 (2)
(2) (3)
(3) (4)
(4) (5)
(5)Here, θ is the energy-equilibrium contact angle and ns is the unit normal to the wall surface pointing outside the solid. Even though the boundary condition (5) incorporates the equilibrium contact angle, it recovers in combination with a no-slip condition at the solid wall the Cox spreading law 46, 47, which can be regarded as a representative dynamic contact angle model.
 (6)
(6) (7)
(7) (8)
(8) (9)
(9)The above set of governing equations is implemented in the open source C++ library OpenFOAM® (foam-ext 1.6) and solved by a finite-volume method (code phaseFieldFoam). Here, spatial derivatives are approximated by a second-order scheme with the Gauss linear correction while temporal derivatives are approximated by the Crank-Nicholson scheme. Adaptive time step control is used with the maximum Courant number limited to 0.1.
3.2 Computational Setup
For numerical efficiency and to allow for a large number of computational cases, all simulations are performed in a wedge-type geometry assuming rotational symmetry. Fig. 2 presents a sketch of the computational domain. The size in radial direction (r) is 6D0, while the height in vertical direction (z) is 1.5D0. The entire domain is discretized by a uniform mesh with identical grid size h in both directions.
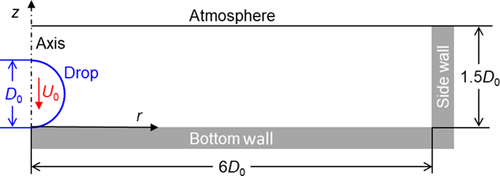
The boundary conditions at the various borders of the computational domain are listed in Tab. 3. It has been checked that with the above radial size of the domain the sidewall is without influence on the spreading process.
|
Patch |
Velocity |
Pressure |
Order parameter |
Chemical potential |
|---|---|---|---|---|
|
Atmosphere |
Zero gradient |
Constant (1 bar) |
Zero gradient |
Zero gradient |
|
Side wall |
Zero |
Zero gradient |
Zero gradient |
Zero gradient |
|
Bottom wall |
Zero |
Zero gradient |
Eq. (5) |
Zero gradient |
The initial phase distribution corresponds to a spherical droplet (diameter D0), which is in point-contact with the bottom wall; see Fig. 2. The initial order parameter field is already diffuse in accordance with the prescribed value of ε, cf. 48. The gas phase is initially stagnant. For the liquid phase (C ≥ 0), the z-component of the velocity is initialized with value –U0 to prescribe the experimental impact velocity of the droplet. Numerical studies in the context of a previous publication 39 proved that initializing the droplet from a certain height above the surface instead from point-contact has only a small effect. While the advancing phase of spreading and the maximum spreading radius are only slightly affected, the late receding phase may be influenced by the formation of a gas bubble below the droplet, which may form in case the drop is initialized above the surface.
All physical properties in the simulations correspond to room temperature. The liquid-phase properties are taken from Tab. 1. The gas density is ρG = 1 kg m−3 and the gas viscosity is μG = 1.48 × 10⁻⁵ Pa s. The wetted wall is considered as atomically smooth having negligible hysteresis. In the wetting boundary condition, Eq. 5, the measured equilibrium contact angle θ = 50.3° is used. Gravity points in negative z-direction with gravitational acceleration g = 9.81 m s−2.
Similar to 33, the numerical parameters of the phase-field method are chosen as follows. The capillary width ε is obtained indirectly via the Cahn number Cn = ε/D0, which is fixed to Cn = 0.01 in the present study. The mixing energy density is obtained from Eq. 4 with σ as given in Tab. 1. The Cahn-Hilliard mobility parameter is related to the capillary width as M = χε2. The numerical value of χ is usually chosen on the order of 10−1–10. Its magnitude has a slight influence on the spreading process and the maximum spreading radius 39. For all simulations in the present study, χ = 0.5 m s kg−1 is employed. Preliminary simulations showed that the maximum spreading radius varies by about approximately 4 % when χ is varied by one order of magnitude.
The diffuse interface is resolved by about four mesh cells, corresponding to h = ε. With Cn = 0.01, the latter criterion corresponds to a resolution of 100 mesh cells per initial drop diameter which is used for all present simulations. The typical CPU time for one test case on a single processor of a standard PC is about 20 h. For analysis of the numerical results, the interface location is identified by C = 0.
4 Results and Discussion
In this section, first a comparison of the instantaneous experimental and numerical droplet shapes for one representative test case is provided. Next, a quantitative comparison is given for the time evolutions of the spreading factor. Results for the maximum spreading factor are compared with two correlations from literature. Finally, a perspective on the spreading behavior of much smaller UWS droplets is given by one numerical simulation.
4.1 Droplet Morphology
Fig. 3 compares the instantaneous droplet shapes in experiment and simulations for one representative case (D0 = 1.95 mm, U0 = 1.95 m s−1) at different time instants of the wetting process. Generally, the simulation results match well with the experimental counterparts in terms of the global morphology evolution of the droplet. At t = 0.3 ms, one observes the formation of a thin liquid rim at the droplet bottom while the spherical shape in the upper part of the droplet is still maintained. As the droplet spreads further out, it exhibits a flattened shape until the maximum spreading is reached at about t = 3.3 ms. Thereafter, the contact line recedes with the drop gradually recovering a spherical cap shape corresponding to the equilibrium state as shown for t = 1000 ms.
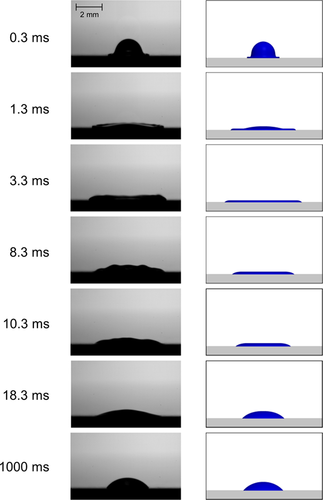
In spite of the qualitative agreement, there exist also some differences between experiment and simulation. At t = 1.3 ms, the fingering phenomena at the edge of the flattened droplet observed in the experiment cannot be reproduced by the rotationally symmetric simulation. For the recoiling stage, capillary waves occur at the free surface of the drop in the experiment (e.g., t = 8.3 and 10.3 ms). These arise due to the pinning of the contact line on the rough surface. In contrast, the gas-liquid interface in the simulation is almost flat as on the smooth numerical surface the droplet recoils without any pinning.
4.2 Spreading Dynamics
A typical measure to quantify wetting dynamics is the spreading factor (β) defined as the ratio between the instantaneous diameter of the wetted circular base area of the droplet and the initial droplet diameter. Fig. 4 illustrates the experimental and numerical time evolutions of β for both droplet sizes. Discrepancies for t < 1 ms can be attributed to the method of initialization in the simulations. For t = 0 s, the interface is initialized with a finite thickness resulting in an overprediction of the spreading factor in the first instants of droplet impact. In the experiments, precise determination of the instant of time of the first contact between droplet and solid surface is limited by the imaging frame rate. Accordingly, a slight shift of the experimental and numerical spreading data in time can be assumed.
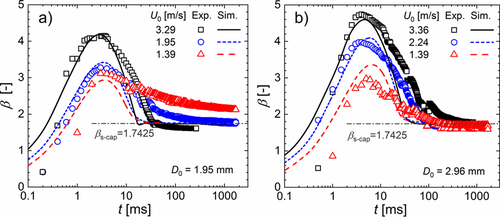
In Fig. 4, some expected general trends could be observed in experiment and simulation. For a fixed droplet diameter, an increase of the impact velocity results in a larger maximum spreading factor (βmax) achieved at an earlier instant in time. After reaching the maximum spreading radius, the relaxation phase starts where the droplet recoils until it attains the equilibrium state, where β is constant in time. For the advancing phase, the agreement between experiment and simulation in general is good. The agreement in βmax is satisfactory for the two largest velocities of each drop size, but is less good for the lowest velocity. Concerning the recoil phase, the contact line recedes much faster in the simulations as compared to the experiment. Consequently, the droplet reaches the final static state in the simulation earlier as compared to the experiment.
The differences in the receding phase can be rationalized by the fact that in the simulation the solid surface is assumed perfectly smooth whereas in the experiment the surface has finite roughness. The latter causes frictional and pinning effects, which slow down the contact line motion during the receding phase. Therefore, in the experiment, the droplet shape is approaching the equilibrium state much slower and with a longer relaxation phase as compared to the simulations. In the experiment with lowest initial kinetic energy (D0 = 1.95 mm, U0 = 1.39 m s−1), the receding phase is not finished within the measurement time as β is still decreasing in Fig. 4a. The described differences between the experimental and numerical results indicate that the surface roughness plays a notable role in the relaxation phase. In the advancing phase, where inertial effects dominate, surface roughness is less important in contrast. This behavior is in accordance with the experimental findings on the relaxation phase reported in 20 and was also noted in our previous numerical study 39.
 (10)
(10)for θ = 50.3°. This demonstrates that the measured equilibrium contact angle is reasonably accurate.
4.3 Maximum Spreading Factor
The maximum spreading factor (βmax) is an important parameter for characterizing droplet impingement and wetting. This parameter is of particular interest for the application background of the present study, where coalescence of neighboring impinging droplets may initiate UWS film formation. Additionally, the size of wetted area affects the evaporative cooling of the wall. If βmax can be reduced, the probability of droplet interaction and UWS liquid film formation might decrease.
 (11)
(11)This relation is obtained by experiments for drops consisting of glycerol-water-ethanol mixtures with parameters in the following ranges: liquid viscosity 1–300 mPa s, surface tension 40–73 mN m−1, contact angle 35–90°, drop diameter 2.0–4.0 mm, impact velocity 1.3–4.9 m s−1. The ranges of the Reynolds and Ohnesorge numbers are 19 ≤ Re ≤ 16 400 and 0.002 ≤ Oh ≤ 0.58, respectively. Since all parameters in the present study are within or close to the respective ranges, Eq. 11 is especially suited to serve for a comparison here.
Bayer and Megaridis 50 performed experiments with water droplets (D0 = 1.4 mm, U0 = 0.47–2.4 m s−1, Oh = 0.003, We = 3–120) impacting on substrates with contact angles 20°, 74°, and 135°. By a regression fit, they obtained a correlation similar to Eq. 11 but with prefactor 0.72 and exponent 0.14. Fig. 5 compares both correlations. The correlation of Bayer and Megaridis 50 is determined for a much smaller range of Re2Oh and is terminated at 2.7 × 10⁴, where fingering instabilities are expected to appear. This correlation predicts slightly smaller values of βmax as compared to 24. The reason may be the incorporation of data for a hydrophobic surface, which results in lower values for βmax as compared to hydrophilic surfaces.
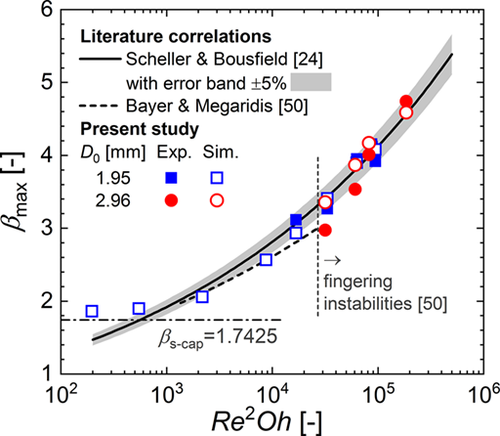
Fig. 5 compares the present experimental and numerical results for βmax (including cases not listed in Tab. 2) with the two latter correlations from literature. The agreement between the present experimental and numerical results can be considered good for the smaller drop, with a maximum deviation of about 6 %. For the larger drop, the deviation is higher and up to 11 %. No systematic over- or underestimation of the experimental values by the simulation can be noted. The agreement of the present results for βmax with Eq. 11 is good, considering the maximum error of the correlation being about 5 % 24.
The four leftmost numerical data in Fig. 5 for droplet size D0 = 1.95 mm are without experimental counterpart. The corresponding impact velocities of 0.15, 0.25, 0.5, and 1.0 m s−1 are below the experimental range in 24. For the two lowest impact velocities, the numerical values for βmax are quite large when compared with Eq. 11. However, this obvious disagreement is plausible. As U0 decreases, βmax decreases and asymptotically approaches βs-cap as values βmax < βs-cap = 1.7425 cannot be reached for the present contact angle θ = 50.3°.
4.4 Perspective for UWS Droplets in Technical Application
In automotive SCR applications, droplets are usually much smaller than investigated in the present experiments. For pressure-driven spray injectors, the Sauter mean diameter is in the range of 60–80 µm with wall-normal droplet impact velocities up to 20 m s−1 6. Therefore, it is of interest in how far Eq. 11 applies to such conditions as well. To investigate this topic, one additional simulation for a much smaller droplet size with higher impact velocity is performed keeping the other parameters unchanged. The droplet size and impact velocity are chosen as D0 = 0.195 mm and U0 = 10.97 m s−1, respectively, corresponding to Re = 1802, We = 340, and Re2Oh = 33216. The latter value is the same as in Fig. 3 where D0 = 1.95 mm and U0 = 1.95 m s−1. Due to the higher impact speed, the spreading of the 0.195 mm droplet is much faster as compared to Fig. 3.
Fig. 6 displays a visualization of the droplet shape during the early spreading process at two instants in time. At 7 µs, a lift-off of the lamella can be seen in Fig. 6a whereas at 11 µs a contact of the lamella with the solid wall ahead of the original contact line is visible in Fig. 6b. Both images are very similar to the sketch in Fig. 2a of Thoroddsen et al. 51, who performed experiments with water-glycerin drops of much larger size (D0 ≈ 5.1 mm). The authors observed the tip of the spreading lamella being separated from the surface and riding on a cushion of an air layer (corresponding to present Fig. 6a). This is followed by a localized wall contact ahead of the initial contact line (corresponding to present Fig. 6b) leading to bubble entrapment while the lamella front becomes unstable due to fingering instabilities ultimately resulting in splashing. The present numerical results in Fig. 6 thus seem to be physical. However, the simulation is not continued in time as fingering instabilities and splashing cannot be captured by the assumed rotational symmetry.
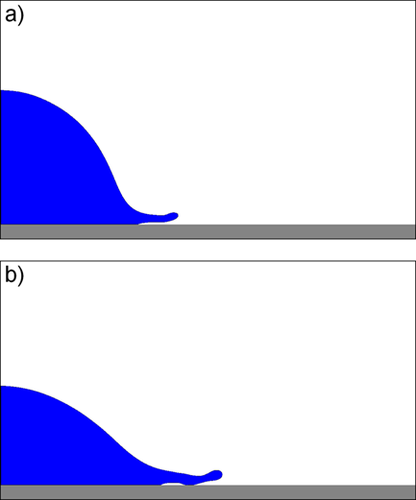
Though the group Re2Oh = 33216 is identical for the simulations in Figs. 3 and 6, the spreading behavior in both cases is very different as the larger drop deposits while the smaller one splashes. While the spreading correlation in Eq. 11 is valid for UWS drops of millimeter size, it is obviously not applicable for much smaller droplets as they occur in sprays for automotive SCR applications.
5 Conclusions and Outlook
The droplet impact and spreading process for urea water solution (UWS) is investigated experimentally and numerically. By high-speed imaging, single-droplet impingement is analyzed for two different droplet sizes, i.e., 1.95 and 2.96 mm, at various impact velocities of 1.39–3.36 m s−1, all cases resulting in deposition without splashing. Spreading data is obtained by image analysis and compared to numerical simulation results found by a phase-field method. Experimental and numerical results of the spreading process show good agreement for the advancing phase and for the maximum and terminal spreading factor. For the receding phase, differences can be observed, which originate from the simplification of a perfectly smooth surface in the simulation.
For the above ranges of droplet size and impact velocity, the present results for the maximum spreading factor agree reasonably well with an empirical correlation proposed by Scheller and Bousfield 24, indicating that this correlation is suitable for estimating the maximum spreading radius of UWS droplets at these conditions.
In exhaust-gas aftertreatment systems, droplets in UWS sprays have typically much smaller size and larger impact velocity than experimentally investigated here. A numerical simulation for a droplet with tenfold smaller diameter (0.195 mm) impinging with increased velocity (10.97 m s−1) leads to the lift-off of the lamella and potential subsequent splashing instead of deposition. This result indicates that correlations for the maximum spreading factor may not be applicable at conditions outside the range of drop diameter and impact speed for which they were obtained, even if the relevant dimensional group of the correlation is kept constant. Instead, a careful estimation of the impingement outcome (deposition, splashing) by reliable regime maps is required beforehand.
This study represents a first approach to characterize spreading of UWS droplets on a stainless-steel surface. To improve the numerical predictions for the receding phase, the effect of surface roughness has to be taken into account. In terms of real applications, future studies might extend the parameter range to droplets of smaller size and higher impact velocity. Focus should also be put on the effect of physical properties of the solution since before impingement the urea concentration in the droplet increases due to water evaporation in the exhaust gas. Related investigations may finally deliver data to derive suitable submodels for droplet impingement in comprehensive simulations predicting film formation in real applications.
Acknowledgements
The authors kindly acknowledge financial support by the Deutsche Forschungsgemeinschaft (DFG) through the Collaborative Research Center SFB-TRR 150. The authors also thank Dr. Holger Marschall, the main developer of the code phaseFieldFoam, for his continuous support and M.Sc. Shuo Wang for performing some of the numerical simulations.
The authors have declared no conflict of interest.
Symbols used
-
- Cn [–]
-
Cahn number
-
- D0 [m]
-
initial drop diameter
-
- Eo [–]
-
Eötvös number
-
- g [m s−2]
-
gravity vector
-
- g [m s−2]
-
gravitational acceleration
-
- h [m]
-
grid size
-
- M [m3skg−1]
-
mobility
-
- ns [–]
-
outward unit normal vector to the solid surface
-
- Oh [–]
-
Ohnesorge number
-
- p [Pa]
-
pressure
-
- Re [–]
-
Reynolds number
-
- t [s]
-
time
-
- U0 [m s−1]
-
drop impact velocity
-
- u [m s−1]
-
velocity field
-
- We [–]
-
Weber number
Greek letters
-
- β [–]
-
spreading factor
-
- ε [m]
-
capillary width
-
- θ [°]
-
contact angle
-
- λ [J m−1]
-
mixing energy density
-
- μ [Pa s]
-
dynamic viscosity
-
- ρ [kg m−3]
-
density
-
- σ [N m−1]
-
coefficient of surface tension
-
- ϕ [J m−3]
-
chemical potential
-
- χ [m s kg−1]
-
prefactor in mobility relation
Subscripts
-
- G
-
gas phase
-
- L
-
liquid phase
-
- max
-
maximum value
-
- s-cap
-
spherical cap
Abbreviations
-
- SCR
-
selective catalytic reduction
-
- UWS
-
urea water solution


