Deliquescence and Efflorescence of Hygroscopic Salt Particles in Dust Cakes on Surface Filters
Abstract
In the case of dust separation with surface filters, both the structure of the formed cake and the adhesive bonds on particle contacts significantly influence the operating behavior. Microscopic as well as macroscopic insights into the characteristics of deliquescence and efflorescence of salt particles in contact with non-hygroscopic particles are presented. By means of an environmental scanning electron microscope a change to the adhesive bonds as well as a restructuring of the dust cake are observed. The change in the performance of test filters by inducing deliquescence and efflorescence of the salt particle fraction in a dust cake is investigated on a customized standard filter testing rig.
1 Introduction
1.1 Surface Filtration and Raw Gas Conditioning
Characteristics of the operating behavior of surface filters for dust separation are inter alia the progress of pressure loss during the filtration phase as well as the residual pressure loss after regeneration. In terms of process technology, these characteristics can be influenced by raw gas conditioning, e.g., by changing the particle characteristics in the dust cake 1, 2.
Influencing the characteristics by changing gas humidity is generally described in the literature as being very complex 3. The cohesion, i.e., the mechanical stability, of the dust cake for example increases by a high moisture content. As a result, cake compression and, thus, the increase in the pressure loss are reduced. Stronger cohesion is also desirable in the subsequent regeneration, as this theoretically supports an uniform removal of the dust cake. However, the increased moisture leads to an intensified adhesion of the dust cake to the filter medium, whereby regeneration in turn is hindered. A separate influence on the cohesion and adhesion is not possible solely by a continuous change in the gas humidity.
Zhang 4 recently described a new approach for influencing the performance of surface filters by adding a fraction of hygroscopic salt particles to a dust cake of non-hygroscopic particles. Taking the advantages of the deliquescence and efflorescence properties of hygroscopic salt particles, the formation of solid bridges between dust particles in the filter cake and, thus, a separation of the two effects is theoretically possible. Through filtration of a fraction of hygroscopic salt particles added to the raw gas, contacts between salt particles and the main dust particles can be produced on the dust cake.
By temporarily increasing the gas humidity over the deliquescence humidity, liquid bridges between main dust particles are formed from the resulting saline solution at the contact points. Upon reaching the original gas humidity, which is below the efflorescence humidity, in turn, the crystallization of the salt is induced at the liquid bridges. In this case, solid bridges in the filter cake are very probably formed between the main dust particles. With this innovative concept for raw gas conditioning, a flexible and targeted strengthening of the cohesion within the filter cake without a forced, simultaneous modification of the adhesion between the dust cake and the filter medium is possible.
1.2 Deliquescence and Efflorescence of Hygroscopic Salt Particles
Deliquescence describes the change of a solid substance to a solution by absorption of moisture from the surrounding atmosphere, when a certain relative ambient humidity (RH), the deliquescence humidity (DRH), is exceeded. If, in turn, a spontaneous evaporation of the water of a saturated salt solution initiates crystallization of the dissolved components, this is called efflorescence. This process occurs when the relative ambient humidity falls below a certain value, the efflorescence humidity (ERH).
The deliquescence and efflorescence behavior of hygroscopic salt particles in a gaseous environment is a well-studied phenomenon but so far only for isolated salt particles. Tang et al., for example, studied how the relative mass of a suspended particle changes during moisture-induced deliquescence and efflorescence 5. In this investigation it was found that a solid salt particle spontaneously and completely dissociates to a drop of saturated solution when reaching the deliquescence humidity. A gradual phase transition was not observed. The same applies to the efflorescence of the solution drop to the solid particle when falling below the efflorescence humidity. Accordingly, a particle is either present exclusively as a solid particle or completely dissociated as a solution droplet.
The influence of particle-wall and particle-particle contacts on these processes was recently investigated by Horst et al. 6. When looking at individual particles, it was found that partial deliquescence takes place at the contact faces between two particles. This is due to the capillary pressure and the subsequent lowering of the saturation vapor pressure. Since the relative humidity is the quotient of the partial pressure of the water and its saturation vapor pressure, the relative ambient humidity in the contact area of the particles is increased locally. In this area, the deliquescence humidity is just reached or exceeded, even before the ambient humidity around the salt particles is equivalent to its deliquescence humidity.
In particle collectives, the resulting liquid bridges in the contact faces lead to attractive forces, which initiate movements of particles towards a state of equilibrium. Furthermore, the influence of the wettability of surfaces by the salt solution and its influence on the morphology of the forming crystals through efflorescence was investigated. The recrystallization to the original crystal structure is therefore strongly affected by wetting effects.
1.3 Objective of the Present Investigations
The aim of the present investigations is to understand both the microscopic processes and the associated macroscopic effects of the deliquescence and efflorescence of a fraction of hygroscopic salt particles in a non-hygroscopic dust cake. An environmental scanning electron microscope (ESEM) was used to examine the influence of deliquescence and efflorescence of salt particles on particle contacts and on the structure of dust cakes. By a temporary modification of the gas humidity, the deliquescence and efflorescence were induced and the occurring changes of particle contacts and structures of dust cakes were inspected.
Furthermore, investigations to appropriately prepared dust cakes on an adapted filter test apparatus according to VDI 3926-1 7 are presented. Here, the influence on the performance – such as the pressure loss curve and the regeneration – of test filters is evaluated. Finally, the findings from the microscopic and macroscopic investigations will be brought into agreement with each other. All results obtained are considered and valued together, and critically questioned in particular in their correlation.
2 Insights into the Microscopic Characteristics
2.1 Experimental Investigation Using an Environmental Scanning Electron Microscope
2.1.1 Materials and Methods
Sodium chloride (NaCl) was used as hygroscopic salt, since it has advantageous properties for the experiments. Unlike many other salts, the deliquescence humidity of NaCl is relatively independent of the temperature. At 0 °C, it is at a value of 75.9 % and drops at 25 °C by only 0.5 % to a value of 75.4 % 5, 8. This facilitates the comparison of the investigations in the ESEM carried out at 1 °C and those at the filter test rig performed at 20–25 °C. Furthermore, the deliquescence humidity of around 75 % is not that high that other effects such as capillary condensation in the dust cake could overlap with the deliquescence effects. In addition, air borne NaCl crystals are cubic, which simplifies their localization and the determination of their size in the microscopic images. As a non-hygroscopic bulk material mainly finely ground limestone test dust (Ulmer Weiß XMF, x50,3 = 3 μm) was used. To clarify certain processes, glass spheres (SiLibeads Glass beads Type S) with a significantly larger size were employed additionally.
The microscopical investigations were performed with a Quanta 450 FEG ESEM (FEI, Hillsboro, OR, USA) equipped with a Peltier cooling stage. In this case, the relative ambient humidity closely around the sample in the sample chamber is defined as a function of the controlled temperature of the cooling stage and the chamber pressure, which is generated by using pure water vapor. The microscope was operated at an acceleration voltage of 10 kV using backscattered electrons (BSE) for imaging with a gaseous analytical detector (GAD). The BSE signals enable a clearer distinction between different substances in a sample. Due to the high material contrast, e.g., between water and NaCl, liquid accumulations are clearly visible. This is due to the fact that the yield of BSE is proportional to the average atomic number of the element, which is hit by the electron beam.
High pressures have a negative impact on the image quality, as the electron beam is spread and weakened by the gas in the chamber, resulting in a significantly lower resolution of the images obtained. To overcome this problem, the samples were cooled to 1 °C so that the working pressure in the chamber could be limited up to 660 Pa (RH(1 °C, 656 Pa) = 100 %). In this pressure range, the deliquescence as well as the further absorption of the water by the liquid bridges could be observed.
The characterized samples were prepared in two different ways on sample holders suitable for the microscopical investigations in an ESEM. First, powder mixtures of hygroscopic salt particles and non-hygroscopic particles were created from bulk materials. The created powder mixtures were then used to generate packed beds on a carrying plate or on a fine wire cloth, which were mounted on a sample holder for the cooling stage in the sample chamber. In a second method, airborne non-hygroscopic particles and salt aerosol particles were subsequently separated on a substrate (like fine wire cloths) by filtration, so that a dust cake was formed in the end. A dust disperser with rotating brush helped to generate airborne non-hygroscopic particles from bulk materials. To generate hygroscopic salt aerosols from salt solutions with different concentrations, a TSI Constant Output Atomizer (Model 3076) in combination with a TSI Diffusion Dryer (Model 3062) was applied.
2.1.2 Characterization of Salt Particles and Particle Contacts in Dust Cakes
Previous studies on the deliquescence and efflorescence of hygroscopic salt particles in particle-wall and particle-particle contacts 6 demonstrated that investigations on a loose powder or packed beds with particles on a sub-micrometer or micrometer scale with scanning electron microscopy (SEM)/ESEM/energy-dispersive X-ray spectroscopy (EDX) techniques must be handled with great care and prudence. This results in the following approach to investigate phenomena with the prepared samples. After preparation, the samples were transferred to the sample chamber of the ESEM, which was then evacuated. Subsequently, the sample chamber was purged repeatedly with water vapor at moderate pressures (10–200 Pa) so that ideally only water molecules remain in the atmosphere of the chamber. The cooling stage was then set to a temperature of 1 °C. Thereafter, the chamber pressure was increased with a small difference between the setpoint and the actual value (maximum 15 Pa), up to a pressure of 400 Pa (RH < 65 %). After an equilibration period of at least half an hour, all relevant imaging settings were made.
Once all imaging settings have been completed, the corresponding parameters for the subsequent examinations with the sample are no longer changed. These can only be made meaningful while the sample is being scanned by the electron beam. However, this would in turn lead to an additional energy input. A very short dwell time of the electron beam per image/frame was chosen, i.e., recording times of less than 19 s. At the expense of image quality, the energy input is greatly reduced in this way. In order to achieve a further reduction of the energy input, the electron beam was blanked out between the individual image recordings. Then, only the pressure was subsequently varied in steps of 10 Pa. After reaching the desired pressure, an equilibration time of at least 5 min was maintained. Thereafter, the electron beam was switched on for the duration of a single complete scan of the sample before it was blanked out again.
2.2 Observation Results and Discussion
2.2.1 Particle Movements
Fig. 1 presents the BSE images of glass beads in contact with ground NaCl on a fine wire cloth. The first image (Fig. 1a) shows the initial situation. Upon reaching the deliquescence humidity, liquid bridges form from salt solution drops. Due to the forces acting on the contacts, smaller glass spheres are moved towards a larger sphere out of their original position (Fig. 1b). After the subsequent efflorescence, the smaller spheres are moved further towards the larger one (Fig. 1c).
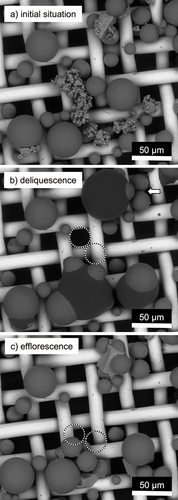
This type of particle movement, the so-called self-organization, has already been examined by Schröter and also made visible with the aid of an ESEM 9. In contrast to the experiments presented here, however, condensing water vapor was investigated there to form liquid bridges. The fluid bridges have a concave shape, similar to the liquid bridges that have been shown in the previous studies on the deliquescence of salt particles in particle-wall and particle-particle contacts 6. The amount of fluid that arises here during the spontaneous, complete deliquescence is significantly larger. Therefore, less of a bridge than much more a drop, in which the glass ball dips, forms. Unlike the liquid bridges, this drop is convex, which in principle indicates an overpressure within the liquid, which in turn would tend to exert a repulsive force on the particles.
On closer examination of the contact lines of saline solution and glass sphere, it can be seen that a contact angle of less than 90° is present. Therefore, it can be assumed, however, that a concave bridge forms at the moment when the drop touches the glass sphere. This exerts an attractive force on the sphere, causing the movement to be triggered. Since the drop is convex in shape, the movement of the particles ends as soon as there is a balance between the attractive and repulsive forces. At this equilibrium, the spheres, apparently depending on their diameter, are submerged to some degree. Smaller spheres seem to be further submerged than large ones. This is due to the fact that they displace a smaller volume at the same immersion depth.
On closer inspection, a concave fluid bridge between two spheres in the upper right edge of the image can be seen in the second image (Fig. 1b). These two spheres align according to the forces acting on them. A more detailed description of the processes can be found in the studies of Schröter 9.
As the relative humidity is reduced, the various fluid formations undergo efflorescence at different relative ambient humidity. As already described in the previous studies 6, the influence of the electron beam on this process cannot be completely neglected. Therefore, these observations should be taken with caution. Nevertheless, it becomes clear during the experiment that the concave liquid bridge crystallizes at significantly lower ambient humidity. Since both deliquescence and efflorescence are processes that are based on the partial pressure difference as a driving force, this observation is also plausible. The salt crystals that form, thereby strive for their natural cubic structure. The glass beads are partially enclosed in these crystals.
2.2.2 Caking
The following pictures (Fig. 2) illustrate a caking process of finely ground limestone and NaCl particles. For this experiment, NaCl particles were deposited on a packed bed of limestone powder as a salt aerosol stream overflowed the bed for a certain duration. In the first image (Fig. 2a), NaCl particles are clearly visible on the limestone particles. The salt crystals stand out visually, both because of their brighter appearance, as well as due to their cubic structure, which clearly differs from the broken structure of the limestone particles. Upon reaching the deliquescence humidity, liquid droplets are formed (Fig. 2b), as in the previous examination. Limestone particles are partially pushed aside and appear, as before the glass spheres, to penetrate into the drops to a certain equilibrium depth.
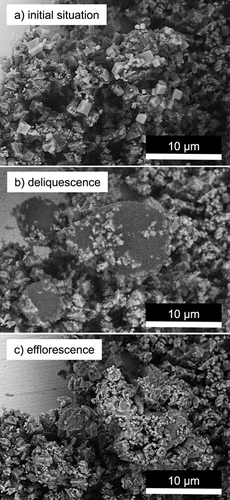
The biggest difference to the first shown experiment is displayed in the last picture (Fig. 2c). After the solution drops have undergone efflorescence, the limestone particles are not only visibly agglomerated, but apparently also coated with a crust of NaCl. It is obvious that the cohesion of the particles was very likely increased significantly by this procedure. Cubic crystal structures of NaCl are no longer recognizable here, which is influenced by the numerous contact areas to limestone particles, the irregular surface structure, and the wettability of surfaces of these particles.
2.2.3 Restructuring
The microscopic processes with a view to the deliquescence and efflorescence of salt particles in a dust cake were examined with a suitably prepared sample. In this case, airborne limestone particles were generated and then separated on a fine wire mesh by filtration with an air-to-cloth ratio of 180 m h−1, until a closed and uniform layer of limestone dust particles with a particle mass per filter area of about 5–7 g m−2 was generated. Subsequently, salt aerosol particles were separated on the previous dust cake by filtration with the same flow condition, i.e., deposited mass per filter area < 1 g m−2. The as-prepared samples were mounted on a sample holder and characterized by the ESEM.
When evacuating the sample chamber, the previously formed dust layer on the sample holder is always partly destroyed by flow forces, so that the middle area of a sample is no longer available for targeted investigations. The following results were obtained along the edges of a sample where the original dust cake has been largely preserved.
With increasing ambient humidity, movements of the particles in the dust cake can already be detected below the deliquescence humidity. These movements occur only slightly in this first phase. In a second phase, when exceeding the deliquescence humidity sudden, much more intense movements of the particles in the dust cake were observed. A further increase in humidity then only leads to further lighter movements in a third phase.
It is presumed that local deliquescence of the salt particles occurs at the contact faces of salt particles with other particles in the first phase. The formed liquid bridges and the accompanied attractive forces, as already seen in accumulations of pure salt particles in the previous studies 6, ensure that the particles start to move until equilibrium arises. In the second phase, in which the deliquescence humidity is reached, the solid components of the salt dissolve, which leads to a considerable increment in the amount of liquid in the dust cake. The previously formed balance is abruptly disturbed significantly, resulting in a sudden restructuring of the particles in the dust cake. In the third phase, further absorption of water vapor by the saline solution from the ambient atmosphere leads to another disbalance and a subsequent further self-organization of the particles.
The subsequent decrease in pressure in the chamber results in further movements due to the evaporation of water from the saline solution and the concomitant change in the liquid bridges. The shrinking liquid bridges change the balance of forces, which act on the dust particles of the dust cake. This restructuring process in the dust cake is ongoing until the efflorescence of salts has been carried out throughout the dust cake. Fig. 3 presents two images of a dust cake recorded before (Fig. 3a) and after (Fig. 3b) the deliquescence and efflorescence of the salt particles.
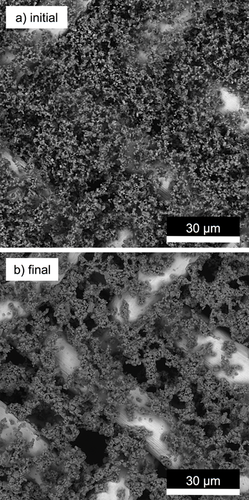
There is a contraction of the particle layer visible. The particles that lay on the metal wires were pulled away laterally. The previous homogeneous, finely pored particle layer gains significantly enlarged pores between the particle dendrites, which itself become considerably more compact than the previous homogeneous particle structure. It can be assumed that such a change in the structure has a significant influence on the flow resistance of the particle layer.
3 Insights into the Macroscopic Characteristics
3.1 Experimental Investigations Using a Filter Test Rig
For the investigation of the influence of moisture-induced deliquescence and efflorescence on the performance of surface filters, an existing standard filter test rig 4, 7 has been equipped with several add-on components. Fig. 4 gives a schematic illustration of the original filter test rig (components shown in dark gray) and the supplemented components (shown in light gray).
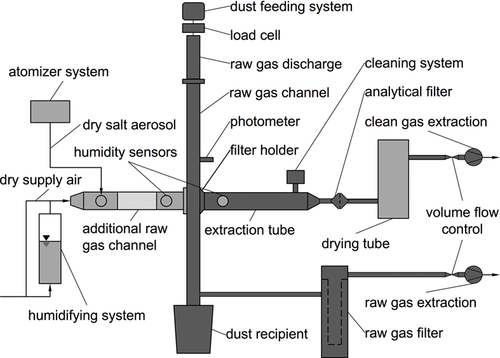
Among other components, a movable, second raw gas channel was installed in an opening of the original raw gas channel, which acts additionally as a viewing window. The opening is located on the opposite side of the opening to the extraction tube. This additional raw gas channel has a viewing window in the middle of the tube, two side-mounted flanges for attachment of various additional components, such as a probe for introducing an aerosol of hygroscopic salt particles and a mixing chamber with connections for humidified air from a humidifier system as well as dry supply air.
The humidifier system was constructed based on the model of a bubble column: a cylindrical container is filled with deionized water, which is tempered at the laboratory temperature. At the bottom of the container, a frit, i.e., a porous plate of sintered glass balls, is inserted, over which a purified, compressed air flow enters the container. The frit separates the flow of air into very small air bubbles, resulting in a significant increase in the surface area and in the residence time of the airflow. In this way, the outlet air flow is completely saturated with water vapor.
The relative humidity of the air flow through the additional raw gas channel, which is used to humidify a dust cake, is then adjusted by the appropriate mixing ratio of the humid air flow to the dry supply air flow. In the direction of the clean gas extraction, a drying tube was installed behind the analytical filter, which removes the moisture from the gas stream to protect the mass flow controller.
For the main dust filtration with finely ground limestone test dust, the filter test rig was operated with the original raw gas channel and standard gas flow. By using of dry compressed air for the dust feeding system, the raw gas with main dust particles is generally dry (RH < 25 %). The screening tests were carried out with standard test filters (exposed diameter = 140 mm, one piece per test) as well as with rescaled test filters (exposed diameter = 40 mm, four pieces per test 4). Singed polyester needle felts were used as filter media. For all results described below, an air-to-cloth ratio of 180 m h−1 was set. The raw gas concentration during the main dust filtration was continuously adjusted to 5 g m−3 (±5 %).
NaCl particles were added to the dust cake following to the main dust filtration. For this process, the viewing window of the original raw gas channel was removed and a flange with a welded-on pipe section was built in to bridge the additional raw gas channel. Subsequently, the additional raw gas channel was moved up to this flange. The dry salt aerosol was then generated and fed into the raw gas channel. The same air-to-cloth ratio was adjusted as before by using an additional dry supply air (RH < 10 %). By varying the duration of the main dust filtration and the salt aerosol filtration, main dust cakes with defined mass per filter area and an added fraction of dry NaCl particles in various amounts were prepared.
Before the humidification of a dust cake by an air flow free of particles with just defined RH, the relative humidity of this air flow was adjusted, while the additional raw gas channel was moved back from the connecting flange for a limited period. The subsequent dehumidification was carried out by switching from humidified air to dry supply air.
3.2 Influence of Hygroscopic Salt Particles on the Operating Behavior of Surface Filters
3.2.1 Pressure Losses
Fig. 5 displays the pressure loss curve of a test on a standard test filter. The main dust cake was built up to a pressure drop of 900 Pa. Subsequently, a further pressure loss of 100 Pa was caused by the deposition of fine salt particles (x50,3 = 1.2 μm) in the dust cake. The salt aerosol was generated by atomization of a 20 g L−1 NaCl solution, and the raw gas with dry salt aerosol during the filtration has an RH of < 20 %.
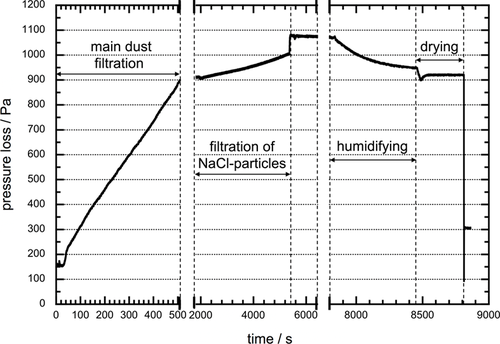
During adjusting the RH of the air flow to humidify the dust cake, the gas extraction through the dust cake was continued, so that it was exposed to the ambient humidity (RH < 40 %). This resulted in a surprising jump-like increase in pressure loss of about 70 Pa. During the subsequent humidification (RH upstream slightly over the deliquescence humidity of the salt), an exponential decrease in the pressure loss results, which causes a pressure drop reduction of about 125 Pa. In the following drying process, first a sudden drop in pressure loss by about 45 Pa occurs, which is followed by a slight, softer increase of about 20 Pa. This characteristic course was found in all investigations. The extent of the pressure changes depends on the amount of the added salt particles – the more salt particles added, the greater the pressure changes.
At present, it is not fully understood why the sudden increase in pressure loss occurs when the dust cake is exposed to air with fairly low relative humidity (RH < 40 %). It is presumed that, with the relative humidity below 40 %, sorption layers due to water vapor absorption are formed on particle surfaces. Even though the absorbed amount of liquid is relatively small, it causes an apparent, measurable increase in the specific cake resistance in a finely pored dust cake. This is supported above all by the change in pore size of such pores on a micrometer und sub-micrometer scale. To clarify this phenomenon, comparable dust cakes made exclusively of limestone test dust were slightly moistened (40 % RH) and dried cyclically. When the moist air hits the dust cake, a sudden increase in pressure loss could also be recorded here. The additional pressure loss is significantly lower in the investigations without salt compared with the change in the tests with salt particles, which can be explained by the fact that subsequently added fine salt particles considerably reduce the pore size in the dust cake. During subsequent drying, this additional pressure loss was degraded again.
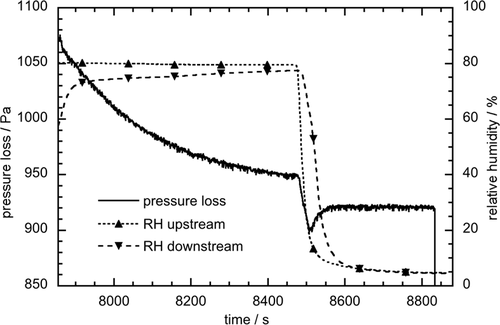
To highlight the characteristic course of humidification/dehumidification of the dust cake with a fraction of salt particles, the relative humidity of the air upstream and downstream the filter during this process is considered in addition to the pressure drop curve (Fig. 6). When the humid air stream (about 80 % RH) hits the dust cake, the pressure drop decreases exponentially, as already described. At the same time, the relative humidity of the clean gas (Fig. 6, RH downstream) initially rises abruptly, but then gradually adapts to the raw gas humidity (Fig. 6, RH upstream). When a constant pressure loss is reached, the clean gas humidity becomes equal to the raw gas humidity. In the subsequent drying process, the clean gas humidity drops more slowly than the raw gas humidity. Again, an adjustment of the humidity can only be determined when a constant pressure loss is reached. The difference between the raw and clean gas humidity during humidification and dehumidification of the dust cake is due to the fact that the salt particles absorb or release moisture and, thus, the moisture is removed from or added to the gas as it flows through the filter cake.
3.2.2 Regeneration
In respect of regeneration of the filters, the dust cake discharge is the main focus of the investigation. For this purpose, screening tests were carried out with rescaled test filters (exposed diameter = 40 mm, four pieces per test). Comparable dust cakes with the same final pressure loss under identical filtration conditions were generated by varying the amount of the salt particles added subsequently in the main dust cake. Before the regeneration was initiated, the dust cakes underwent a standard humidification/dehumidification process as described above. The tank overpressure for the regeneration was set relatively low (1 bar tank overpressure and a valve opening time of 80 ms, cf. 7) and uniform for all tests, so that some cake patches remain on the filter area.
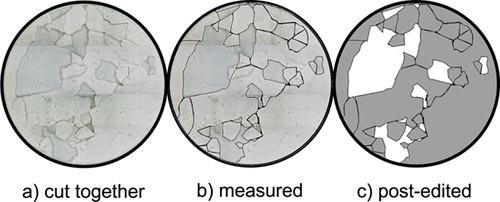
After regeneration, the total filter area was inspected by using a digital incident light microscope; a following image analysis then yields an area-related regeneration result. Fig. 7 illustrates the single steps for the evaluation method. First, single shots of a filter at a specified magnification (20× magnified) are assembled to recover the entire filter area (Fig. 7a). Remaining cake patches are then marked with polygons and measured (Fig. 7b). A post-edited image is generated for further use (Fig. 7c).
Tab. 1 indicates the four test series for the investigation on the regeneration with varied parameters and evaluation results. Fig. 8 summarizes typical regeneration results of the four test series presented as post-edited images of the filters after regeneration. It can be clearly seen that the regeneration results differ significantly from each other.
|
Test series |
Varied parameters |
Areal degree of Regeneration [%] |
||||
|---|---|---|---|---|---|---|
|
Pressure loss of the prepared dust cake [Pa] |
Humidification/dehumidification before regeneration |
RH [%] |
Average |
STD |
||
|
Main dust cake |
Salt particles |
|||||
|
a) |
1000 |
0 |
No |
– |
96.22 |
1.12 |
|
b) |
1000 |
0 |
Yes |
80 |
86.04 |
2.65 |
|
c) |
990 |
10 |
Yes |
80 |
96.85 |
2.49 |
|
d) |
950 |
50 |
Yes |
80 |
48.16 |
22.94 |
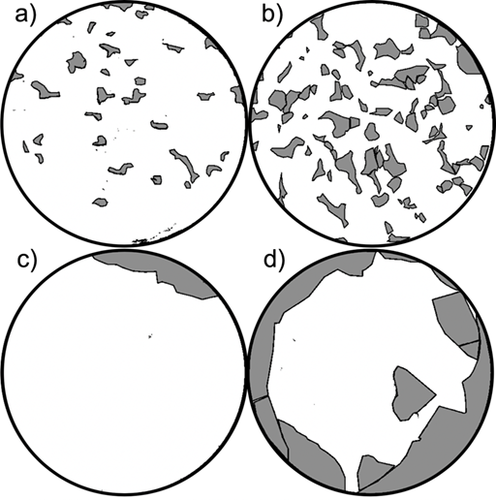
All generated dust cakes have the same final pressure loss of 1000 Pa at an air-to-cloth ratio of 180 m h−1, whereby in the test series a) and b) only limestone test dust was used to prepare the dust cake, and in the test series c) and d) different amounts of salt aerosol particles were deposited in main dust cakes prepared with appropriate pressure loss. A standard humidification/dehumidification process was carried out for the test series b), c), and d) before regeneration, so that test series a) serves as a reference.
A comparison between the test series a) and b) proves that if a dust cake is only conditioned with water vapor, particle cohesion in the cake as well as adhesion between the cake and the filter medium are enhanced simultaneously and to a comparable degree, so that no clearly better regeneration results are obtained. With a focus on the size of cake fragments formed at regeneration or cake patches remaining on the filter area, considerably larger cake fragments are found in both test series c) and d) compared with the test series without salt particles, which is often advantageous for the dust cake discharge. At a closer look into the cleaned regions on the filter area, virtually no small remaining cake patches are found in both test series c) and d), which is also a sign of significantly increased particle cohesion in the dust cake.
Since the remaining cake patches in cases of dust cake with salt particles are found primarily on the border to the frame of the filter holder, it can be assumed that solid bridges are also formed at contacts of dust particles to the frame of the filter holder, which is one reason for the poor regeneration results with significantly higher standard deviation (STD) in the test series d) compared with other tests.
4 Comparison and Evaluation of Micro- and Macroscopic Investigations
The pressure loss curves are in good agreement with the expectations for changing the specific cake resistance due to the observed dust cake restructuring on the microscopic scale, caused by deliquescence and efflorescence of the fraction of salt particles. Fig. 9 illustrates the restructuring processes in the dust cake based on the microscopic observations and the resulting theories to provide an explanation of the pressure loss curve.

The first picture (Fig. 9a) illustrates a main dust cake with the primary dust particles. The second picture (Fig. 9b) shows the dust cake with subsequently deposited salt particles (black) between the primary dust particles (light gray). Fig. 9c demonstrates the changed structure of the dust cake due to the deliquescence of salt particles. There, initiated by the growing of liquid bridges, larger pores are formed in the dust cake. Over the entire thickness of the dust cake, the deliquescence of all salt particles is a gradual process, which begins with the salt particles on the top of the upstream side of the cake. For the gas flow, the deliquescence of some salt particles causes a corresponding decrease in gas humidity downstream in the direction of the flow, which is observed at the difference between upstream and downstream humidity values.
Upon drying, the liquid bridges in the region near the upstream side undergo a sudden efflorescence. This leads to the formation of microcracks and larger pores (Fig. 9d), which in turn results in a sudden drop in the pressure loss. Like the previous deliquescence, the efflorescence over the entire thickness of the dust cake is also a gradual process. In vertical direction and primarily in the deeper layer of the dust cake the gradual efflorescence process causes a slight compression of the dust cake (Fig. 9e), whereby the pressure loss slowly rises again.
In the sense of cake fragment sizes formed at the regeneration, the results of the regeneration are in good agreement with the expectations by the microscopical investigations, as well. The formation of larger patches indicates an increase in the particulate cohesion.
5 Comparison and Conclusion
On the microscopic scale, three inter-related phenomena could be demonstrated. First, liquid bridges, formed from salt solution, lead to relative particle movements between non-hygroscopic particles. Second, the efflorescence of saline solutions in contact with non-hygroscopic particles causes their caking. Third, a fraction of hygroscopic salt particles as part of a non-hygroscopic dust cake causes a restructuring of the particle layer toward larger pores induced by deliquescence and efflorescence of the salt particles.
On the macroscopic scale, a characteristic pressure loss course was found in all investigations. During the humidification an exponential decrease in the pressure loss occurs; in the following drying process, first a sudden drop followed by a slight increase in pressure loss can be observed. The formation of larger cake fragments during regeneration indicates an increase in the particulate cohesion. Regardless of the edge effects associated with the size of the rescaled test filters used for screening tests, it should be noted that deliquescence and efflorescence of hygroscopic salt particles in a dust cake can significantly influence and even improve the operating behavior of surface filters under the right circumstances.
Further investigations on this topic are still pending. Above all, the filtration and regeneration parameters, like particle size of test dust and salt particles, specific dust cake resistance, filter media, and tank overpressure for the regeneration will be varied to find out the right and critical circumstances for positive effects on the operating behavior of surface filters. In doing this, test series with standard test filters on the customized standard filter test apparatus will be carried out over a longer operating period with several filtration cycles to make conclusive comparisons.
Acknowledgements
Financial support by the German Science Foundation (DFG) for the project ZH 529/1-1 is gratefully acknowledged. Open access funding enabled and organized by Projekt DEAL.
The authors have declared no conflict of interest.
Abbreviations
-
- BSE
-
backscattered electrons
-
- DRH
-
deliquescence humidity
-
- EDX
-
energy-dispersive X-ray spectroscopy
-
- ERH
-
efflorescence humidity
-
- ESEM
-
environmental scanning electron microscope
-
- GAD
-
gaseous analytical detector
-
- RH
-
relative ambient humidity
-
- SEM
-
scanning electron microscopy
-
- STD
-
standard deviation


