Pool Evaporation – Experimental Data Collection and Modeling
Abstract
When handling flammable or toxic liquids or liquefied gases, the occurrence of a leakage and formation of a liquid pool is a scenario to be considered for risk assessment. Several models are available for estimating the evaporating mass flow, but only few experimental data exist for validation purposes. Evaporation experiments, with vapor pressures up to 0.94 bar and with different substances in basins of varying diameter, were carried out, mainly on open-air test sites with different topographies, but also in enclosed spaces. Based on these new data, a validation of existing pool evaporation models was carried out and eventually led to the new formulation of an evaporation model, which is also presented here.
1 Introduction
For the hazard assessment of liquid spills, the evaporating mass flow out of a liquid pool has to be considered. For this purpose, several empirical models are available, e.g., those developed by Sutton-Pasquill 1, Mackay and Matsugu 2, Clancey 3, and Brötz 4. Whilst nearly all models show a similar general formulation of the mass transfer coefficient, they differ mainly in the formulation of the pressure term. Some models show a logarithmic term and others a linear formulation. Besides differences in the formulation of the mass transfer coefficient, this pressure term leads to significantly differing results when calculating the evaporating mass flow of a pool with the different models. In order to evaluate and validate the results, experimental data are needed. As there are only few published data of evaporation experiments available, a series of more than 220 pool evaporation experiments was carried out in the last years at the Federal Institute for Materials Research and Testing (BAM; Berlin, Germany). The aim of these experiments was to provide a data set suitable for model validation.
The mass flow out of an evaporating pool is mainly dependent on the wind speed, the pool size, the vapor pressure (or liquid temperature), and other physical properties of the substance used. During the experiments, all parameters were varied by using pool sizes ranging from 0.5 to 1 m in diameter. Four different substances were investigated: ethanol, cyclohexane, acetone, and water. The tests were carried out in an enclosed space and on open-air test sites with two different topographies. The latter was done to investigate the postulation of Deutsch 5 who claimed that the different degrees of turbulence in the atmosphere in a built-up and a non-built-up environment would influence the evaporating mass flow. Nearly all tests were carried out for different temperatures, which were kept constant during the experiments. Some of the experiments investigated the cooling of the pool due to the evaporation.
These data sets were successfully used for the validation and comparison of different empirical evaporation models, showing that all models do not perform well when dealing with low wind speeds or high vapor pressures. To overcome this problem, the authors developed a new formulation for an evaporation model.
2 Experimental Setup
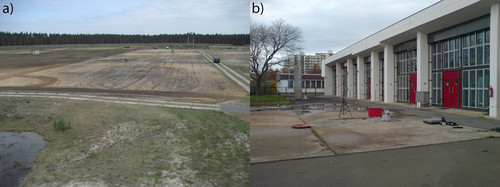
Evaporation experiments with ethanol and cyclohexane in three basins of 0.5, 0.74, and 1 m in diameter were carried out at the BAM 6. Three different terrain configurations were investigated: two open-air topographies (a non-built-up environment and a built-up environment; Fig. 1) and an enclosed space, located in a storage room to investigate the evaporation in the absence of wind. The open-air experiments in the non-built-up environment took place on the Test Site Technical Safety of the BAM (BAM TTS), on the explosion test ground consisting of a circular flat terrain without obstacles and with a diameter of 400 m. For the built-up environment, the BAM headquarters in Berlin were chosen, representing an inner-city topography, with buildings, roads, and vegetation. During those experiments, the range of lower vapor pressures up to 0.3 bar was covered with ethanol and cyclohexane as liquid substances.
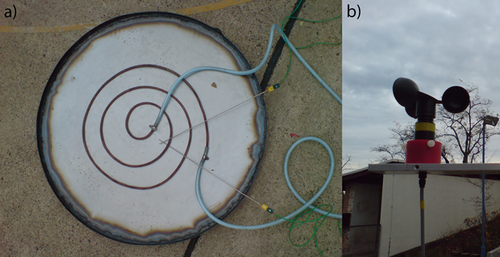
The basins were heated via a water-heated heating coil (Fig. 2), and the evaporating mass flow was determined by weighing the liquid content before and after the experiment in correlation to the duration of the experiment. The corresponding vapor pressure was calculated from the recorded liquid temperatures. Two K-type thermocouples were placed in the liquid, one near the interphase and one at the bottom of the basin (Fig. 2). The average of both temperatures was used as the liquid temperature. The ambient temperature was also recorded with a K-type thermocouple. For the open-air tests, the wind speed was measured with a cup vane anemometer in 2 m height above ground, and the wind speeds in 10 m height were provided by the German meteorological services (DWD) from a measuring station on the test site.
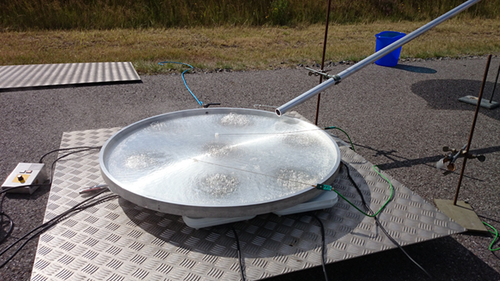
A second series of open-air evaporation experiments was carried out on the BAM TTS with the intention of reaching higher vapor pressures. Therefore, a basin of 0.88 m in diameter was used. This time, the pool was heated using seven radiator panels of 2 kW each (Fig. 3). In these experiments, acetone and water were used as liquids and maximum vapor pressures of 0.94 barabs were reached for acetone and 0.8 barabs for water. The measuring equipment was the same as for the previous test series. In addition, the relative humidity of the ambient air was recorded only for the experiments with water. This value is needed to correct the partial pressure as an input parameter to the evaporating models when computing the values for the water experiments.
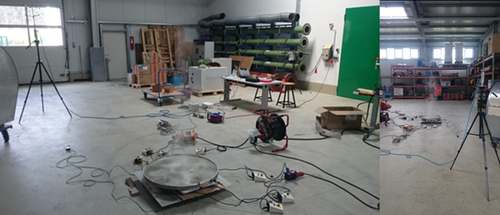
A third series of experiments was carried out in a storage room and a warehouse (L × W × H = 22 m × 12 m × 6.75 m; Fig. 4) to simulate a “no-wind” situation. The locations chosen were large enough to avoid saturation of the substance concentration during the experiments. Between all tests, the location was ventilated so that the initial concentration of evaporating substance in the ambient atmosphere for each test can be assumed to be zero.
3 Experimental Results
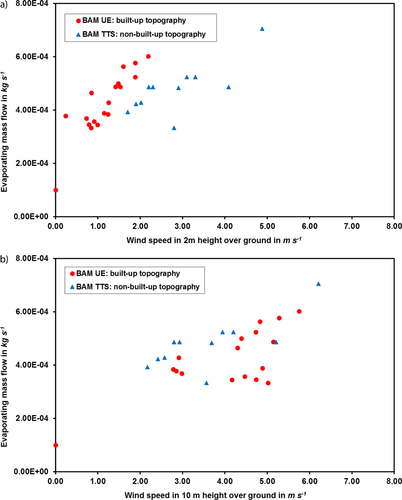
Besides providing experimental data of the mass flow rate for the ethanol and cyclohexane pools, the first test series with experiments in a built-up and a non-built-up environment showed a very interesting fact. It is postulated that a built-up environment will lead to a higher atmospheric turbulence, resulting in a higher evaporating mass flow due to the increased concentration gradient at the interphase. When the experimental results are plotted over the measured wind speeds in 2 m height (Fig. 5a shows the results for ethanol as a model case, but the observations are also valid for cyclohexane), the correctness of the postulate seems to be confirmed. The setup for the built-up area was chosen so that the pool is not located in a fetch zone, and the wind direction is more or less constant during one trial. Although the wind direction was not recorded, it was monitored during the experiments to make sure there is no “turning wind” that eventually prevents the gas cloud from moving away from the pool, leading to reduced mass transfer.
As for hazard assessment purposes, it is rarely the case that, on site, near-ground wind measurements are available; generally, the wind speed at 10 m height above ground, provided by meteorological services, is considered. In line with this, all pool evaporation models require the wind speed at 10 m height as an input parameter.
When the measured evaporating mass flows are now plotted over the corresponding wind speeds in 10 m height (Fig. 5b shows again the data for ethanol as a model case, but the observations are also valid for cyclohexane), the difference between the two topographies is not visible anymore for the investigated pool sizes of up to 1 m in diameter. As the wind speed is much less affected by the topography in 10 m height than close to the ground, the impact of the turbulence near the ground on the evaporation process cannot be represented. Nevertheless, it is the standard value to use. Not only that in most cases it is the only available value, but it is also the required parameter for the evaporation models. Therefore, all following results will be referred to the wind speed at 10 m height. As the turbulence of the wind field was not measured during the experiments, a closer correlation with the evaporating mass flow cannot be done.
Although it cannot be excluded that, for larger pool sizes, an influence of the topology-induced turbulence may influence the evaporating mass flow, as stated earlier, this has not been observed for the investigated pools up to 1 m in diameter. That is why the experimental series for higher vapor pressures were only carried out on the Test Site Technical Safety, corresponding to a non-built-up environment, as there is no difference to be expected compared to the built-up environment when using the wind speed at 10 m height.
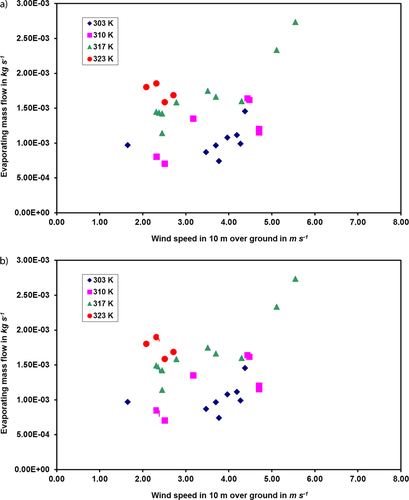
Due to the fact that the experiments are open-air ones, a graphical representation cannot be done easily. Besides the constant variations of the atmospheric conditions, especially the wind speed, the pool temperature was also varied for each substance. Only for ethanol and cyclohexane (due to the large number of data sets available) it was possible to find enough points for similar conditions to represent them in a diagram. Figs. 6a and b show the evaporating mass flow over the wind speed at 10 m height above ground of ethanol and cyclohexane, respectively, at different temperatures.
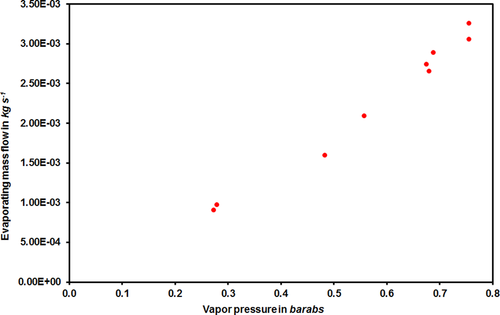
For water, it was possible to find enough points for the evaporating mass flow at a constant wind speed over the pool temperature (Fig. 7). For acetone (as can be seen in Supporting Information Tab. S1), not more than two or three points show comparable boundary conditions, so that no graphical representation is possible.
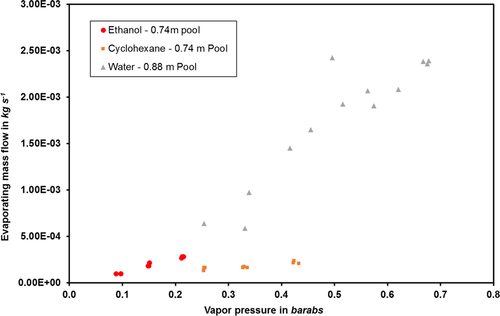
For the indoor experiments, a representation of the evaporating mass flow over the pool temperature for water, ethanol, and cyclohexane can be found in Fig. 8. It should be noted that, in this figure, the values for ethanol and cyclohexane are for a pool of 0.74 m in diameter and the values for water are for a 0.88-m pool. In addition, the water experiments were carried out in a larger enclosed space than those for ethanol and cyclohexane, leading to a higher air convection speed. Whilst the air speed was 0.04 m s−1 in the storage room where the ethanol and cyclohexane experiments took place, it was 0.1 m s−1 for the warehouse where the water experiments were carried out.
Even though not all data can be represented graphically, the integrality of all recorded data sets can be found in the tables given in the Supporting Information, which are described in the following.
Tab. S1 shows all experiments with a constant liquid temperature, whilst Tab. S2 shows all experiments where the heating was switched off during the experiment, so that the liquid cooled down due to evaporation. In Tab. S3, all experimental data are shown for the indoor experiments, in the absence of wind, with a constant liquid temperature during the experiments. Additional data from the experiments, like the time-dependent liquid temperature for the experiments from Tab. S2, is also available but a reproduction here does not seem purposeful. If required, please contact the authors.
4 New Formulation of an Evaporation Model
Based on this set of experimental data, a new evaporation model was developed. Existing models are not suitable for calculating the evaporating mass flow close to the boiling point, as well as for indoor/no-wind situations 7-9.
 (1)
(1) (2)
(2) (3)
(3)leading to either infinite (Eq. 2) or finite (Eq. 3) values of the evaporating mass flow near the boiling point.
The formulation of the mass transfer coefficient varies depending on the evaporation model chosen. Nevertheless, it is common to nearly all models that the mass transfer coefficient depends on the wind speed and the characteristic length. In earlier investigations 7, it was shown that empirical models cover a broad range of values, even in the low-vapor pressure region. It was also observed that the models of Mackay and Matsugu 2, with a logarithmic formulation of the pressure term, and the model of Clancey 3 can be seen as the upper and lower limit, respectively, of the mass flows calculated by evaporation models. The mass transfer coefficient in both models is given by:
 (4)
(4) (5)
(5) (6)
(6) (7)
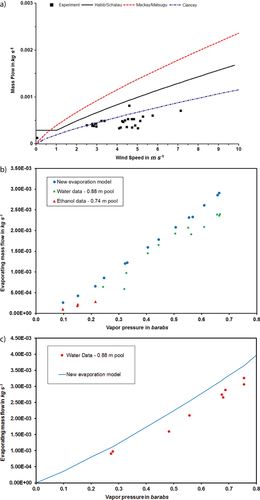
(7)With this model, a more accurate prediction of the evaporating mass flow is possible, compared to earlier existing evaporation models. Fig. 9a shows the performance of the model presented in this work compared to the Mackay/Matsugu and Clancey models for an ethanol pool of 0.74 m in diameter and a liquid temperature of 30 °C. Compared to the Mackay/Matsugu model, a better accuracy is reached. Compared to the model of Clancey, the values calculated by the new model are higher, but conservative. Especially for the low-wind/no-wind case, even though clearly overpredicting the mass flow, the results are conservative, whilst the other models predict unphysical mass flows of zero when there is no wind and seem to be underpredicting for wind speeds lower than 1 m s−1. In addition, the model also gives a good approximation of the evaporating mass flow for higher vapor pressures not only in the “no-wind” case (Fig. 9b) but also in the situation with wind (Fig. 9c).
5 Conclusions
In this paper, a full set of experimental data from over 200 experiments on evaporation from liquid pools is provided. The experiments cover a broad range of vapor pressures up to values close to the boiling point. The behavior of an evaporating indoor pool was also investigated and a set of data for a no-wind or low-wind situation is reported. Based on these experiments, it was found that previously existing evaporation models have a restricted range of applications limited to wind speeds higher than approximately 1 m s−1 and to low vapor pressures. Therefore, a new model was developed and presented which covers low-wind speed and high-vapor pressure cases.
The authors have declared no conflict of interest.
Symbols used
-
- A [m2]
-
area
-
- D [m2s−1]
-
diffusion coefficient
-
- d [m]
-
diameter
-
- L [m]
-
characteristic length
-
- M [kg mol−1]
-
molar mass
-
 [kg s−1]
 -
mass flow
-
- P* [–]
-
dimensionless pressure term
-
- pA [Pa]
-
partial pressure/vapor pressure of the substance
-
- Pa,∞ [Pa]
-
partial pressure of the substance in the atmosphere
-
- R [kg m2s−2mol−1K−1]
-
universal gas constant
-
- Sc [–]
-
Schmidt number
-
- TA [K]
-
temperature of the substance
-
- u [m s−1]
-
wind speed at 10 m height
Greek symbol
-
- β [m s−1]
-
mass transfer coefficient


