Differential responses to larger volume intra-aortic balloon counterpulsation: Hemodynamic and clinical outcomes
Funding information: Maquet Cardiovascular LLC.
Abstract
Objectives
Examine hemodynamic and clinical correlates of use of an intra-aortic balloon pump catheter in a single center.
Background
The intra-aortic balloon pump catheter (IABC) has been used for 50 years but the clinical benefit is still debated. We reviewed 76 patients with right heart catheter measurements prior to IABC to assess response and outcomes.
Methods
All patients who received IABC with a 50cc balloon for at least 1 hour were included in this retrospective chart review study. Demographics, comorbidities, lab values, and hemodynamic parameters were recorded at baseline and 15 h postinsertion.
Results
Seventy-six patients had paired measurements of cardiac output. 60 patients had a higher cardiac output with IABC treatment (responder group) and 16 did not (nonresponders). In the 60 patients in the responder group, cardiac output and index significantly increased from baseline 3.6 ± 1.3 L/min to 5.2 ± 1.8 L/min, and 1.8 ± 0.5 L/min/m2 to 2.6 ± 0.8 L/min/m2 respectively following IABC placement (P < 0.0001 for both comparisons). Various hemodynamic variables were examined and the best predictor of response to IABC was a cardiac power index of 0.3 or less. Regardless of response, in hospital survival was similar between groups.
Conclusions
The majority of patients improve their cardiac output with IABC but survival was unchanged. Further work into the pathophysiology of cardiogenic shock is needed.
1 INTRODUCTION
Recently, we reported a single center series of patients undergoing hemodynamic support with a 50 cc intra-aortic balloon pump catheter (MEGA 50, Maquet). A total of 150 patients were studied and the outcomes including complications were described in detail 1. A subset (76 patients) had a right heart catheter placed at the time of IABC insertion as well as follow-up hemodynamics and this analysis focuses on these patients. In particular, the goal was to identify predictors of significant improvement in cardiac output following IAB therapy to guide the clinician when deciding what initial support device to use or when to escalate mechanical circulatory support (MCS) therapy. The current report reflects a subset of the patients described in the prior manuscript who had a pulmonary artery catheter prior to IABC therapy.
2 METHODS
2.1 Patient characteristics
All patients who received IABC with a 50cc balloon for at least 1 hour were included in this study. Exclusion criteria were exchange of a 40cc for a 50cc IAB, lack of a Swan-Ganz catheter at the time of IABC placement and follow-up. Patients receiving a second 50cc IAB as a catheter exchange were not double counted. Variables collected included: Demographic and procedural variables: age, height, weight, sex, body mass index, body surface area, race, date of insertion, duration of insertion, location of insertion, primary indication for insertion, arteriotomy site. Clinical risk factors: systemic hypertension, diabetes, smoking status, prior CAD/MI/CABG, peripheral vascular disease, and prior stroke/TIA. Laboratory measurements: hemoglobin (Hgb), hematocrit, platelet count, serum sodium, and creatinine. Hemodynamic parameters: SBP/DBP, heart rate/rhythm, augmented DBP, RA, PASP, PADP, PCWP, CO/CI, and mixed venous O2 saturations. Cardiac output was measured by thermodilution method, typically by a continuous cardiac output monitoring catheter system. Vasoactive infusions: Precise dosing data was not robust given frequent titration in the intensive care unit and in our electronic medical record for but the use of inotropic agents or vasoconstrictors was captured and tabulated. The laboratory and hemodynamic data collected were grouped into the following time intervals: Time point A = Pre-IABC initiation and Time point B = ≥15–<40 h post insertion. Fifteen hours was chosen since this would include the escalation of therapies for patients who didn't sufficiently improve on IABC therapy.
Maquet provided research funding for the conduct of the study. The study protocol was reviewed and approved by the hospital Institutional Review Board.
2.2 Definitions
All definitions were prespecified and agreed upon prior to chart reviews. Cardiogenic shock was defined as a) persistent hypotension [SBP ≤90 mm Hg, or MAP 30 mm Hg lower than baseline], and b) reduction in CI ≤1.8 L/min/m2 without inotropic support, or <2.2 L/min/m2 with inotropic support, and c) adequate filling pressure [LVEDP ≥18 mm Hg or RVEDP >10 mm Hg] 6. Sustained hypotension precipitated by either AMI, and/or sudden coronary vessel closure during PCI was also listed under CS. Cardiac power output is defined as (MAP multiplied by CO)/451. Cardiac power index is defined as (MAP multiplied by CI)/451.
The group was divided based on the arithmetic difference (delta) between the cardiac output at time points A and B. Patients with any increase in cardiac output between baseline and the first measurement of cardiac output were counted in the “responder” group and those whose cardiac output did not change or declined were counted as “nonresponders.”
3 RESULTS
Seventy-six patients had a right heart catheter placed for hemodynamic assessment and were treated with IABC therapy. Seventy-four patients had data on inotrope and vasoconstrictor medications available. The baseline characteristics are in Table 1. Seventy-six patients had paired measurements of cardiac output. Sixty patients had a higher cardiac output with IABC treatment (responder group) and 16 did not (nonresponders). In the 60 patients in the responder group, cardiac output and index significantly increased from baseline 3.6 ± 1.3 L/min to 5.2 ± 1.8 L/min, and 1.8 ± 0.5 L/min/m2 to 2.6 ± 0.8 L/min/m2, respectively, following IABC placement (P <0.0001 for both comparisons).
| Variable (mean +/- SD) | Result |
|---|---|
| Age (years.) | 55.6 ± 13.2 |
| Age > 75 | 1 (1%) |
| Height (cms) | 173.5 ± 9.0 |
| Weight (kg) | 87.0 ± 20.8 |
| BMI (kg/m2) | 28.9 ± 6.4 |
| BSA | 2.00 ± 0.3 |
| Male sex | 61 (80.2%) |
| Hypertension | 47 (61.8%) |
| Diabetes | 33 (43.4%) |
| Smoking status (active/past) | |
| • Active smoker | 6 (0.8%) |
| • Past smoker | 46 (60.5%) |
|
Coronary artery disease/MI H/o of prior CABG |
23 (30.0%) 11 (14.5%) |
| H/o stroke/TIA | 10 (13.2%) |
| H/o of PAD | 1 (0.01%) |
| Ischemic cardiomyopathy | 33 (43.4%) |
| Serum sodium [n=122] | 137.0 (133 – 140) |
| Creatinine b [n=137] | 1.32 (0.98 – 1.90) |
| Intermittent hemodialysis [n=148] | 11 (7.4%) |
| LVEF (%) | 20.2 (15.0 - 30.2) |
| Duration of insertion (h) [n=144] | 92.5 (46.5 – 144.8) |
| Length of hospital stay (days) [n=149] | 22.5 (12.0 – 43.0) |
| Race | |
| • Caucasian | 32 (42%) |
| • African American | 31 (41%) |
| • Hispanic/Asian/Other | 13 (17%) |
| Location of Insertion | |
| • Cath lab | 62 (82%) |
| • CICU/Other | 14 (18%) |
| Inotropic infusion | 73% |
| Vasoconstrictor infusion | 20.2% |
- Data represented as Mean ± Standard deviation or No. (%).
- BMI, body mass index; BSA, body surface area; MI, myocardial infarction; CABG, coronary artery bypass grafting; TIA, transient ischemic attack; PAD, peripheral arterial disease; LVEF, left ventricular ejection fraction; CICU, Cardiac intensive care unit.
In the 16 patients in the nonresponder group, cardiac output and index significantly decreased from baseline 4.4 ± 0.9 L/min to 3.6 ± 0.8 L/min and 2.2 ± 0.4 L/min/m2 to 1.9 ± 0.4 L/min/m2 following IABC placement (P <0.0001 for both comparisons).
Figure 1 (panel A) shows the mean change in cardiac output between the responder and nonresponder groups. The 16 patients who did not respond had a drop in mean cardiac output of 0.8 ± 0.6 L/min versus the 1.6 ± 1.1 L/min increase in the responder group (60 patients), P < 0.0001. Panel B shows the individual cases and illustrates that the decreases in cardiac output tended to be modest in the nonresponders but the degree of improvement tended to be substantial in the responder majority. Panel C illustrates the baseline cardiac output versus the change in cardiac output with IABC therapy. The line of regression is delta CI = 1.2140864–0.3536077* Baseline CI. The R2 was 0.07 (P = 0.02).
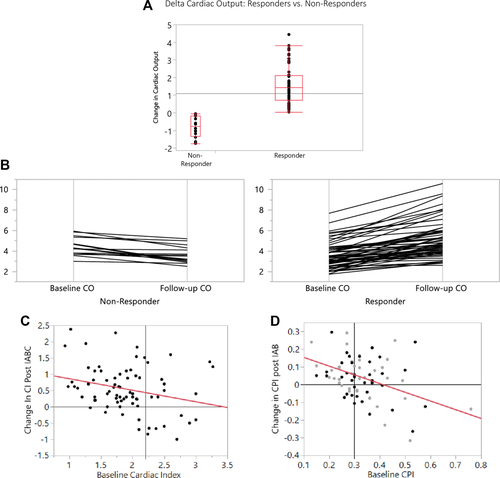
Panel A: The change in cardiac output between baseline and timepoint A is illustrated with medians and intraquartile ranges graphically illustrated (for both the “responders” and “nonresponders”). Panel B: A parallel plot illustrating the change in cardiac output between baseline and timepoint A showing a line for each patient (for both the “responders” and “nonresponders”). Panel C: A scatterplot illustrating the relationship between baseline cardiac index and the cardiac index post- IABC treatment. The vertical line is at 2.2 L/min/M2, which is a definition of cardiogenic shock. Panel D: A scatterplot illustrating the relationship between baseline cardiac power index and the cardiac power index post- IABC treatment. The vertical line is at 2.2 L/min/M2, which is a definition of cardiogenic shock
Panel D shows the cardiac power index (CPI) on the x-axis and the change in CPI following IABC therapy. For this figure, patients were divided into those who were “bridged” (to transplant, or escalation to VAD) and those who were not bridged (either recovered, or IABC unable to be weaned). The “bridge” patients were excluded from the linear regression analysis but the data points are shown in light gray. The nonbridge patients are depicted by the dark circles and linear regression is performed on that data set. The regression equation is delta CPI = 0.2027156–0.492432 * Baseline CPI
The R2 was 0.21 (P = 0.0034). The majority of the patients with a CPI of 0.3 or less demonstrate improvement in CPI following IABC therapy. However, the response of patients with CPI > 0.3 is widely varied with equal numbers improving or deteriorating as assessed by follow-up CPI. In addition, the same variability is seen for patients bridged (transplant or VAD) and those who were not bridged.
3.1 Outcome of IAB support
In 37 patients (49% of the total), the balloon pump served as a “bridge” to a higher level of support. Ten patients waited for orthotopic heart transplantation on IABC support (13%) and 27 patients (36%) were escalated to a ventricular assist device such as Impella or a HeartMate II durable ventricular assist device. The remaining patients did not undergo escalation of support. 24 patients (32%) improved sufficiently to allow removal of the IABC without further circulatory support and 15 patients (20%) could not be weaned from support. Figure 2 shows that the outcome of those patients with escalation of care was significantly better than the selected patients that did not have such treatment. All patients who were successfully weaned from the IABC were discharged alive, along with all the patients bridged to transplant.
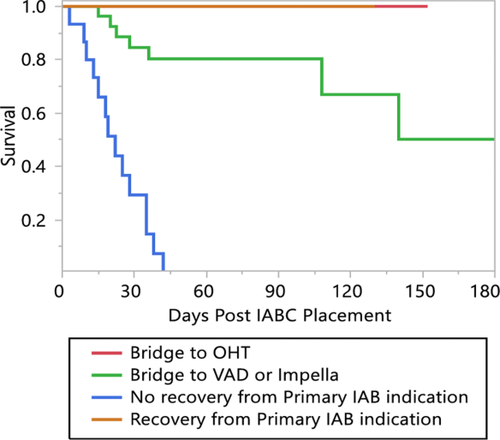
Kaplan-Meier plot of survival following IABC placement, separated according to treatment (bridge to transplant, bridge to recovery, bridge to mechanical circulatory support or no escalation). The patients who were bridged to durable mechanical circulatory support or heart transplant had 100% survival over the period of observation
The survival was lower for patients transitioned to a VAD (30-day in-hospital survival 84.6%, 90 days 80.3%, P <0.0001). Patients who were neither escalated to advanced therapies nor recovered sufficiently to allow planned IABC removal had the prognosis expected of terminal patients with all dying by 42 days, and a 30-day in-hospital survival of 29%.
3.2 Hemodynamic and clinical correlation to responder status
Table 2 shows the comparison of patients based on responder or nonresponder status. Responders were significantly younger but no different in weight, height, gender, blood pressure, heart rate, or left ventricular ejection fraction. Greater than 70% of patients in both groups were on inotropic therapy prior to IABC placement. A small but significant minority were on intravenous vasoconstrictor treatment. Norepinephrine was uncommonly utilized (3 patients) and none of these 3 responded to IABC. This was a statistically significant but not clinically significant difference. Post IABC placement, the number of intravenous infusions increased in the responders by a median of 1 (intraquartile range 0–1) versus nonresponders, median no change (intraquartile range 0–1), P = 0.06.
| Factor | Nonresponder | Responder | P value |
|---|---|---|---|
| Age (Years) | 60.4 ± 9.2 | 54.4 ± 13.8 | 0.048 |
| Height (cm) | 172.2 ± 7 | 173.8 ± 9.4 | 0.44 |
| Weight (kg) | 79.2 ± 21.3 | 89.1 ± 20.4 | 0.11 |
| BMI | 26.7 ± 6.7 | 29.5 ± 6.3 | 0.15 |
| BSA | 1.9 ± 0.3 | 2.1 ± 0.3 | 0.1 |
| Gender Male | 87.5% | 78.3% | 0.39 |
| Left Ventricular Ejection Fraction | 20.3 ± 14.1 | 19 ± 9.2 | 0.74 |
| Duration of Insertion (hours) | 124.4 ± 65.1 | 129.3 ± 87.4 | 0.81 |
| Length of Hospitalization | 40.7 ± 30.6 | 51.4 ± 47.1 | 0.28 |
| Systolic BP | 105.7 ± 19.5 | 102.4 ± 15.7 | 0.53 |
| Diastolic BP | 62.4 ± 13.4 | 67.2 ± 12.9 | 0.21 |
| Heart Rate | 90.2 ± 16.1 | 97 ± 22.9 | 0.19 |
| Milrinone | 81.2% | 65.5% | 0.21 |
| Dobutamine | 43.8% | 43.1% | 0.96 |
| Vasopressin | 25% | 12.1% | 0.22 |
| Norepinephrine | 18.8% | None | 0.002 |
| Epinephrine | 6.25% | None | 0.08 |
| Dopamine | None | 3.4% | 0.32 |
| Phenylephrine | 6.2% | 1.7% | 0.37 |
| Any Inotrope? | 81.2% | 70.7% | 0.39 |
| Any vasoconstrictor | 31.2% | 17.2% | 0.23 |
| Right Atrial Pressure | 9.7 ± 5.8 | 17.0 ± 8.4 | 0.0003 |
| Right Ventricular Systolic Pressure | 52.6 ± 13.2 | 54.9 ± 14.5 | 0.63 |
| Right Ventricular Diastolic Pressure | 11 ± 5.8 | 14 ± 7 | 0.18 |
| Pulmonary Artery Systolic Pressure | 47.8 ± 16 | 54.5 ± 15.2 | 0.14 |
| Pulmonary Artery Diastolic Pressure | 23.6 ± 9.4 | 29.1 ± 8.5 | 0.048 |
| Pulmonary Artery Mean Pressure | 31.7 ± 10.9 | 37.6 ± 10.1 | 0.06 |
| Pulmonary Capillary Wedge Pressure | 26 ± 8.2 | 31.4 ± 8.9 | 0.08 |
| Cardiac Output | 4.4 ± 0.9 | 3.6 ± 1.3 | 0.0052 |
| Cardiac Index | 2.2 ± 0.4 | 1.8 ± 0.5 | 0.0022 |
| Pulmonary Artery Saturation | 61.2 ± 9.2 | 48.5 ± 12.4 | 0.0004 |
| Cardiac Power Output | 0.76 ± 0.24 | 0.63 ± 0.24 | 0.06 |
| Cardiac Power Indexed | 0.39 ± 0.1 | 0.30 ± 0.1 | 0.0024 |
| Hemoglobin | 11.5 ± 2.5 | 11.4 ± 2.2 | 0.92 |
| Hematocrit | 35 ± 7.9 | 34.6 ± 6.4 | 0.86 |
| Platelet count | 205.7 ± 102 | 205.6 ± 74.5 | 0.94 |
| Serum sodium | 136.2 ± 4.8 | 133.8 ± 5.6 | 0.09 |
| Serum creatinine | 1.73 ± 1 | 1.6 ± 1 | 0.79 |
| AST | 97.2 ± 172 | 54.9 ± 94 | 0.43 |
| ALT | 61.5 ± 90 | 74.5 ± 152.4 | 0.73 |
| Alkaline Phosphatase | 99.1 ± 38 | 155.4 ± 215.6 | 0.11 |
| Total Bilirubin | 1.1 ± 0.75 | 1.3 ± 0.77 | 0.55 |
| Prothrombin Time | 21.2 ± 17.6 | 17.8 ± 8.7 | 0.5 |
| International Normalized Ratio | 1.9 ± 1.7 | 1.6 ± 0.7 | 0.46 |
| Partial Thromboplastin time | 48.1 ± 20 | 45.9 ± 19.6 | 0.71 |
The definition of a “responder” was a patient with any improvement in cardiac output (even 0.01 L/min). Recognizing that tiny improvements are not clinically relevant, we analyzed by different cutoff values as well. Fifty-one of sixty (85%) of responder patients had at least a 0.5 L/min increase in cardiac output. Thirty-nine out of sixty (65%) had a 1 L or greater increase and 19/60 (31.7%) of patients had an increase of at least 2 L/min in cardiac output following IABC. The length of time of support was similar between responders and nonresponders with all patients having a catheter for at least 6 h.
The invasive hemodynamic parameters demonstrated that responders had significantly higher right atrial and pulmonary artery diastolic pressure, while right ventricular and pulmonary artery systolic pressures were not different between groups. There was a nonsignificant trend towards higher pulmonary capillary wedge pressure in the responder patients (likely due to incomplete data on wedge pressure as compared to pulmonary artery diastolic pressure).
The baseline cardiac output, cardiac index and pulmonary artery saturation were significantly lower in responders. Time point A cardiac index in responders was 1.8 ± 0.5 L/min/M2 as compared to 2.2 ±0.4 L/min/M2 in nonresponders.
Baseline Cardiac power output (CPO) tended to be lower in responders (P = 0.06) with a mean CPO of 0.63 ±0.2 versus 0.76 ± 0.2 in nonresponders. Baseline Cardiac power indexed was significantly lower in responders, however (mean CPI 0.30 ± 0.1 in the responder group vs. 0.39 ± 0.1 in the nonresponder group, P = 0.0024).
The augmented diastolic pressure was statistically different between groups with a high degree of significance (P = 0.009). The responders had a diastolic pressure increase of 37.7 ± 16.7 as compared to nonresponders whose diastolic pressure increased mean 50.6 ± 16.1 mm Hg. This suggests a much higher degree of irreversible peripheral vasoconstriction in the nonresponder group.
Figure 3 shows the distribution of outcomes based on responder status. Of 24 patients weaned from IABC without escalation of therapy, 21 (87.5%) were hemodynamic responders (cardiac output improved). However, 12 (80%) of those who were judged terminal and not weanable from IABC were also responders. 21 (77.8%) of patients escalated to VAD therapy were responders and 6 (60%) of patients ultimately bridged to transplantation were not classified as responders to IABC, at least at the first time point studied.
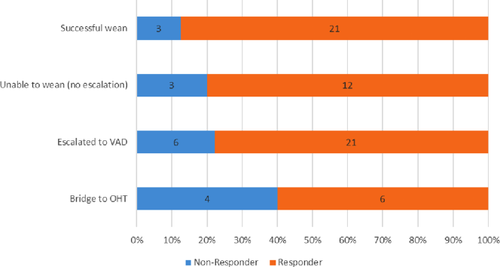
Bar graph illustrating the percentage of patients who transitioned to higher levels of support, recovered or were not transitioned from IABC therapy
3.3 Laboratory values
We examined multiple lab values and none correlated with response to IAB therapy. These variables included hemoglobin/hematocrit, serum creatinine, serum liver function tests including AST, ALT, alkaline phosphatase, and total bilirubin. Indices of anticoagulation such as prothrombin time and partial thromboplastin time did not differ significantly between groups either. Lactate levels were not routinely checked.
3.4 Survival analyses
In this study, data was only collected during the index hospitalization but not following discharge. The overall survival was 96% at 10 days postprocedure and 77.4% at 30 days and 67.2% at 60 days. Fifteen patients died in the hospital (19.7%), 6 were discharged to hospice (7.9%) and 55 (72%) survived the hospital stay.
Next, we looked at survival in responders versus nonresponders. There was no difference in survival between groups over 90 days (Figure 4). Classifying responders as those whose cardiac output increased a minimum 0.5 L/min cardiac output, 1 L/min or more, and 2 L or more did not change this conclusion (survival was similar in all comparisons). Similarly, for the 21% who had a decline in cardiac output following IAB therapy, survival was similar. None of the female patients (n = 15) in this study died and therefore the improved survival was statistically significant when compared the male patients (P = 0.02).
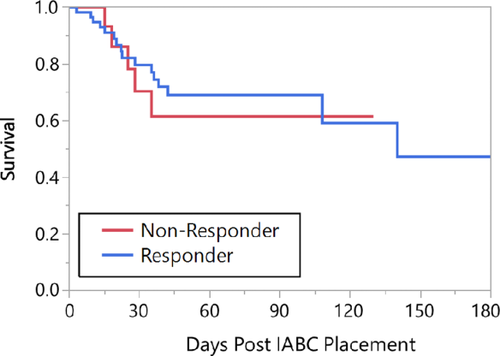
Kaplan-Meier plot of survival divided based on “responder”/“nonresponder” status
The indication for IAB placement was divided into cardiogenic shock and noncardiogenic shock. Eighteen patients had an IAB placed for reasons other than cardiogenic shock and only one died. This is illustrated in Figure 5. The trend was for worse survival in the cardiogenic shock group which is not particularly surprising (P = 0.07).
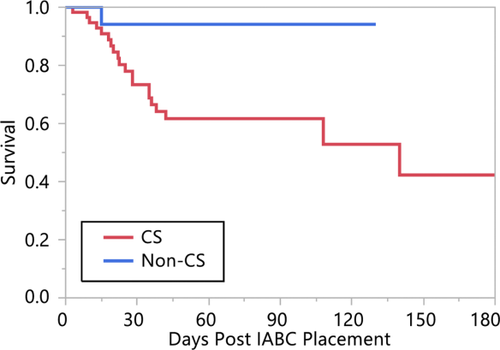
Kaplan-Meier plot of survival divided based on whether the IABC was placed for a diagnosis of cardiogenic shock or not
Next, Kaplan-Meier plots of survival were constructed to examine the effect of various factors on survival. Race (black vs. nonblack), presence of hypertension, diabetes mellitus, age (divided at 75 years old) all showed no difference. All female patients in this study lived, and thus there was a significant difference as compared to male patients. Neither lab values (sodium < 136, total bilirubin ≤ 1.1) nor hemodynamics (RA ≤ 15, PA diastolic pressure ≤ 28, cardiac power output ≤ 0.7 or ≤ 0.6, cardiac power indexed ≤ 0.3) were associated with any difference in survival.
4 DISCUSSION
This study evaluated the outcomes of 76 patients in a single tertiary medical center undergoing placement of the larger MEGA 50 cc IAB catheter for the treatment of their condition. There are two principal findings of this manuscript. First, is the observation that there is a bimodal response to IABC therapy with some patients “responding” with improved cardiac output and some with no improvement or actually decrements in cardiac output. Second, it was shown that “responders” with increased cardiac output following IABC did not have a different in hospital survival as compared to “nonresponders”.
The first finding of this study is that the majority of patients (60/76, 79%) have an improvement in cardiac output/index following IABC placement. In particular, the patients who have the most significant response to IABC are those with the lowest cardiac output, and cardiac power index along with elevated right atrial and pulmonary artery diastolic pressures. In addition, the magnitude of the response is higher than that previously reported with smaller size IABC catheters. The mean increase in cardiac output with the MEGA 50 IABC was 1.6 ± 1.1 L/min which is in sharp contrast to the drop of 0.8 ± 0.6 L/min for the 11% of patients who did not respond.
Given the disparity of responses, this may explain the previous impression that the average increase in cardiac output with IABC therapy is 0.5 L/min 2, 3. The mean change is cardiac output for all 76 patients in this study was 1.1 ± 1.4 L/min. The standard deviation is quite wide, consistent with the disparate populations of responders and nonresponders. It is also noteworthy that this study did not compare 40 cc catheters with the 50 cc device and therefore it uncertain whether the improved results in this study are attributable to the larger catheter or not.
Surprisingly, the demographics including age, comorbidities, type of cardiomyopathy and left ventricular ejection fraction did not predict response to IABC therapy. The most potent predictor of improved hemodynamic response was the baseline cardiac power index. Other significant correlates include low cardiac output/index, as well as high right atrial pressure and pulmonary artery diastolic pressure.
Cardiac power and cardiac power index have been studied in other settings and found to be useful predictors of outcome 4-6. Based on the current analysis, we recommend obtaining cardiac index and calculating CPI in cases where the potential benefit of IABC therapy is in question. If a patient's CPI is higher than 0.3, the likelihood of response to IABC is less predictable, particularly if the cardiac index is relatively preserved (above 2.0–2.2 L/min/M2) The clinician needs to factor in the possibility that IAB placement may not lead to a significant improvement in cardiac output in such cases.
The other major finding of this study is that simply improving the cardiac output does not correlate with ultimate outcome. One of the difficulties with studying cardiogenic shock is that it is a complex syndrome and reduced cardiac output is just one of the components of the syndrome. For this reason, devices such as the Tandem Heart left atrial to femoral artery bypass pump and the Impella (2.5 or CP) have not convincingly improved clinical outcomes in cardiogenic shock either above and beyond IABC 7-10. This dissociation between hemodynamic improvement and survival challenges our understanding of cardiogenic shock.
If cardiogenic shock survival was solely related to the restoration of adequate cardiac output, then the newer generations of increasingly capable mechanical circulatory support pumps would have resulted in incremental improvements in outcomes. Indeed, even the use of venoarterial extracorporeal membrane oxygenation (compact form of cardiopulmonary bypass) has not significantly changed the approximately 40–50% short term mortality of this devastating condition 11-13.
It has long been recognized that cardiogenic shock starts with an insult and then proceeds in a cascading pathway which may be difficult to interrupt 14. The importance of nitric oxide overproduction in cases of inappropriate vasodilatation was recognized and led to the use of a nitric oxide synthase inhibitor in 3 trials of cardiogenic shock with a patent infarct related artery. Despite promising early results 15, subsequent randomized controlled studies failed to demonstrate a mortality benefit 16, 17. A number of cytokines are involved in the cascade of inflammation that accompanies severe cardiogenic shock, and it is likely that there are shared characteristics between cardiogenic and septic shock 18-24.
This study along with the prior work on the 50 cc IAB 1 catheter provide an evidence base for rational use of the IABC when managing cardiogenic shock. In our center, the institutional practice has been to utilize an IABC as the first line of percutaneous mechanical circulatory support for patients failing inotropic support who do not have an obvious need for higher levels of support such as extracorporeal membrane oxygenation. The typical indications to bypass a trial of IABC in our center would be refractory cardiac arrest, severe cardiogenic shock with impending circulatory collapse or severe oxygenation deficits. The advantages of an IABC are ease of insertion (8 French catheter, insertion with or without fluoroscopy), cost (approx. $600), and the ability to convert the access into a sheath if support is not sufficient (via a wire exchange via the central blood lumen). The disadvantage is limited degree of support (although 1.6 Liter/min noted in this study for responder patients is larger than previously quoted 25. This work is complementary to other studies in different settings such as IAB SHOCK-2 which failed to demonstrate a survival advantage with IAB therapy (using a 40 cc IAB platform and a postinfarct setting) 10, 26.
Another useful role for the IAB is as a bridge to decision. Given the relatively low cost and ease of insertion, IABC placement is an ideal initial treatment strategy, particularly if CPI is low (≤ 0.3) since the current study suggests that an improvement in cardiac output can be expected. In addition, in cases where the ultimate treatment is unclear (unconscious patients, or elderly patients where a large caliber device may be difficult to place, or patients who may not be a candidate for escalation to more advanced therapies), the IAB represents a good first strategy.
5 LIMITATIONS
This is a retrospective review of data and therefore not all patients had hemodynamic data which was complete. For this reason, we only have mortality data during the hospitalization and had to censor observations at the time of discharge. This is in comparison to other prospective device studies which have uniform determination of outcomes at 1 month and beyond. We did not have lactate levels as an objective indicator of hypoperfusion and resolution.
6 CONCLUSIONS
The 50 cc IABC is associated with a significant improvement in cardiac output in selected patients. Predictors of significant improvement in cardiac output include low cardiac output and cardiac power index, with the mean improvement of 1.6 L/min. On the other hand, patients with relatively normal cardiac output (above 2 L/min) may experience decrements in the cardiac output and may not benefit with IAB placement. Regardless of improvement of cardiac output, survival was not reliably associated with any hemodynamic or laboratory variable, highlighting the difficulty of managing patients in cardiogenic shock. Further work into the pathophysiology of this complex syndrome is needed.
ORCID
David A. Baran, MD, FSCAI http://orcid.org/0000-0002-7754-9953
Gautam K. Visveswaran, MD http://orcid.org/0000-0003-0891-8468


