ZNF655 promotes the progression of hepatocellular carcinoma through PSMB8
Abstract
Hepatocellular carcinoma (HCC) is a type of liver cancer that is associated with high mortality rates. This study aims to investigate the role of ZNF655, a member of the zinc finger protein family, in the development of HCC. Immunohistochemical staining analysis was conducted to evaluate the expression of ZNF655 in HCC patient samples. Lentivirus-mediated ZNF655 knockdown was established in HCC cell lines (BEL-7402 and HCCLM3). The effects of ZNF655 on different aspects of HCC cell behavior such as proliferation, apoptosis, cycle, migration and tumor formation were examined. Downstream targets of ZNF655 in HCC were identified and verified through loss/gain-of-function experiments. Clinically, ZNF655 expression was elevated in HCC and increased with the severity of the disease. Functionally, inhibition of ZNF655 expression reduced the progression of HCC cells by decreasing proliferation, causing apoptosis, arresting cell cycle retention in G2, suppressing migration, and attenuating tumor formation in mice. Mechanistically, the proteasome subunit beta type-8 (PSMB8) was found to be co-expressed with ZNF655 in HCC, and PSMB8 knockdown weakened the promotion of ZNF655 overexpression on HCC. In summary, these findings suggest that ZNF655 promotes the progression of HCC through PSMB8, and inhibition of its expression may be a promising therapeutic target for HCC.
1 INTRODUCTION
Hepatocellular carcinoma (HCC) is a primary liver cancer and one of the most common malignant tumors with a high mortality rate (Forner et al., 2018). According to a recent study, there are 780,000 cases of HCC each year (Costentin, 2017). Major risk factors for HCC include infections from the hepatitis B and C viruses, alcohol consumption, and metastasis from other types of cancer such as colon cancer (Forner et al., 2018). Quite a few HCC patients are diagnosed only when their condition has already worsened. Surgical resection or liver transplantation is only feasible for about one-third of HCC patients (Menahem et al., 2017). In recent years, researchers have studied the molecular mechanisms of HCC and developed molecularly targeted drugs like Sorafenib and Sunitinib, which have been approved for clinical use. However, these drugs have only modestly improved overall survival in HCC patients (Cheng et al., 2013; Chuma et al., 2015). Thus, there is an urgent need to identify novel and effective molecular targets for HCC.
Zinc finger protein family (ZNF), a typical transcription factor, exists widely in the human DNA binding domain (Pieler & Bellefroid, 1994). The Cys2/His2 type (C2H2-type) is one of the largest families of ZNF with members having repetitive zinc finger motifs and coordinated zinc ions (Klug & Schwabe, 1995). A large amount of evidence shows that the protein is a transcriptional regulator with DNA-binding nature in many physiological processes, as well as an effective RNA-binding protein (Hastie, 2001; Honda & Roeder, 1980). This family is correlated with important processes such as correlated with embryonic development, cell differentiation, and hematopoiesis (Bieker, 2001). Over the past few decades, accumulating evidence has been shed on the potential role of ZNF in cancer progression (Ye et al., 2019). ZNF703 has been found to have an oncogene effect in breast cancer (Marzbany et al., 2019). Additionally, reduced expression of ZNF233 in HCC inhibits cell proliferation and tumorigenesis (Xie et al., 2018). In contrast, ZNF554 is regarded as a potential tumor suppressor in malignant gliomas, and its reduced expression may lead to the loss of oncogene suppression and the activation of tumor pathways (Balogh et al., 2020). Moreover, ZNF655, discovered from yeast and also known as Vav-interacting Kruppel-like protein-1 (Vik-1), belongs to the C2H2-type ZNF (Houlard et al., 2005). Recently, the role of ZNF655 in cancer has been reported. For example, ZNF655 knockdown inhibited the malignant phenotypes of on-small cell lung cancer and had been shown to be associated with progression of the disease (Teng et al., 2021). Additionally, ZNF655 accelerates the progression of pancreatic cancer by promoting the binding of E2F1 and CDK1 (Shao et al., 2022). ZNF655 also promotes glioma progression at the transcriptional level by directly binding to AURKA (X. Chen et al., 2022). Given the above evidence, the role and clinical value of ZNF655 in HCC have aroused our interest.
In this study, we have identified the expression of ZNF655 in HCC tissues. Furthermore, we have characterized the role of ZNF655 in HCC both in vivo and in vitro. Additionally, we have explored the potential downstream mechanism of ZNF655 in regulating HCC. Our findings suggest that inhibiting the expression of ZNF655 can impede the malignant progression of HCC and therefore it may serve as a potential molecular drug target.
2 MATERIALS AND METHODS
2.1 Tissue microarray and immunohistochemical (IHC) staining
The study protocol was approved by Fudan University. Formalin-fixed, paraffin-embedded (FFPE) tissue microarrays (obtained from Shanghai Xin Xing Biotechnology Co., Ltd.) were used, consisting of tumor tissues (n = 78) and adjacent normal tissues (n = 80) from patients with hepatocellular carcinoma (HCC) who underwent liver resection. The tissue microarray sections were dewaxed using xylene for 15 min, hydrated in 100% ethanol for 10 min and then treated with phosphate-buffered saline (PBS)-H2O2 containing 0.1% Tween 20 for 20 min. The sections were then washed three times with PBS and exposed to 25% trypsin for 10 min. After washing was completed, sections were incubated with primary antibody (anti-ZNF655, 1:200, Invitrogen, Cat. # PA5-56183) overnight at 4°C, followed by the secondary antibody IgG (1:400, Cat. # ab6721, Abcam) for 2 h at room temperature. The sections were initially stained with 3ʹ-diaminobenzidine, followed by counterstaining with hematoxylin for visualization. The photomicroscope was used to capture images, and the German Immunoreactivity Score was employed to assess the results (Jurmeister et al., 2019). The staining intensity and degree scores were combined to determine a sum, and staining intensity was categorized into negative (below the median) and positive (above the median), ranging from weak to strong. High expression of ZNF655 was defined as values higher than the median, while low expression of ZNF655 was defined as values lower than the median.
2.2 Cell lines and culture condition
Human normal liver cells (HL-7702) and HCC cell lines (BEL-7402, HCCLM3, and huh-7) were obtained from the Cell Bank of the Chinese Academy of Sciences on August 24, 2019. All the cells were incubated in Dulbecco's Modified Eagle Medium (DMEM, GibcoBRL) supplemented with 10% fetal bovine serum (FBS, Gibco BRL) at 37°C under an atmosphere containing 5% CO2. Notably, authentication of these cells was tested by short tandem repeat (STR) on November 24, 2020.
2.3 RNA interferes with lentiviral vector and cell transfection
Small-interfering RNA (siRNA) oligos targeting ZNF655 (shZNF655, 5′-GCCCAGGAAGCAGCAGGGTCA-3′) and the siRNA with a nontargeting sequence (scrambled sequence as negative control, shCtrl, 5′-CCG GAGGGATTGACTTAGAGCAAATCTCGAGATTTGCTCTAAGTCAATCCCTTTTTTG-3′) were synthesized. The targeting sequence (shZNF655 and shCtrl) were linked to the lentiviral vector BRV-112 labeled with green fluorescent protein (Bioscienceres Co. Ltd.), respectively. 3 × 10⁸ TU/mL recombinant lentiviral particles transfected into 5 × 10⁵ cells/mL BEL-7402 and HCCLM3 cells at 37°C using Lipofectamine® 3000 (Invitrogen, Thermo Fisher Scientific) with 20 multiplicity of infection (MOI) for 40 min. After 72 h, the expression of green fluorescent protein label was observed under a fluorescence microscope (200× magnification, OLYMPUS).
2.4 Quantitative real-time polymerase chain reaction (qRT-PCR)
According to the manufacturer's instructions, RNA was extracted from BEL-7402 and HCCLM3 cells using Trizol (Thermo Fisher Scientific, Cat. # 204211). RNA concentration and quality were detected using Nanodrop 2000/2000C spectrophotometer (Thermo Fisher Scientific). Next, cDNA was synthesized using M-MLV Reverse Transcriptase kit (Promega Corporation) and qRT-PCR was performed with SYBR Green Master Mix Kit (Vazyme Biotech Co., Ltd.). Of note, the relative mRNA expression of ZNF655 was normalized by cycle threshold (Ct) of internal control (GAPDH) and quantified by the 2-ΔΔCq method. The primer sequences as follows: ZNF655, forward primer (5′- AAATACCAGCCCAGGAAGCA-3′) and reverse primer (5′- AAATACCAGCCCAGGAAGCA -3′); PSMB8, forward primer (5′-ACAGTGGCTATCGGCCTAATC-3′) and reverse primer (5′-CTTTCACCCAACCATCTTCCT-3′); GAPDH, forward primer (5′-TGACTTCAACAGCGACACCCA-3′) and reverse primer (5′-CACCCTGTTGCTGTAGCCAAA-3′).
2.5 Western blot (WB) analysis
BEL-7402 and HCCLM3 cell proteins were extracted from whole cell lysates using buffer (Sigma-Aldrich), supplemented with Pierce protease inhibitor (Thermo Fisher Scientific) and phosphatase inhibitor (Roche, Basel, Switzerland). The protein was quantified using a BCA protein assay kit (Cat. # A53227, Thermo Fisher Scientific), separated via 10% SDS-polyacrylamide gel electrophoresis (SDS-PAGE), transferred to polyvinylidene difluoride membranes, immersed in blocking solution (TBST containing 5% skimmed milk and 0.5 mL Tween-20) at 4°C for 1 h. After that, the membranes were incubated with primary antibodies (anti-ZNF655, 1:1000, Invitrogen; anti-Bcl-2, 1:500, santa cruz; FAS,1:2000, Proteintech; anti-P53, 1:3000, Proteintech; anti-AKT, 1:1000, CST; anti-p-AKT, 1:1000, Bioss; anti-PIK3CA, 1:1000, Abcam; anti-Cyclin D1, 1:2000, CST; anti-CDK6, 1:1000, Abcam; GAPDH, 1:3000, Bioworld) at 4°C for 4 h. Next, they were immersed in secondary antibody (IgG, 1:3000, Beyotime) for 2 h at room temperature. Finally, immunoreactions were visualized using Amersham ECL+plusTM Western Blot system and the blots were analyzed using ImageJ 1.8.0.112 (National Institutes of Health).
2.6 Cell counting experiment
BEL-7402 and HCCLM3 cells (2 × 10³/well) were inoculated into 6-well plates overnight at 37°C. The cell images were collected once a day for 5 days, quantified cell numbers using Celigo image cytometer (Nexcelom Bioscience) and created cell growth curves for each group.
2.7 Flow cytometry apoptotic assay
BEL-7402 and HCCLM3 cells were inoculated into a 6 cm culture dish at 1000 cells/well density for 5 days. The cells were digested with trypsin, washed with PBS, and centrifuged for 12,000 g at 4°C. Subsequently, the cells were immersed in Annexin V binding buffer (1X, 500 μL, eBioscience, Thermo Fisher Scientific) and stained with Annexin V-APC (10 μL) in the dark for 15 min at room temperature. The cell apoptosis was analyzed under flow cytometer (Guava easyCyte HT, Millipore).
2.8 Flow cytometry cell cycle assay
BEL-7402 and HCCLM3 cells were inoculated into a 6 cm culture dish at 1000 cells/well for 5 days. Next, the cells were digested with trypsin, washed with PBS, and centrifuged for 12,000 g at 4°C. Afterward, BEL-7402 and HCCLM3 cells were immersed in ethanol for 1 h and stained with propidium iodide (PI) for 30 min at room temperature. Finally, the cell ratio in the G1, S, and G2 phases was detected and analyzed using flow cytometer (Guava easyCyte HT, Millipore).
2.9 Detection of apoptotic protein expression by antibody array
Briefly, HCCLM3 cells were washed with cold 1× PBS, lysed by 1× Lysis buffer for 30 min at 4°C to collect total protein. Total protein was diluted to 0.5 mg/mL using Array Diluent Buffer provided by the human apoptotic antibody array kit (Abcam, Cat. # ab134001). Antibody array membrane was immersed in 1× Blocking Buffer at room temperature for 30 min and incubated with total protein (1.2 mL) overnight at 4°C. Subsequently, they were incubated with 1× Biotin-conjugated Anti-Cytokines and horseradish peroxidase-linked Streptavidin overnight at 4°C with gentle rocking shaking. Finally, the signal intensity of the protein was observed after the addition of Amersham ECL+plus Western Blot and the blot was analyzed using ImageJ 1.8.0.112 (National Institutes of Health).
2.10 Transwell assay
Transwell chambers (24-well, 8-mm pore) were purchased from Corning Company. After serum-free medium (100 μL) was added to the bottom of chambers, BEL-7402 and HCCLM3 cells were under starvation condition for 24 h at 37°C and digested by trypsin, washed by PBS for 1–2 times, resuspended in serum-free medium. The cell suspension (100 μL, 5 × 10⁵ cells) was loaded into the upper chamber and 500 μL culture medium containing 30% FBS was added with the lower chamber. The upper chamber contained non-migrating cells, which were removed with cotton swabs. At room temperature, cell lines adhering to the matrix membrane were fixed with 4% paraformaldehyde for 30 min, and then stained with 0.1% crystal violet for 20 min. The stained cells were washed with PBS and then imaged in 5 fields randomly selected under the microscope (200×) for cell counting.
2.11 Wound-healing assay
BEL-7402 and HCCLM3 cells were digested by trypsin, resuspended with DMEM, and inoculated at 5 × 10⁴ cells/well on 6-well plates at 37°C for 24 h. Next day, low-concentration serum medium (with 0.5% FBS) was added to keep cells starved. The scratch meter was gently pushed upward from the middle part of the lower end of the 6-well plate to form scratches at 0 h. Images (50X cell magnification) were obtained by Cellomics (Thermo, ArrayScan VT1) scanning plate for 0 h and 48 h after migration, and cell area was calculated.
2.12 Mice xenograft
The animal experiment was approved by the Ethics Committee of Fudan University and performed in accordance with guidelines for animal care and protection. HCCLM3 cells with ZNF655 knockdown and control (200 μL, 5 × 10⁷ cells/mL) were injected subcutaneously into 4-week-old BALB/c female nude mice (Ling Chang Biotechnology Co., Ltd.) and divided into two groups: shZNF655 (n = 6) and shCtrl (n = 6). Following subcutaneous injection, tumor load was observed under the IVIS spectral imaging system at an emission wavelength of 510 nm. Additionally, tumor volume and mouse weight were measured every other day. After 22 days, the mice were euthanized with cervical dislocation, and the tumor was removed and weighed. Subsequently, proteins from the tumor tissues were extracted, and WB was used to analyze the expression of apoptosis, cycle, and typical signaling pathway proteins. Moreover, tumor tissues in each group were sectioned and subjected to IHC staining to reveal the expression of KI67 (anti-KI67, 1:200, Abcam).
2.13 Bioinformatics analysis
Co-expressed genes with ZNF655 in HCC (https://www.coexpedia.org/hs_single.php?gene=ZNF655) was analyzed to preliminarily explore the potential mechanism. The expression of FAM200A, POLR2J, and PSMB8 in HCC was analyzed based on 50 normal samples and 371 tumor samples from the Cancer Genome Atlas (TCGA) database (http://www.ualcan.path.uab.eduindex.html). The expression correlation between FAM200A, POLR2J and PSMB8, and ZNF655 was analyzed in http://www.gepia2.cancer-pku.cn #index.
2.14 Statistical analysis of data
The data were presented as mean ± SD (n ≥ 3) and analyzed with GraphPad Prism 7.0 software (GraphPad Software Inc.). Statistical difference between two groups were analyzed using the paired two-tailed Student's t-test. p < .05 were considered as statistically significant.
3 RESULTS
3.1 ZNF655 is overexpressed in HCC
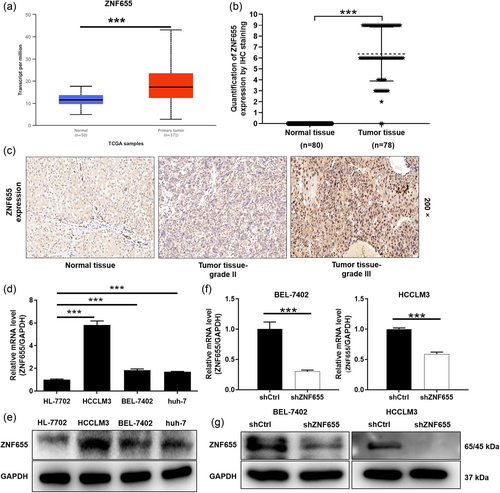
Firstly, online analysis of the TCGA database revealed that the expression of ZNF655 was significantly higher in HCC tumor tissues than in normal tissues (Figure 1a). To confirm the findings of the bioinformatics prediction, the expression of ZNF655 was examined in clinical HCC patients using IHC. Based on the IHC score, we found that 75.6% of tumor tissues exhibited high expression of ZNF655, whereas normal tissues lacked high expression (p < .001, Figure 1b and Table 1). Representative tissue staining images demonstrated that the expression of ZNF655 was stronger in tumor tissues than in normal tissues (Figure 1c). We subsequently analyzed the correlation between ZNF655 expression and HCC characteristics using the Mann–Whitney U test, which revealed a positive correlation between ZNF655 expression and pathological grade (Table 2). Moreover, Pearson correlation coefficient analysis showed that ZNF655 expression increased with worsening tumor malignancy in HCC patients (Table 3). Furthermore, we validated the mRNA and protein expression of ZNF655 in HCC cell lines. As expected, qRT-PCR results indicated significantly higher mRNA expression of ZNF655 in HCC cell lines BEL-7402, HCCLM3, and huh-7 compared to human normal liver cell HL-7702 (p < .001) (Figures 1d and S1A). Consistently, the expression of ZNF655 protein was highly abundant in HCC cell lines (Figure 1e).
| ZNF655 expression | HCC tissue | Normal tissue | p | ||
|---|---|---|---|---|---|
| Sample size | Percentage | Sample size | Percentage | ||
| Low | 19 | 24.4 | 80 | 100 | <.001 |
| High | 59 | 75.6 | 0 | - | |
| Characteristics | Sample size | ZNF655 level | p | |
|---|---|---|---|---|
| Low | High | |||
| HCC patients | 78 | 19 | 59 | |
| Age (years) | .208 | |||
| <53 | 37 | 11 | 26 | |
| ≥53 | 40 | 7 | 33 | |
| Gender | .235 | |||
| Male | 71 | 16 | 55 | |
| Female | 7 | 3 | 4 | |
| Grade | .014 | |||
| I | 2 | 2 | 0 | |
| II | 54 | 15 | 39 | |
| III | 22 | 2 | 20 | |
| T Infiltrate | .379 | |||
| T1 | 9 | 0 | 9 | |
| T2 | 27 | 8 | 19 | |
| T3 | 34 | 10 | 24 | |
| T4 | 2 | 0 | 2 | |
| Stage | .421 | |||
| 1 | 9 | 0 | 9 | |
| 2 | 27 | 8 | 19 | |
| 3 | 33 | 10 | 23 | |
| 4 | 3 | 0 | 3 | |
| Tumor size | .314 | |||
| <7 cm | 38 | 7 | 31 | |
| ≥7 cm | 39 | 11 | 28 | |
| ZNF655 | p | |
|---|---|---|
| Tumor grade | Spearman correlation coefficient | .281 |
| Significance (double-tail) | .013 | |
| N | 78 |
3.2 Downregulation of ZNF655 inhibits the progression of HCC cells in vitro
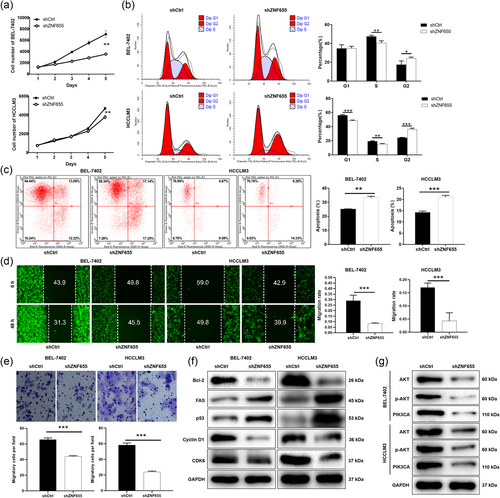
Subsequently, we established lentivirus-mediated ZNF655 knockdown in BEL-7402 and HCCLM3 cells to investigate the role of ZNF655 in HCC. As shown in Figure 1f,g, the mRNA and protein expression levels of ZNF655 were significantly reduced in BEL-7402 and HCCLM3 cells transfected with shZNF655 (p < .001, Figure S1B). The loss-of-function assays were conducted to detect the phenotypes of HCC cells BEL-7402 and HCCLM3. Cell counting results showed that the cell numbers of BEL-7402 and HCCLM3 in the shZNF655 group were markedly fewer than that in the shCtrl group (p < .01) (Figure 2a). Using flow cytometry, we analyzed the effect of ZNF655 on HCC cell cycle and apoptosis. The proportion of BEL-7402 and HCCLM3 cells with downregulated ZNF655 expression in the G2 phase increased significantly (p < .05) (Figure 2b). Moreover, the percentage of apoptosis in BEL-7402 and HCCLM3 increased significantly in the shZNF655 group compared to the shctrl group (p < .01) (Figure 2c). In addition, we conducted wound-healing and Transwell assays to assess the migration of HCC cells following ZNF655 knockdown. Cells wound-healing experiment displayed that the migration of BEL-7402 and HCCLM3 was approximately 70% attenuated compared to controls (p < .001) (Figure 2d). As expected, the number of migrating cells of BEL-7402 and HCCLM3 in the shZNF655 group was decreased than that of the negative control group (p < .001) (Figure 2e). Next, we tested the expression of typical proteins related to apoptosis and cycle. We found that the expression of proapoptotic protein Fas and p53 were upregulated. In contrast, the expression of Bcl-2, Cyclin D1, and CDK6 was downregulated in HCC cells with ZNF655 knockdown (Figures 2f and S1C). Moreover, PI3K/AKT signaling plays a key role as a typical cancer-promoting pathway. Our data indicated that protein expression of V-AKT murine thymoma viral oncogene homolog (AKT), phosphorylation of AKT (p-AKT), and PIK3CA was downregulated in HCC cells with ZNF655 knockdown (Figures 2g and S1D). Consequently, our results suggested that ZNF655 actuated HCC progression by affecting tumor cell proliferation, apoptosis, cycle, and migration.
3.3 Downregulation of ZNF655 impairs tumorigenesis of HCC in vivo
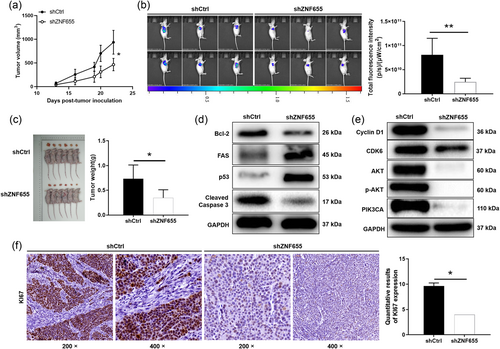
Mice xenograft experiments were performed to demonstrate the effect of stable knockdown of ZNF655 on tumor growth in vivo. After 22 days of continuous monitoring of tumor growth in mice, it was found that tumor growth was significantly reduced in the shZNF655 group compared to the shCtrl group (p < .05) (Figure 3a). To verify our monitoring results, the mice were again placed under an in vivo imaging instrument on day 22 to measure the fluorescence intensity of the tumor. The fluorescence intensity represented the growth of the tumor, and the fluorescence attenuation suggested the inhibition of the tumor growth. As shown in Figure 3b, the fluorescence intensity of the shZNF655 group was sharply decreased than that of the shCtrl group (p < .01). Not surprisingly, stable downregulation of ZNF655 led to dramatic reduction in tumor size in mice. Compared with the negative control group, the tumor weight of the shZNF655 group was significantly reduced by 388 ± 115 mg (p < .05) (Figure 3c). Furthermore, the expressions of apoptotic markers, cycle correlation and typical signaling pathway components in tumor tissues of the knockdown group and the control group were analyzed by WB, and the results were consistent with in vitro experiments (Figures 3e and S1E). Moreover, representative pictures of IHC staining in tumor tissue showing that the signal (brown) intensity of KI67 in the shZNF655 group was weaker than that in the control group. The results suggested that the tumor proliferation index of ZNF655 knockdown mice was reduced (p < .05) (Figures 3f and S1F). The results collectively suggested that mice with reduced expression of ZNF655 had weaker tumor formation ability.
3.4 PSMB8 is co-expressed with ZNF655 in HCC
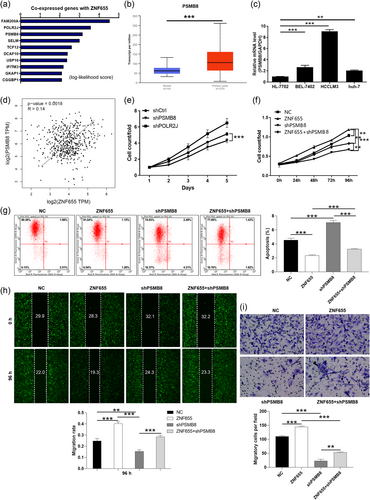
We performed co-expression prediction to uncover the potential mechanism by which ZNF655 regulates stable knockdown in HCC. The top 10 most prominent genes co-expressed with ZNF655 were selected from the genes obtained (Figure 4a). Additionally, public database analysis revealed that FAM200A, POLR2J, and PSMB8 were significantly upregulated in HCC (Figures 4b and S2A,B). Moreover, the expression of FAM200A, POLR2J, and PSMB8 in HCC cell lines was consistently higher than that in normal liver cells (p < .001) (Figures 4c and S2C,D). Subsequently, the correlation analysis of the top three genes FAM200A, POLR2J, and PSMB8 with ZNF655 was conducted by Pearson correlation analysis. According to Figure 4d (p = .0018, R = 0.14), S2E (p = 0, R = 0.54), and S2F (p = .00064, R = 0.15), the expression of ZNF655 was positively correlated with PSMB8 and POLR2J, but not with FAM200A. Considering that the above results could not screen out the gene most related to ZNF655, we used shRNA interference to knock down these three genes in HCCLM3 cells respectively and then performed cell viability detection. Interestingly, the results showed that the downregulation of PSMB8 inhibited the proliferation of this cell most significantly (p < .001) (Figure 4e). Accordingly, we preliminarily suggested that PSMB8 was the co-expression gene of ZNF655.
3.5 PSMB8 knockdown weakens the promotion of ZNF655 overexpression on HCC
In this part, we stably knocked down or amplified the expression levels of PSMB8 and ZNF655 in HCCLM3 cells to observe their effects on the phenotypes of HCC cells. Here, NC (negative control) was HCCLM3 cells transfected with empty vector; ZNF655 referred to the amplification of ZNF655 in HCCLM3 cells; shPSMB8 referred to PSMB8 was stably knocked down in HCCLM3 cells; ZNF655+shPSMB8 referred to ZNF655 overexpression and PSMB8 knockdown simultaneously. As a result, the gain-of-function assays showed a significant promotion in the progression of HCC cells with ZNF655 overexpression, such as proliferation promotion, apoptosis reduction, migration suppression (Figure 4f–i). In addition, the loss-of-function assays suggested that HCCLM3 cells with reduced PSMB8 expression could inhibit the malignant phenotypes. Furthermore, cell function recovery experiments indicated that PSMB8 knockdown weakened the promotion of ZNF655 overexpression on HCC (Figure 4f–i). As a consequence, ZNF655 may promote the progression of HCC cells through PSMB8.
4 DISCUSSION
The growth, proliferation, and deterioration of HCC are influenced by a range of growth factors, receptors, and other related proteins. These processes involve multiple pathways, creating numerous possibilities for the advancement of molecular targeted therapy (Klungboonkrong et al., 2017). The present study recognized that the ZNF655 expression was frequently upregulated in HCC (Figure 1a-e). Moreover, the expression level was positively correlated with the grade of the disease (Tables 2–3). Functionally, ZNF655 actuated HCC progression by affecting tumor cell proliferation, cycle, migration. and apoptosis (Figure 2a–e). As we all known, apoptosis is a complex process that is controlled by a variety of genes (Kaczanowski, 2016). Disruption of the apoptosis process may be directly or indirectly related to the occurrence of many diseases, such as HCC (Fabregat, 2009). Notably, Fas is a transmembrane protein belonging to the tumor necrosis factor receptor superfamily, which can initiate the transduction of apoptosis signals and induce apoptosis (Sang Eun et al., 2019). Besides, major regulatory factors of apoptosis, such as P53, widely recognized as tumor suppressor factors of HCC (S. H. Park et al., 2011; U. S. Park et al., 2000). Additionally, Hernandez-Gea et al., reported that that Bcl-2 may be a regulatory switch between autophagy and apoptosis in HCC (Hernandez–Gea et al., 2013). Furthermore, Cyclin D1 overexpression could accelerate the cell cycle process and induce the development of HCC (Che et al., 2012; Deane et al., 2001). CDK6 was overexpressed in HCC and was a typical factor that mediated the cell cycle (Che et al., 2012; Sun et al., 2014). The present study demonstrated that the expression of proapoptotic protein was upregulated in HCC cells with ZNF655 knockdown, such as Fas and p53. The expression of antiapoptotic protein Bcl-2, and cycle-related proteins Cyclin D1 and CDK6 were downregulated (Figures 2f and 3d,e). Furthermore, a large number of factors and downstream elements in the cell signaling cascade are involved in the development and progression of HCC(Klungboonkrong et al., 2017). Previous studies revealed that PIK3CA could induce the PI3K/AKT signaling pathway (Liu et al., 2018). Activated AKT signaling pathway promoted the progression of HCC (Zakaria et al., 2018). In this study, we indicated that protein expression of AKT, p-AKT, PIK3CA, were downregulated in HCC cells with ZNF655 knockdown (Figures 2g and 3e). Of course, this study has some limitations and has yet to elucidate the specific molecular mechanisms of ZNF655's regulation of apoptosis and cycle-related proteins. However, our results demonstrate that ZNF655 could regulate disease progression by affecting apoptosis, proliferation, and migration.
Mechanistically, we found that proteasome subunit beta type-8 (PSMB8) was co-expressed with ZNF655 in HCC. A previous study reported that PSMB8 was a member of the 20 S proteasome, which was induced by IFN-γ or TNF-α (Kimura et al., 2015). Recently, some evidence has demonstrated the significance of PSMB8 in various malignancies. For instance, PSMB8 expression is associated with the progression of gastric cancer, especially the tumor invasion and lymph node metastasis (Kwon et al., 2016). Furthermore, knockdown of PSMB8 induces glioblastoma cell apoptosis, blocks migration and invasion through the PI3K/AKT signaling pathway (Chang et al., 2020; Yang et al., 2018). Overexpression of PSMB8 is associated with adverse clinical outcomes in most cancers and may serve as a reliable biomarker for determining cancer prognosis(D. Chen et al., 2021; Kwon et al., 2016). Zhang et al. (2020) proposed that LncRNA PSMB8-AS1 promotes pancreatic cancer progression by regulating the miR-382-3p/STAT1/PD-L1 axis. In this study, we observed that PSMB8 exhibited a significant upregulation in HCC. Furthermore, we also noted a positive correlation between the expression of PSMB8 and ZNF655 in HCC. Notably, the overexpression of ZNF655 in HCC was found to be weakened upon the knockdown of PSMB8. However, the precise mechanism underlying the role of ZNF655 and PSMB8 in HCC warrants further investigation.
5 CONCLUSION
In summary, ZNF655 promotes HCC progression through PSMB8, and inhibition of its expression may be a potential therapeutic target for HCC.
AUTHOR CONTRIBUTIONS
Shasha Fan: Formal analysis. Yu Liu: Formal analysis. Zhenhai Lin: Data curation. Yongfa Zhang: Data curation. Ning Zhang: Data curation. Yiming Zhao: Data curation. Jiaming Zhou: Data curation. Anrong Mao: Formal analysis. Longrong Wang: Formal analysis. Yun Feng: Formal analysis. Xigan He: Formal analysis. Lu Wang: Writing—review & editing. Qi Pan: Data curation; Writing—original draft.
ACKNOWLEDGMENTS
Shanghai Natural Science Foundation (17ZR1406200), National Natural Science Foundation of China (81602100), National Natural Science Foundation of China (81874182), Changsha Science and Technology Bureau Project, Technology Plan Of Youth Natural Science Foundation Hunan Province.
CONFLICT OF INTEREST STATEMENT
The authors declare no conflict of interest.
Open Research
DATA AVAILABILITY STATEMENT
All data generated or analyzed during this study are included in this published article and its supplementary information files.


