miR-34a attenuates myocardial fibrosis in diabetic cardiomyopathy mice via targeting Pin-1
Abstract
Diabetic cardiomyopathy (DCM) is characterized by myocardial hypertrophy and fibrosis. This study aimed to investigate the effects of microRNA (miR)-34a on myocardial fibrosis in DCM and its potential mechanism of targeting Pin-1 signaling. Vimentin and Pin-1 proteins in mouse cardiac tissues were detected by immunohistochemical staining. Locked nucleic acid in situ hybridization was used to measure miR-34a expression in cardiac tissues. Primary mouse cardiac fibroblasts (CFs) were transfected with a mimics control/miR-34a mimics or Pin-1 plasmid and cultured in high-glucose (HG) Dulbecco's modified Eagle's medium. The miR-34a levels were measured by quantitative polymerase chain reaction. The apoptosis and viability of transfected cells were detected by the terminal deoxynucleotidyl transferase dUTP nick end labeling and Cell Counting Kit-8 assays respectively. A cell migration experiment and dual-luciferase reporter assay were also performed. The body weight and fasting blood glucose of DCM mice were significantly higher than those in the control (CTL) group. In addition, DCM mice had decreased serum insulin levels and impaired cardiac function. The number of CFs in the DCM group was higher than in the CTL group and Pin-1 expression was upregulated. The expression level of miR-34a in the cardiac tissue of mice in the DCM group was obviously downregulated compared with the CTL group. The HG stimulation of CFs for 48 h significantly downregulated the expression level of miR-34a and was associated with increased Type I collagen expression, cell viability, and migration and decreased apoptosis. However, these effects could be reversed by overexpressing miR-34a in HG-induced CFs. Furthermore, we found that Pin-1 was a direct target of miR-34a. Our results suggest that miR-34a can attenuate myocardial fibrosis in DCM by reducing Type I collagen production, cell viability, and migration and increasing the apoptosis of CFs by targeting Pin-1 signaling.
Abbreviations
-
- CFs
-
- cardiac fibroblasts
-
- CHD
-
- coronary heart disease
-
- DCM
-
- diabetic cardiomyopathy
-
- DM
-
- diabetes mellitus
-
- HG
-
- high-glucose
-
- LVEF
-
- left ventricular ejection fraction
-
- NF-κB
-
- nuclear factor-κB
-
- PPlase
-
- peptidyl-prolyl cis–trans isomerase
-
- RAAS
-
- renin-angiotensin-aldosterone system
-
- STZ
-
- streptozotocin
-
- TGF-β1
-
- transforming growth factor-β1
1 INTRODUCTION
Diabetic cardiomyopathy (DCM) is a myocardial disease that occurs in patients with diabetes mellitus (DM) and cannot be explained by hypertensive heart disease, coronary heart disease (CHD), and other heart diseases (Lee & Kim, 2017). The pathophysiological mechanism of DCM is based on the abnormal metabolism of glucose and lipids in the body, which causes thickening and hardening of the microvascular tube wall. As a result, there is an increase in the volume of myocardial cells and fibroblast proliferation in addition to excessive collagen secretion (Bugger & Abel, 2014; Jia et al., 2016). All of these changes decrease ventricular compliance and cardiac function and eventually result in heart failure. Previous studies showed that sustained hyperglycemia directly stimulated the expression of transforming growth factor-β1 (TGF-β1), encouraged collagen secretion in myocardial fibroblasts (CFs), and accelerated myocardial fibrosis (Athithan et al., 2019). In addition, oxidative stress induced by hyperglycemia increased the transcription of TGF-β1 by increasing nuclear translocation of nuclear factor-κB (NF-κB) and stimulating the synthesis of Type I and Type III collagen (Pang et al., 2019). Activation of the renin–angiotensin–aldosterone system (RAAS) also promoted the synthesis and decreased the decomposition of Type I and type III collagen, which ultimately lead to myocardial hypertrophy and myocardial fibrosis (Zhang et al., 2018). However, the pathogenesis of DCM has not yet been fully elucidated and a specific drug treatment for clinical use remains unavailable.
Numerous studies have shown the involvement of microRNAs (miRNAs) in DCM. For example, a significant upregulation of miR-30d expression was found in streptozotocin (STZ)-induced diabetic rat models that had myocardial fibrosis and reduced left ventricular ejection fraction (LVEF) and short-axis shortening rate (Li et al., 2014). In addition, miR-30d expression was upregulated and positively correlated with the apoptosis rate of rat primary myocardial cells that were stimulated by high glucose concentrations (Morishima et al., 2016). A sharp decrease in miR-133a expression was also detected in the myocardium of STZ-induced diabetic mice and accompanied by changes in the expression of major fibrosis markers such as increased levels of TGF-β1, connective tissue growth factor (CTGF), and fibronectin (FN1) and decreased levels of COL4A1 (Chen et al., 2018). Furthermore, myocardial miR-133a overexpression prevented the phosphorylation of extracellular signal-regulated kinase 1/2 (ERK1/2) and SMAD-2 (Chen et al., 2014). In insulin-resistant myocardium, miR-223 was upregulated continuously (Lu et al., 2010). Finally, miR-223 overexpression increased the amount of glucose transporter 4 protein, which suggests that miR-223 might be an important target for the treatment of Type 2 diabetes (Esteves et al., 2017).
Pin-1 is a member of the peptidyl-prolyl cis–trans isomerase (PPlase) micromycin protein family. It is a unique cis–trans isomerase that recognizes a phosphorylated serine/threonine-proline (pSer/Thr-Pro) motif (Butterfield et al., 2006). Several studies have shown that Pin-1 dysfunction is closely related to the occurrence of tumors and Alzheimer's disease (Cao et al., 2018; Kim et al., 2009). Recently, the association between Pin-1 and the regulation of vascular endothelial function, vascular smooth muscle cell proliferation, myocardial remodeling, aging of cardiac progenitor cells, glucolipid metabolism, and obesity in cardiovascular diseases has also been reported (Wang et al., 2016; Wang, 2018). In the present study, we hypothesized that an miRNA that is downregulated during myocardial fibrosis in diabetic cardiomyopathy (miR-34a) affects the production, viability, apoptosis and migration of myocardial fibroblasts by regulating Pin-1 expression. In particular, we wanted to assess if upregulation of miR-34a improved HG-induced injury in myocardial fibroblasts and alleviated myocardial fibrosis in diabetic cardiomyopathy, which could provide a specific target for disease treatment.
2 MATERIALS AND METHODS
2.1 Establishment of diabetic cardiomyopathy model
A total of 30 male, 6-week-old, C57BL/6J mice were purchased from the Southern Model Animal Research Center (Nanjing, China). The mice were caged in a specific-pathogen-free (SPF) environment (22°C–25°C, 45%–65% humidity) with five mice per cage. A 12-h-day light cycle was used and the mice could eat and drink freely. All procedures were in accordance with the requirements of the Laboratory Animal Ethics Committee. Mice were raised adaptively for 1-week before starting the modeling experiment. Then, 30 mice were randomly divided into the diabetic cardiomyopathy (DCM; n = 20) and control (CTL) groups (n = 10). DCM mice were fed a high-fat diet (HFD) for 4 weeks and fasted for 12 h before STZ was injected intraperitoneally at a dose of 100 mg/kg (100 g/L dissolved in citrate buffer solution). The mice in the CTL group were fed a normal diet and intraperitoneally injected with an equal volume of citrate buffer. Mice were measured for changes in body weight and blood glucose at weeks 0, 5, 11, and 16. Indicators related to serum insulin and cardiac function were measured at 16 weeks. Both groups were killed after feeding at 16 weeks. The left ventricular tissues were removed and cut into 2 × 2 mm pieces for histomorphological analysis.
2.2 Weight and blood glucose measurements
Body weight (BW) and fasting blood glucose (FBG) were measured at five time points: the beginning of the modeling experiment (0 weeks), 5 weeks, 6 weeks, 11 weeks, and 16 weeks. After fasting for 12 h, the BW was measured and then FBG was measured using a glucometer with blood collected from the tail vein. An FBG value higher than 13.89 mmoL was considered an indicator for the successful establishment of the type 2 diabetic (T2D) mouse model (Wang et al., 2016).
2.3 Determination of cardiac function
After feeding for 16 weeks, the mice were anesthetized by isoflurane inhalation (Sigma), fixed to the experimental table, and cardiac function was detected with an ultrahigh-resolution small animal ultrasound imaging system (Visual Sonics). The indicators included the ratio of the early diastolic peak E′ velocity to the late diastolic peak A′ velocity (E′/A′), ratio of mitral valve E velocity to E′ velocity (MV E/E′), cardiac output (CO), left ventricular ejection fraction (LVEF), and left ventricular fractional shortening (LVFS). Data shown are the average of three independent measurements.
2.4 Determination of serum insulin
After feeding for 16 weeks, blood was collected by enucleation of the eyeball. The supernatant was collected by centrifugation at 5000 rpm for 5 min after blood coagulation at room temperature. The serum insulin levels were measured using the Mouse Insulin ELISA Kit (Invitrogen) according to the manufacturer's instructions.
2.5 Hematoxylin and eosin staining
The paraffin sections of mice left ventricular tissues were placed into Xylene Ⅰ and Xylene Ⅱ respectively for 10 min. Then, tissues were rehydrated by sequential submersion in anhydrous Ethanol Ⅰ, anhydrous Ethanol Ⅱ, 95% alcohol, 90% alcohol, 80% alcohol, and 70% alcohol for 5 min at each stage. After washing with distilled water, the sections were stained in hematoxylin liquid (Solarbio) for 5 min, washed with tap water, differentiated in 1% hydrochloric acid alcohol for several seconds, and rinsed with tap water again. A 0.6% ammonia solution was used for bluing. Next, sections were rinsed in water and stained with eosin staining solution (Solarbio) for 1-min. Dehydration and clearing were performed by placing the sections into 95% Alcohol I, 95% Alcohol II, anhydrous Ethanol Ⅰ, anhydrous Ethanol Ⅱ, Xylene Ⅰ and Xylene Ⅱ sequentially for 5 min at each stage. After sealing with neutral resins, sections were observed using an optical microscope (Nikon) with ×100 or ×400 magnification.
2.6 Masson staining
The procedures of dewaxing and hydration were performed as described before. Nuclear staining was performed by immersion in reagent A (Bogoo Biotechnology, Shanghai, China) for 10 min. After sufficient rinsing in water, the slides were put into a 65°C oven until the surfaces of the specimens were dry and white. Reagent B was applied to the slides for 10 min at room temperature. Reagent C was used to wash the section three times (3 min per wash) to remove reagent B. Excess water was shaken from the slides and reagent D was applied for 5 min before removal with filter paper and direct staining with reagent E for 10 s. Finally, slides were washed with reagent C until the stain was clear. The procedures of dehydration, clearing, and sealing were performed as described before. The sections were observed under an optical microscope (Nikon) using ×100 or ×400 magnification. Images show blue-stained collagen fibers and red-stained muscle.
2.7 Immunohistochemical staining
The procedures of dewaxing and hydrating were performed as described before. Mouse left ventricular tissue slides were placed into a repair box with an appropriate amount of 0.01 mol/L citrate buffer (pH = 6.0) and repaired in a mid-range microwave for 10 min. The slides were left to return to room temperature before they were removed and rinsed three times with phosphate-buffered saline (PBS; pH = 7.4) for 3 min. Sections were incubated at room temperature for 15 min in 3% hydrogen peroxide and rinsed three times with PBS (pH = 7.4) for 3 min. Excess PBS was removed before the sections were blocked in 5% serum at 37°C for 30 min. Sections were incubated in a 1:400 dilution of Rabbit anti-Vimentin antibody (ab71144, Abcam) or Rabbit Anti-Pin1 antibody (ab12107, Abcam) overnight at 4°C in a wet box. The primary antibodies were removed by rinsing three times with PBS (pH = 7.4) for 3 min followed by incubation with a horseradish peroxidase-labeled secondary antibody (1:1000) at 37°C for 30 min. Diaminobenzidine solution was added for several seconds after washing with PBS. The sections were observed under an optical microscope (Nikon) using a ×100 or ×400 magnification. Positive cells were stained brown. Immunohistochemical staining of cells was performed by incubating slides in 4% paraformaldehyde for 30 min. After washing with PBS, 0.5% Triton X-100 was added for 20 min to permeate the cell membranes and removed by washing three times with PBS. Finally, 3% hydrogen peroxide for 15 min. The subsequent steps were the same as described for the paraffin section. A mouse monoclonal Anti-Collagen Type I antibody (C2456, Sigma) was used.
2.8 Locked nucleic acid in situ hybridization
The procedures of dewaxing and hydrating were performed as described before. Locked nucleic acid in situ hybridization (LNA-ISH) was performed by adding proteinase K (Invitrogen) and incubating the sections at 37°C for 15 min. After rinsing, tissues were fixed with 4% paraformaldehyde for 15 min. Pre-hybridization was performed at 53°C for 2 h followed by overnight hybridization with a Digoxin-labeled miR-34a probe (20 nmol/L) was hybridized overnight at 53°C. After washing, the slides were blocked at room temperature for 30 min and incubated in an anti-Digoxin antibody (1:800 dilution) at room temperature for 2 h. NBT/BCIP coloration was performed for 2 h. The procedures of dehydration, clearing, and sealing were performed as already described. The green fluorescence intensity was observed using a fluorescence microscope (Olympus) with a ×400 magnification.
2.9 Cell culture and intervention
C57BL/6 mice were killed by decapitalization, sterilized twice with 75% ethanol, and heart tissues were removed under aseptic conditions and cut into 1 mm3 pieces. Heart tissues were then washed with Hank's buffer (Gibco) and digested with 0.08% trypsin (containing 0.06% collagenase) in a 37°C water bath. The digested supernatant was removed and collected cells were centrifuged, suspended, and seeded in a cell culture dish at 37°C for 2 h. Cells that did not adhere were removed by differential adherence and low-glucose Dulbecco's modified Eagle's medium (DMEM; Gibco) containing 10% fetal bovine serum (Gibco) was used to culture primary mouse cardiac fibroblasts (CFs). Cells were digested with 0.25% trypsin (Gibco) after reaching a density of 70%–80% and subcultured at a ratio of 1:2. CFs cultured in DMEM containing 5 mmol/L glucose for 48 h were used as the control (CTL) group. CFs cultured in DMEM containing 25 mmol/L glucose for 48 h were used as the high-glucose (HG) group. CFs transfected with 50 nmol/L mimics control (Ribobio) for 8 h and then cultured in HG DMEM for 48 h were used as the HG+miR-con group. CFs transfected with 50 nmol/L miR-34a mimics (Ribobio) for 8 h and cultured in HG DMEM for 48 h were used as the HG+miR-34a group. CFs cotransfected with 50 nmol/L miR-34a mimics and Pin-1 plasmid for 8 h and cultured in HG DMEM for 48 h were used as the HG+miR-34a+Pin1 group. The host of Pin-1 plasmid (NM_106017.4, pTOPO-PIN1-a, Miaolingbio) is Escherichia coli, total length of the complementary DNA (cDNA) sequences was 522 bp. Compared with Genebank on PubMed, the Pin-1 structure, and function were predicted. The sequence of Pin-1 carrier was presented in the supplemental data.
2.10 Quantitative polymerase chain reaction
CFs were harvested and dissociated with 1 ml Trizol (Invitrogen), mixed vigorously with 400 μl trichloromethane, and spun at 16,000 rpm (4°C) for 10 min. The supernatant was removed and an equal volume of isopropanol was added and mixed followed by centrifugation at 5000 rpm (4°C) for 5 min. The white, adherent precipitate was washed with 70% ethanol and dried and dissolved in 20 μl of deionized water. The miRNA concentration was determined by colorimetry and miRNA was reverse-transcribed into cDNA using a microRNA cDNA synthesis kit (Takara). Quantitative polymerase chain reactions (qPCR) were performed in a 25 μl volume (Takara) according to the manufacturer's instructions using the following primer sequences: miR-34a-Forward: miR-34a-Forward: 5′-TGCGCTGGCAGTGTCTTAGCTG-3′, miR-34a-Reverse: 5′-CCAGTGCAGGGTCCGAGGTATT-3′; U6-Froward: 5′-CTCACTTCGGCAGCACATA, U6-Reverse: 5′-AACTCTTCACGATTTTGTCTGTC-3′.
2.11 Cell Counting Kit-8 assay
CFs were cultured in 96-well plates at a density of 1 × 10⁴ cells per well. A 10 μl volume of Cell Counting Kit-8 (CCK-8; Solarbio) solution was added to each well and the plates were incubated at 37°C for 1 h. Absorbance was measured at 450 nm with a microplate reader (Bio-Rad).
2.12 TUNEL assay
CFs were cultured in 6-well plates at a density of 1 × 10⁵ cells per well. A One-Step terminal deoxynucleotidyl transferase dUTP nick end labeling Apoptosis Assay Kit (Beyotime) was used according to the manufacturer's instructions to detect the apoptosis of CFs. Green fluorescence was observed using a fluorescent microscope (Olympus) at ×400 magnification.
2.13 Cell migration experiment
Cell migration was measured using a ChemoTx disposable 96-well cell migration system (Neuroprobe). The membrane was pretreated in a 0.3% mouse tail collagen solution for 12 h (4°C) and placed in serum-free DMEM at 37°C. The processed CFs were diluted to a concentration of 1 × 10⁵ cells/ml. A 166 μl volume of normal or HG serum-free DMEM was added to the lower layer of the cell migration device. After laying the membrane and fixing the upper device, 100 μl of cell suspension was added to the upper layer and cells were left to migrate for 4 h. The membrane was removed and wet filter paper was used to remove the cells on the smooth surface of the membrane and the rough side was placed onto fresh filter paper to dry. Cells on the rough side of the membrane were fixed in methanol for 5 min and dried thoroughly before being submerged in crystal violet staining solution for 30 min. The membrane was removed, rinsed with double distilled water, and placed rough-side-up on a glass slide for imaging with an optical microscope (Nikon) using ×100 magnification.
2.14 Western blot analysis
CFs were harvested and dissociated with 200 μl radioimmunoprecipitation assay lysis buffer (Invitrogen) containing 2 μl phenylmethylsulfonyl fluoride (Thermo Fisher Scientific). Total protein was measured using a bicinchoninic acid assay (Thermo Fisher Scientific). A 1:400 dilution of Rabbit anti-Pin1 (ab12107, Abcam), Rabbit anti-cleaved Caspase3 (Abcam), Rabbit anti-bcl2 (Abcam), and Rabbit anti-β-actin (Santa Cruz) antibodies were used to identify target proteins by electrochemiluminescence (ECL).
2.15 Dual-luciferase reporter assay
A dual-luciferase reporter assay kit (Promega) was used according to the manufacturer's instructions. CFs were cultured for 24 h in 24-well plate at a density of 3 × 10⁴ cells per well. Cells were transiently cotransfected with the mimics control/miR-34a mimics and pGL3-Pin 1-3′-UTR/pGL3-Pin 1mutant-3′-UTR plasmid for 8 h and luminescence was measured using a chemiluminometer. Results are expressed as the relative luminescence.
2.16 Statistical analysis
GraphPad Prism version 7.0 and SPSS version 21.0 were used for data analysis. All data are shown as the mean ± SD. An unpaired t-test was used to detect significant differences between two groups. A difference with a p < .05 was considered statistically significant.
3 RESULTS
3.1 Changes in blood glucose level and cardiac function in DCM mice
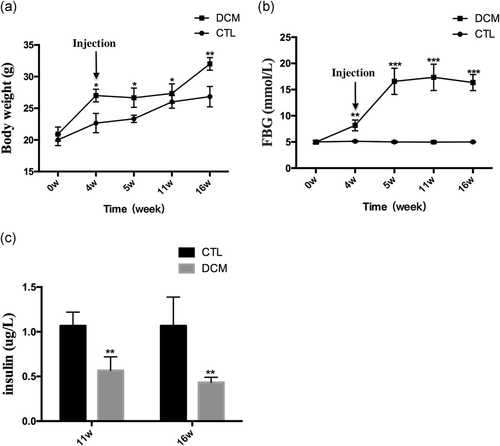
After receiving a high-fat diet (HFD) for 4-weeks, the weight of the DCM group was significantly higher than the CTL group (p < .05). The bodyweight of the DCM group decreased slightly 1-week after the STZ injection but the mice in this group remained heavier than those in the CTL group (p < .05). Similarly, at weeks 11 and 16, the body weights of both groups continued to increase but the average weight of the DCM group was significantly higher than the CTL group (p < .05; Figure 1a). Figure 2b shows the changes in fasting blood glucose (FBG) in both groups. The CTL group had a relatively stable FBG level while the FBG level of the DCM group obviously increased after 4 weeks of HFD. One week after injecting STZ, the FBG level of the CTL group surpassed 13.89 mmol/L. The FBG level continued to increase until Week 11 and had decreased slightly by Week 16. The FBG levels of the DCM group at 6, 11, and 16 weeks were significantly higher than those of the CTL group (p < .05). The ELISA assay showed that the serum insulin levels of the DCM group were significantly lower than those of the CTL group at both 11 and 16 weeks (p < .05; Figure 1c). Furthermore, the cardiac indicators suggested that the cardiac function of DCM mice had markedly deteriorated (Table 1). In particular, after 16 weeks, the DCM group had increased E′/A′ and MV E/E′ and decreased CO, LVEF, and LVFS compared with the CTL group.
| Variable | 11w | 16w | ||
|---|---|---|---|---|
| CTL | DCM | CTL | DCM | |
| E′/A′ | 0.89 ± 0.25 | 1.31 ± 0.21* | 0.97 ± 0.13 | 1.08 ± 0.11* |
| MV E/E′ | 32.43 ± 1.21 | 33.01 ± 2.82 | 31.48 ± 0.45 | 34.56 ± 1.12* |
| CO (ml/min) | 36.95 ± 4.77 | 36.46 ± 1.25 | 36.95 ± 1.34 | 32.32 ± 2.03* |
| LVEF (%) | 54.13 ± 3.87 | 53.11 ± 4.28 | 54.01 ± 1.26 | 50.78 ± 0.25* |
| LVFS (%) | 31.26 ± 2.35 | 30.34 ± 2.67 | 30.76 ± 0.11 | 27.14 ± 0.16* |
- Note: Data are shown as the mean ± SD. NCTL = 10, NDCM = 10.
- Abbreviations: CTL, control; DCM, diabetic cardiomyopathy; E′/A, the ratio of early diastolic peak E′ velocity to late diastolic peak A′ velocity; MV E/E′, the ratio of mitral valve E velocity to E′ velocity; CO, cardiac output; LVEF, left ventricular ejection fraction; LVFS, left ventricular fractional shortening.
- * Statistically significant differences compared with the CTL group are shown as p < .05.
3.2 Pin1 expression increased and miR-34a expression decreased in the left ventricular tissues of DCM mice
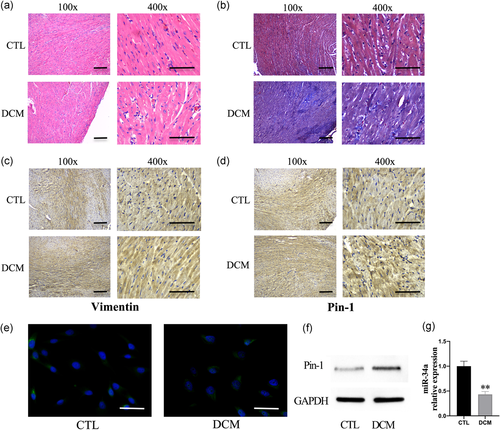
The H&E stain showed that cardiomyocytes in DCM mice were hypertrophic, irregularly arranged, and fibrous tissue had proliferated (Figure 2a). In addition, Masson staining showed that the myocardial tissue of DCM mice had more blue-stained collagen fibers than CTL mice (Figure 2b). Immunohistochemical analysis showed that the numbers of vimentin-stained and Pin-1 stained positive cells were significantly higher in the cardiac tissue of DCM mice compared with CTL mice (Figure 2c,d). Therefore, the number of cardiac fibroblasts (CFs) was higher in the DCM group than in the CTL group and the protein expression of Pin-1 was also upregulated (Figure 2f). Furthermore, the expression of miR-34a in cardiac tissues from the DCM group was obviously downregulated compared to the CTL group as shown by the LNA-ISH result (Figure 2e). The expressions of miR-34a in both groups were also measured by Q-PCR (Figure 2g).
3.3 Overexpression of miR-34a decreased Type I collagen expression in high-glucose induced CFs
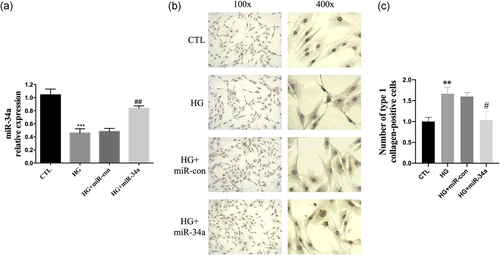
HG stimulation of primary mouse CFs for 48 h significantly downregulated the expression level of miR-34a (p < .001; Figure 3a). Moreover, the number of Type I collagen-positive cells was visibly higher than in the CTL group (Figure 3b,c). However, we found that overexpressing miR-34a in CFs reduced the number of Type I collagen-positive cells that were stimulated by HG (Figure 3b). Therefore, these data suggest that HG stimulation decreases miR-34a levels and increases the production of type I collagen in CFs. However, this effect can be reversed by overexpressing miR-34a.
3.4 Overexpression of miR-34a increased apoptosis and decreased migration in high-glucose induced CFs
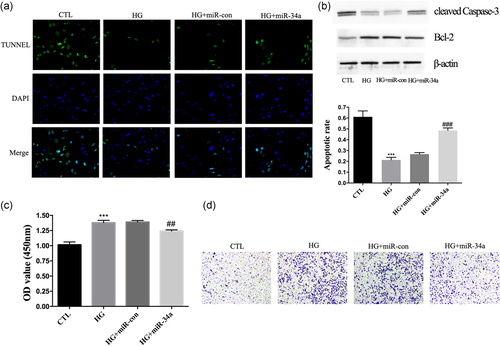
Further characterization of the CFs showed that HG stimulation decreased the apoptosis of CFs (Figure 4a) and increased cell viability and migration (Figure 4c,d). Furthermore, we found that the abundance of cleaved Caspase-3 protein had increased and bcl-2 protein had decreased (Figure 4b). Cells that were overexpressing miR-34a had markedly increased apoptosis and reduced cell viability and migration compared with the HG + miR-con group (Figure 4a–d). These results provide evidence that miR-34a could reverse adverse effects on CFs by regulating cell viability, apoptosis, and migration.
3.5 Pin-1 was a direct target of miR-34a
We found that HG stimulation upregulated the protein expression of Pin-1 in CFs (p < .001) but that overexpression of miR-34a significantly reduced the relative amount of Pin-1 (p < .001; Figure 5a). A potential miR-34a target sequence in the 3′-untranslated region (UTR) of Pin-1 was identified by bioinformatics analysis. Next, a dual-luciferase assay was used to test if sequences in the 3′-UTR of Pin-1 were responsive to miR-34a. We constructed luciferase reporter vectors that contained the wild-type Pin-1 3′-UTR sequence (pGL3- Pin-1-3′-UTR) or a mutated Pin-1 3′-UTR sequence (pGL3- Pin-1mutant-3′-UTR). CFs were cotransfected with miR-34a mimics and either the pGL3- Pin-1-3′-UTR or pGL3- Pin-1mutant-3′-UTR reporter. We measured the luminescence 8-hours posttransfection and found that the relative luciferase activity was significantly lower in the miR-34a+pGL3- Pin-1-3′-UTR group (Figure 5b). Furthermore, the reporter vector that contained the mutated miR-34a target site did not have effect on luciferase activity when co-incubating with miR-34a mimics (Figure 5b). Therefore, these results provide evidence that Pin-1 is a direct target of miR-34a.

3.6 Pin-1 was necessary for the miR-34a-mediated cell functions of CFs
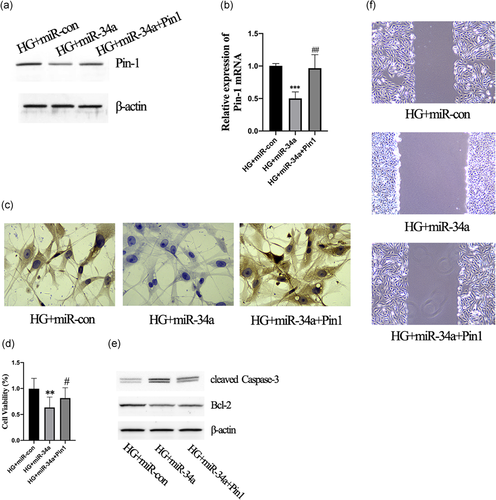
CFs overexpressing miR-34a had lower levels of Pin1 protein (Figure 6a) and mRNA (Figure 6b). Furthermore, co-transfecting CFs with miR-34a mimics and the Pin1 plasmid obviously upregulated Pin1 expression compared with the HG+miR-34a group (Figure 6a,b). Furthermore, the number of Type I collagen-positive cells was visibly decreased in the HG+miR-34a group that were overexpressing Pin-1 (Figure 6c). In addition, cells that were cotransfected with miR-34a mimics and Pin1 plasmid resulted had increased cell viability (Figure 6d) and decreased apoptosis compared with the HG+miR-34a group (Figure 6e). The migration of cells was suppressed by the miR-34a mimics; however, this was reversed by Pin1 overexpression (Figure 6f). Therefore, these data indicate that Pin-1 is necessary for the miR-34a-mediated cell functions of CFs.
4 DISCUSSION
Our study found that miR-34a could attenuate myocardial fibrosis in DCM by reducing Type I collagen production, cell viability, and migration and increased apoptosis of CFs by targeting Pin-1 signaling. This finding could be expected given that Pin-1 has been reported to be involved in processes included in the myocardial remodeling of DCM (myocardial hypertrophy, apoptosis, and fibrosis), which are an important pathophysiological basis for the development of heart failure (Schultheiss et al., 2019). Various hypertrophic factors such as serum, phenylephrine, and hypertension have been shown to mainly induce hypertrophy via two signaling pathways including Akt and MEK/ERK (Khalilimeybodi et al., 2018). Previously, knocking out the Pin-1 gene reduced myocardial hypertrophy and cardiac dysfunction caused by aortic constriction in vivo (Sakai et al., 2014). In cultured cardiomyocytes, Pin-1 could directly bind to Akt, MEK, and Raf-1 under the stimulation of hypertrophic factors, which suggested that Pin-1 could be a potential therapeutic target for pathological myocardial hypertrophy (Toko et al., 2013). In addition, Pin-l has also been linked to the regulation of cardiomyocyte apoptosis and myocardial fibrosis. Studies have found that ethanol increased the expression and activity of Pin-1 in mouse primary myocardial cells in a dose-dependent manner, which promoted mitochondrial oxidative stress, reduced mitochondrial transmembrane potential, induced myocardial cell apoptosis, and promoted the formation of alcoholic cardiomyopathy (Wang et al., 2016). siRNA-mediated inhibition of Pin-1 expression reduced ethanol-induced myocardial cell apoptosis (Bae et al., 2018). In addition, the expression of Pin-1, TGF-β1, and α smooth muscle actin (α-SMA) proteins increased in the cardiocytes of STZ-induced diabetic mice while the deposition of extracellular matrix (ECM) such as Collagen I and III increased (Inoue et al., 2019). Furthermore, it was shown that Pin-1 inhibitors could improve myocardial fibrosis and cardiac function in mice (Liu et al., 2016). Similarly, in vitro experiments found that HG caused an upregulation of Pin-1 in cardiac fibroblasts that was accompanied by an increase in the abundance of p-Akt, p-Smad2, p-Smad3, TGF-β1, and α-SMA (Wu et al., 2019). Pin-1 inhibitors significantly reduced the abundance of these proteins and inhibited HG-induced myocardial fibroblast proliferation and migration (Matena et al., 2018). Our data, combined with the findings of previous studies, provide convincing evidence that Pin-1-related signaling pathways are also involved in the occurrence of DCM myocardial fibrosis.
miR-34a is a multifunctional miRNA that plays an important role in many physiological and pathological processes including aging, atherosclerosis, and CHD. One study found that the expression level of miR-34a in the heart tissues of elderly patients was significantly increased and related to the apoptosis, hypertrophy, fibrosis, and decreased compliance of cardiomyocytes (Banerjee et al., 2019). Furthermore, inhibiting the expression of miR-34a in cardiomyocytes reduced apoptosis by upregulating phosphatase nuclear targeting subunit (PNUTS), which reduced the DNA damage response (Boon et al., 2013). In addition, miR-34a expression was significantly increased in mice with acute myocardial infarction (AMI) and inhibiting the expression of miR-34a in cardiomyocytes promoted the recovery of heart function in mice (Lv et al., 2014). miR-34a has also been associated with changes in the amount of acetaldehyde dehydrogenase 2 (ADLH2) in hypoxic myocardial cells. The level of miR-34a 2 h after hypoxia was 10 times higher than in the control group and remained about four times higher after 4 h (Zhang et al., 2017). Therefore, miR-34a might be involved in the early regulation of hypoxia in myocardial cells. Some studies have also linked miR-34a to the pathophysiology of atherosclerosis. A gradual increase in miR-34a expression was found in atherosclerotic mice during the course of the disease (Shan et al., 2013). Overexpression of miR-34a in vascular endothelial cells (VECs) promoted cell senescence by inhibiting the SIRT-1 signaling pathway (Roy et al., 2013). In addition, over-expressing miR-34a in vascular endothelial progenitor cells also resulted in a senescent phenotype and angiogenesis was inhibited (Guo et al., 2017). These studies suggest that miR-34a has therapeutic potential for the treatment of cardiovascular diseases. In our study, we found that miR-34a was an upstream regulator of Pin-1 and that over-expressing miR-34a regulated a number of functions of CFs and resulted in the improvement of DCM. These findings contradict the role of miR-34a in other cardiovascular diseases and this difference could be linked to the effects of glucose metabolism or the specific disease pathogenesis. Therefore, these findings also suggest that different miR-34a modulators might be needed for different heart diseases.
5 CONCLUSION
We have shown the effects of miR-34a on Type I collagen production, cell viability, migration, and apoptosis of CFs in vitro. Overexpression of miR-34a reduced the production of Type I collagen and resulted in less ECM deposition in the myocardial matrix. Increased viability and decreased apoptosis inhibited the proliferation of CFs, which was a crucial pathophysiology of DCM. The inhibited migration of CFs also attenuated the disease. Further investigations should be performed to establish if the beneficial effects of miR-34a in vitro are also observed in vivo. In conclusion, our findings indicate that miR-34a regulates HG-induced cellular dysfunction of CFs by directly targeting Pin-1 and this mechanism may play a crucial role in the pathogenesis of DCM.
CONFLICTS OF INTEREST
All the authors declare that there are no conflicts of interests.
Open Research
DATA AVAILABILITY STATEMENT
The data that support the findings of this study are available on request from the corresponding author.


