Expression profiles uncover the correlation of OPN signaling pathways with rat liver regeneration at cellular level
Abstract
Osteopontin (OPN) could participate in the occurrence of multiple liver diseases via promoting inflammation, cell activation, proliferation, and migration. However, the correlation of OPN with liver regeneration (LR) is poorly defined. Previous studies from us and others revealed that OPN was probably involved in the activation and proliferation of various hepatic cell types during LR. In this study, to further investigate the underlined mechanism of OPN in regulating LR, eight hepatic cell types were isolated and purified from rat regenerative livers at 10 time points. The gene expression profiles of above hepatic cells were assayed by Rat Genome 230 2.0 chips, and then IPA software was used to uncover the correlations of gene expression changes with physiological activities. The findings demonstrated that the majority of the OPN pathway-related genes were up-regulated in hepatocytes (HCs), pit cells (PCs), oval cells (OCs), and biliary epithelial cells (BECs) but down-regulated in other four cell types including sinusoidal endothelial cells (SECs), Kupffer cells (KCs), dendritic cells (DCs), and hepatic stellate cells (HSCs). Thereafter, functional enriched analysis by IPA indicated that OPN signaling pathway might promote cell proliferation, activation, migration, and inflammation in HCs, OCs, BECs, and PCs, and slightly boost proliferation and migration of SECs and KCs but inhibit inflammation response and chemotaxis in SECs and KCs and almost all physiological processes in DCs and HSCs. Morever, apoptosis, cell death, and necrosis were remarkably inhibited through JAK/STAT, ERK1/2, and NF-kB branches in almost every cell type. These above results suggest that OPN signaling pathway is closely related to HCs, OCs, BECs, and PCs but has less regulatory effect on SECs, KCs, HSCs, and DCs during rat LR.
Abbreviations
-
- OPN
-
- osteopontin
-
- LR
-
- liver regeneration
-
- PH
-
- partial hepatectomy
-
- OC
-
- operation control
-
- IPA
-
- ingenuity pathway analysis
-
- HC
-
- hepatocyte
-
- BEC
-
- biliary epithelial cell
-
- OC
-
- oval cell
-
- HSC
-
- hepatic stellate cell
-
- SEC
-
- sinusoidal endothelial cell
-
- KC
-
- Kupffer cell
-
- PC
-
- pit cell
-
- DC
-
- dendritic cell
-
- PI3K
-
- phosphoinositide 3-kinase
-
- Akt
-
- v-akt murine thymoma viral oncogene homolog 1
-
- MAPK
-
- mitogen-activated protein kinase
-
- JNK
-
- c-Jun NH2-terminal kinase
-
- ERK
-
- extracellular regulated protein kinases
-
- JAK
-
- Janus kinase
-
- STAT
-
- signal transducer and activator of transcription
-
- NF-κB
-
- nuclear factor NF-kappa-B p105 subunit
-
- ROCK
-
- Rho kinase
-
- RhoA
-
- ras homolog family member A
Introduction
The secreted glycol-phosphoprotein 1 (OPN), as a member of Th1 cytokines, has been revealed to participate in the occurrence and development of multiple liver diseases. In obesity-induced hepatic steatosis, OPN could activate natural killer T (NKT) cells and neutrophils by interacting with its receptors, triggered the infiltration of neutrophils, and then aggravated liver damage (Kiefer et al., 2011). In the progress of hepatic fibrosis, OPN was able to affect hepatic stellate cells (HSCs) activation, and then accelerate the expression of collagen, matrix metalloproteinase (MMP), and cytokines (Honsawek et al., 2010; Sabo-Attwood et al., 2011; Urtasun et al., 2012). Moreover, the over-expression of OPN was closely related to metastasis and prognosis of hepatocellular carcinoma (HCC), and OPN depletion by siRNA could inhibit formed colony numbers and antagonize metastasis potential for HCC cell lines (Lin et al., 2011). Two studies from one Japanese lab together revealed that OPN protein was presented in the regenerating hepatocytes and bile ductular structures in the livers of patients with fulminant hepatic failure, and then surmised that OPN could activate hepatic stem cells during liver regeneration (LR) (Arai et al., 2004, 2006). Taken together, OPN has been shown to regulate inflammation, cell activation, proliferation, and migration through targeting several hepatic cell types.
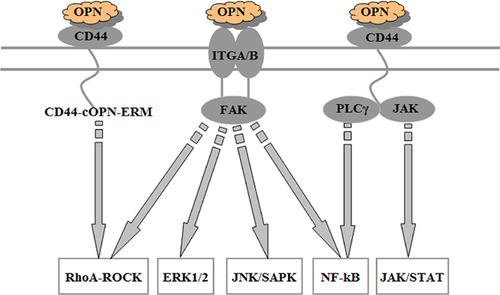
It is well known that liver is composed of at least eight hepatic cell types, including hepatic parenchymal cells (hepatocytes, HCs, and biliary epithelial cells, BECs) and non-parenchymal cells such as HSCs, Kupffer cells (KCs), sinusoidal endothelial cells (SECs), etc. One of our previous studies confirmed that the mRNA level of OPN was elevated at 2–72 h in isolated HCs, KCs, pit cells (PCs), and dendritic cells (DCs) from regenerated livers after partial hepatectomy (PH), and its highest expression even exceeded control levels by 31-fold, indicating that OPN might be associated with the activation and proliferation of various hepatic cells during LR (Wang and Xu, 2010a). On the other hand, it is generally acknowledged that OPN could perform its functions through PI3K/Akt, MAPK, and NF-κB signaling pathways upon binding to a number of integrins receptors (Sodek et al., 2000; Denhardt et al., 2001; Chakraborty et al., 2006; Urtasun et al., 2012), or through PI3K/Akt (Chakraborty et al., 2006; Wang and Denhardt, 2008) and JAK/STAT (Behera et al., 2010) signaling pathways when interacting with CD44. Figure 1 depicts the main downstream signal pathways activated by OPN. Therefore, the influences of OPN and its related signaling pathways on kinds of hepatic cells in LR need to be further defined. In this study, OPN-mediated signaling pathway was first summarized into five branches according to several common databases and related literatures. Then, based on the OPN signaling network mentioned above, this study used Rat Genome 230 2.0 chip to assess the expression changes of OPN signaling pathway-related genes in eight kinds of hepatic cells during LR and applied Ingenuity Pathway Analysis (IPA) software to clarify the possible regulatory effects of OPN on eight hepatic cell types at transcriptional level.
Materials and methods
Preparation of hepatic mixed cell suspension
A total of 76 adult male Sprague-Dawley (SD) rats were randomly separated into 19 groups (n = 19 × 4) including nine PH groups, nine operation control (OC) groups, and one normal control (NC) group. The rats in PH groups were subjected to 2/3 PH, as described by Higgins and Anderson (1931), and four rats were anesthetized at 0, 2, 6, 12, 24, 30, 36, 72, 120, and 168 h after PH, respectively. The rats in OC groups were subjected the same procedure as the PH group but without removal of liver lobes. The four rats in the NC group were used as 0 h sample in both OC groups and PH groups. Therefore, a total of 76 × 8 SD adult rats should be used for the isolation of eight liver cell types including HCs, BECs, oval cells (OCs), HSCs, SECs, KCs, PCs, and DCs required in this study. The scattering of mixed cell suspension was prepared according to the conventional two-step method (Kreamer et al., 1986; Ferry et al., 1991) and, finally, the mixed cell populations were collected through 200-mesh filtering. When the separation efficiency was more than 5.0 × 10⁸ cells/rat, cell viability more than 95%, the sample can be used for the following procedures. The samples from four rats in each group were mixed together and set aside.
Isolation and purification of eight hepatic cell types
The isolation of eight hepatic cell types at 10 time points after PH was performed as described in our previous study (Wang and Xu, 2010b). Briefly, 6 mL of acceptable mixed cell populations were obtained through 60% Percoll density gradient centrifugation, and the harvested pellet at bottom and supernatant were the purified hepatocytes (HCs) and nonparenchymal cells-enriched supernatant fractions, respectively (Kreamer et al., 1986). Then, mixed nonparenchymal cells were incubated with 10 μL/mL of rat anti-CK19-polyethylene (PE), anti-THY1-PE, anti-GFAP-PE, anti-CK31-PE, anti-CD68-PE, anti-CD161a-PE, or anti-CD11c-PE (all antibodies from Miltenyi Biotec) for 15 min at 4°C, and then with 10 μL/mL of rat anti-PE MACS microbeads (Miltenyi Biotec) for another 15 min. Then, cell suspension was loaded onto the separation column and allowed to flow naturally. After the magnetic field was removed, the obtained solutions washed by PBS buffer at 4°C were the suspension for BECs, OCs, HSCs, SECs, KCs, PCs, and DCs, respectively.
Immunocytochemistry and Western blotting analysis
A few purified hepatocytes were fixed in glass slides with 10% formaldehyde for 30 min, and then microwave antigen retrieval was performed when dried. Then, the sections were incubated individually with a 1:200 dilution (V/V) of anti-ALB and G6PC antibodies (Santa Cruz) overnight at 4°C and then with a 1:5,000 (V/V) diluted biotin-labeled secondary antibody (Zhongshan Goldenbridge Biotechnology Co., Ltd., Beijing) at 37°C for 60 min. Finally, streptavidin–biotin complex (SABC) hybridization was performed at 37°C for 30 min and the sections were observed and analyzed under an optical microscope. Similarly, BECs were identified by CK18 and GGT1, OCs by OC2 and OV6, HSCs by DES and VIM, SECs by CD14 and ET-1, KCs by LYZ and ED2, PCs by CD8 and CD56, and DCs by CD86 and CD103 antibodies (all antibodies 1:200 dilution, Santa Cruz) with the method of immunocytochemistry. Furthermore, the above-mentioned antibodies were also applied to identify above eight hepatic cell types by Western blot according to Towbin's method (Towbin et al., 1979) and, finally, protein bands were visualized with Amersham ECL substrates. The relative abundance of target proteins was measured by image analysis using ImageQuant TL software, and β-actin (Sigma, 1:1,000) was served as an internal reference.
Microarray detection and data analysis
Transcription profiles of eight kinds of regenerating hepatic cells were individually determined by Rat Genome 230 2.0 chips as previously described, including cDNA synthesis, in vitro transcription, cRNA hybridization, microarray wash, and image scanning (Wang and Xu, 2011). After microarray detection, the generated images were converted into normalized signal values, signal detection P, and experiment/control ratios by using Affymetrix GCOS 2.0 software. Specifically, the images were initially converted into signal values and detection P values for each array. Then, the data of each array were normalized through scaling all signals to a target intensity of 200. When detection P-value was < 0.05, it meant the gene was present (P); when P > 0.05, it meant the gene was marked absent (A). Furthermore, the normalized signal values in experimental groups (including PH groups and OC groups) to that in the NC group were used to calculate the ratio value or fold change. When the ratio value is ≥2, it means that gene expression was significantly up-regulated; when ≤0.5, it means significantly down-regulated; and when 0.5–2, it means biologically insignificant. In order to reduce the analytical error of microarray, this study detected each sample at least three times and regarded the average value of three relative values as a credible value. In addition, only the genes, which significantly changed at least at one time point during LR with significant difference (0.01 < P > 0.05) or extremely significant difference (P > 0.01) between PH and OC groups, were referred to as LR-associated genes.
Quantitative real-time PCR (qRT-PCR)
To verify the chip data, a total of 16 target genes including eight marker genes and eight common functional genes were selected. The eight marker genes were g6pc, ggt1, oc2, vim, cd14, cd68, cd161a, and cd40 (marker genes for eight hepatic cell types, respectively), and the eight common functional genes were jun, ttr, icam1, apoe, myc, pcna, trim24, and b2m. The primers were designed with Primer Premier 5.0 based on the mRNA sequences of above 16 genes from GeneBank, and Table 1 listed the primers synthesized by Beijing SUN Biotech Co., Ltd. qRT-PCR was carried out as described previously by using SYBR® Green I (Wang and Xu, 2010b), and the relative expression changes of target genes were computed according to that of internal control β-actin.
| Genes | Accession numbers | Primer sequences | PCR products (bp) |
|---|---|---|---|
| g6pc | NM_013098 | FP: 5′-CTCAGGAACGCCTTCTATG-3′ | 182 |
| RP: 5′-ACGGAGCTGTTGCTGTAAT-3′ | |||
| ggt1 | NM_053840 | FP: 5′-TCTTCCAACCCAGCATCCAA-3′ | 109 |
| RP: 5′-CACAAAGCAGGTGTCTTCTCAA-3′ | |||
| oc2 | XM_008772203 | FP: 5′-TCCGCAGGATGTGGAAGTGG-3′ | 154 |
| RP: 5′-CGGCGTTGGAGGTCCGTGAA 3′ | |||
| vim | NM_031140 | FP: 5′-CTTGAACGTAAAGTGGAATCCT-3′ | 135 |
| RP: 5′-GTCAGGCTTGGAAACGTCC | |||
| cd14 | NM_021744 | FP: 5′-AATCCCAGTCGGAGGCGTAT-3′ | 153 |
| RP: 5′-CCAGGACCCTCAGAAACCAG-3′ | |||
| cd68 | NM_001031638 | FP: 5′-TCAAACAGGACCGACATCAGA-3′ | 195 |
| RP: 5′-GGTGAATTGCTGGAGAAAGAAC-3′ | |||
| cd161a | NM_001010964 | FP: 5′- CCCTGGTTGGGATGAGTATTT-3′ | 120 |
| RP: 5′-GGCACTTTAACTTAGCTGGAC-3′ | |||
| cd40 | NM_134360 | FP: 5′-GCTGGTCATTCCTGTCGTGAT-3′ | 171 |
| RP: 5′-ACTGGAGCAGCAGTGTTGTG-3′ | |||
| jun | NM_021835 | FP: 5′-TGCAAAGATGGAAACGACCTT-3′ | 76 |
| RP: 5′-CCGTAGGCGCCACTCT-3′ | |||
| ttr | NM_012681 | FP: 5′-ATCGTACTGGAAGGCTCTTGGC-3′ | 131 |
| RP: 5′-CAGTGGTGCTGTAGGAGTAC-3′ | |||
| icam1 | NM_012967 | FP: 5′-TCAAACGGGAGATGAATGGT-3′ | 188 |
| RP: 5′-CCTCTGGCGGTAATAGGTGT-3′ | |||
| apoe | NM_138828 | FP: 5′-CCTGAACCGCTTCTGGGATT-3′ | 65 |
| RP: 5′-GCTCTTCCTGGACCTGGTCA-3′ | |||
| myc | NM_012603 | FP: 5′-GAGGAGAAACGAGCTGAAGCG-3′ | 126 |
| RP: 5′-TGAACGGACAGGATGTAGGC-3′ | |||
| pcna | NM_022381 | FP: 5′-ACTTGGAATCCCAGAACAGG-3′ | 100 |
| RP: 5′-CACAGCATCTCCAATATGGC-3′ | |||
| trim24 | NM_001044266 | FP: 5′-CAGTGGGAGGGTCTTACAATC-3′ | 107 |
| RP: 5′-CTGGCCAGGGTCTACACTTG-3′ | |||
| b2m | NM_012512 | FP: 5′-TTCCACCCACCTCAGATAGAAAT-3′ | 115 |
| RP: 5′-TGTGAGCCAGGATGTAGAAAGAC-3′ |
Functional enrichment analysis of OPN signaling pathway-related genes
Based on the established OPN signaling network (Figure 1), we entered “integrin signaling pathway”, “PI3K/AKT signaling pathway” and “JAK/STAT signaling pathway” into the “Pathway and function” module of IPA software to obtain the proteins in every corresponding signaling pathway, and the above results were filtered by researching signaling maps at the databases including GenMAPP, KEGG, BIOCARTA, QIAGEN, and Biocompare and, then, the signaling stream and members in OPN-mediated pathway were reconfirmed through retrieving several pertinent articles. Then, we compared the above OPN signaling pathway-related genes with LR-associated genes in eight kinds of hepatic cells, and then obtained the expression changes of genes related to both OPN signaling pathway and LR in eight hepatic cell types. In order to characterize the expression profiles of the above genes, this study employed hierarchical-means (H-means) to classify the significantly changed genes according to gene expression similarity in different hepatic cell types. To further investigate the possible physiological processes regulated by OPN signaling, the OPN pathway-related genes and their expression extrema in eight kinds of hepatic cells were entered into IPA for core analysis, and the enriched bifunctions were obtained in “Diseases and Functions” module and further analyzed by comparison analysis among eight hepatic cell types. Thereafter, only the bifunctions with the z-score value >2 were picked out and exported (Kramer et al., 2014) and then were used for further clustering analysis by H-means.
Function prediction of every branch of OPN-mediated signaling pathway in eight hepatic cell types
To expound the regulatory role of OPN signaling pathway in LR, the genes associated with each branch of OPN signaling pathway were respectively collected and, then, their expression changes in eight liver cell types were obtained for further analysis. Then, IPA software was utilized to analyze the heatmap of biofunctions based on the expression changes of each branch-related genes using comparison analysis (Geng et al., 2014). Briefly, the differentially expressed each branch-related gene symbols and their corresponding expression extrema in eight liver cell types were uploaded to the “Dataset Files” of IPA. Then, core analysis and comparison analyses among eight liver cell types proceeded successively. Next, heatmaps of biofunctions were obtained in the model of “Diseases and Functions,” and every heat map square can be clicked to display the network and the possible crucial genes in the network. Finally, only the biofunctions with z-score > 2 were selected to produce ultimate heatmap of biofunctions in every branch.
Results
Identification and microarray detection of eight hepatic cell types during LR
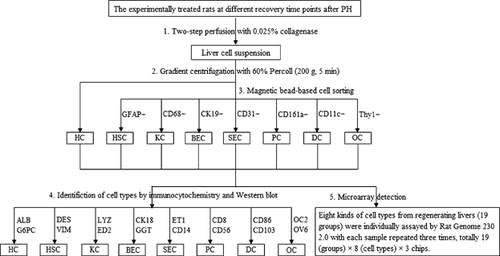
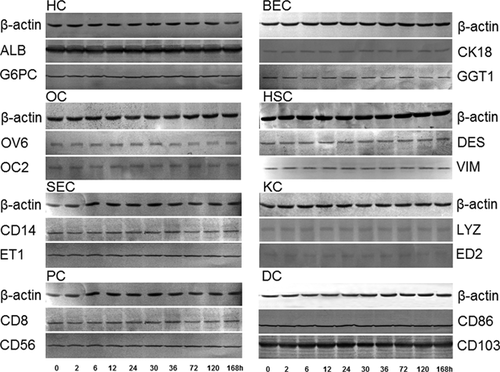
The procedures for isolation, identification, and microarray detection of eight hepatic cell types were indicated as a flow chart in Figure 2. Briefly, four rats in every group (totally 19 groups) were anesthetized at corresponding recovery time points after PH, respectively, and the scattering of mixed liver cell suspension was prepared according to the conventional two-step method with 0.025% collagenase. Then, hepatocytes were isolated by gradient centrifugation with 60% Percoll, and sorting of other seven cell types except hepatocytes required magnetic bead method in addition to Percoll gradient centrifugation. For each type of liver cell at one time point, a few purified cells were identified by immunocytochemical and Western blotting analysis, and other cells were used to detect gene expression profiles by microarray with each sample repeated three times. Totally, the required chips in this study were 19 (groups) × 8 (cell types) × 3 chips. Immunocytochemical analysis elucidated that the eight hepatic cell types were highly purified as described in our previous studies (Chen et al., 2010a; Wang and Xu, 2010b). Furthermore, above eight kinds of isolated hepatic cells were also identified by Western blotting using the corresponding protein markers. As displayed in Figure 3, except LYZ and ED2 in KCs, other marker proteins were clearly detected by their corresponding antibodies. Obviously, ALB and CD103 were strongly positive in HCs and DCs, respectively, with thick bands of proteins. On the whole, the expressions of marker proteins in every cell type did not exhibit significant changes at 10 time points after rat PH, suggesting that the above eight hepatic cell types were prepared with high purity.
Validation of chip results by qRT-PCR
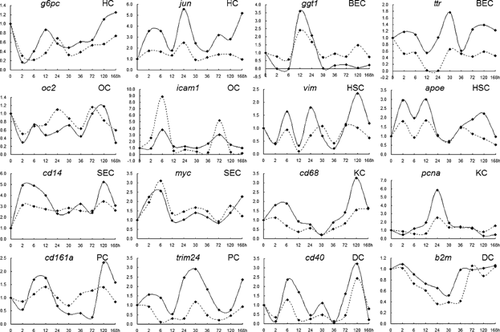
qRT-PCR method was applied to assay the expression changes of several marker genes including g6pc for HCs, ggt1 for BECs, oc2 for OCs, vim for HSCs, cd14 for SECs, cd68 for KCs, cd161a for PCs, and cd40 for DCs in order to confirm the reliability of microarray. Moreover, several common functional genes including jun, ttr, icam1, apoe, myc, pcna, trim24, and b2m were also selected to detect their expression changes in the above eight kinds of hepatic cell types, respectively. It meant that one marker gene and one functional gene were designed for a corresponding hepatic cell type. Furthermore, among the eight selected functional genes, jun and myc were downstream transcription factors in OPN-mediated signaling pathway. Figure 4 illustrated that there were no remarkable differences in the expression changes of target genes including jun in HC and myc in SEC by qRT-PCR and gene chip detection.
Expression profiles of OPN signaling pathway-associated genes in eight hepatic cell types during LR
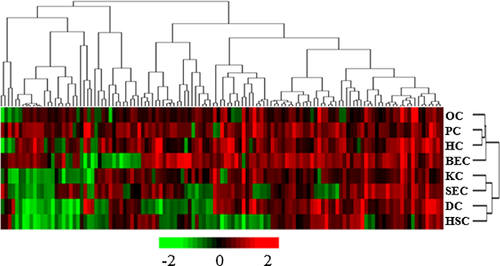
In this study, the module of “Pathway and function” in IPA software and several database including GenMAPP, KEGG, BIOCARTA, QIAGEN, and Biocompare, etc. were mainly relied on to build the interaction network of OPN signaling pathway. The results showed that five branches including 184 genes were involved in OPN-mediated signaling pathway. After detected by microarray, a total of 123 genes were found to be associated with LR. Among them, 93 genes were significantly changed in PCs, 98 in SECs, 96 in HSCs, 75 in KCs, 101 in DCs, 111 in BECs, 63 in OCs, and 86 in HCs (Supplementary Table 1). Furthermore, the numbers of significantly changed OPN signaling pathway-related genes at 10 time points were counted in eight hepatic cell types respectively, and the result revealed that the expression peaks of OPN signaling pathway-related genes occurred at different time points in various cell types and that of PCs and SECs were at 6 h, HSCs and KCs at 12 h, DCs and BECs at 24 h, OCs at 30 h, and HCs at 72 h (Table 2), indicating various cell types may play distinct roles during liver regeneration. To comprehensively compare the expression differences of OPN pathway-related genes in eight hepatic cell types, we employed H-means clustering to classify the above 123 genes, and the results indicated that the number of up-regulated genes in HCs, PCs, OCs, and BECs were more than that of the down-regulated, and the above four cell types were clustered in one major branch of the tree diagram. However, the majority of genes were down-regulated in other four cell types and, thereby, KCs and SECs, DCs, and HSCs were clustered together, respectively (Figure 5). Therefore, HCs, PCs, OCs and BECs, KCs and SECs, DCs, and HSCs shared the most similar patterns of genes, respectively, which may indicate the close correlations and great differences in functions among various hepatic cell types during rat LR.
| Recovery time points (h) after partial hepatectomy | ||||||||||
|---|---|---|---|---|---|---|---|---|---|---|
| Cell types | 2 | 6 | 12 | 24 | 30 | 36 | 72 | 120 | 168h | Total |
| PCs | 28 | 50 | 25 | 33 | 38 | 38 | 49 | 37 | 27 | 93 |
| SECs | 28 | 49 | 28 | 28 | 31 | 32 | 24 | 31 | 30 | 98 |
| HSCs | 57 | 16 | 58 | 26 | 18 | 43 | 22 | 26 | 25 | 96 |
| KCs | 19 | 28 | 37 | 34 | 31 | 30 | 20 | 19 | 26 | 75 |
| DCs | 24 | 43 | 41 | 64 | 37 | 53 | 22 | 22 | 23 | 101 |
| BECs | 48 | 63 | 74 | 74 | 45 | 21 | 20 | 50 | 26 | 111 |
| OCs | 19 | 22 | 23 | 20 | 25 | 23 | 17 | 24 | 23 | 63 |
| HCs | 27 | 35 | 39 | 33 | 37 | 32 | 57 | 36 | 24 | 86 |
- PCs, pit cells; SECs, sinusoidal endothelial cells; HSCs, hepatic stellate cells; KCs, Kupffer cells; DCs, dendritic cells; BECs, biliary epithelia cells; OCs, oval cells; HCs, hepatocytes. Dark gray fields represent the expression peaks in every cell type with the most number of significantly-changed genes.
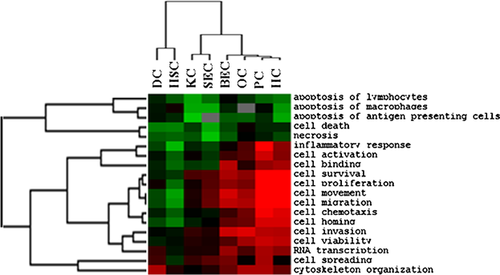
Function enrichment analysis of OPN signaling pathway-associated genes in eight hepatic cell types during LR
The probe numbers of OPN signaling pathway-related genes and their corresponding expression extrema in eight liver cell types were entered into IPA software for core analysis and comparison analysis among individual liver cell types, and then H-means were used for clustering the bifunctions with z-score value > 2. The results suggested that apoptosis, cell death, and necrosis were extensively attenuated in eight liver cell types, especially in KCs and SECs; cell proliferation, activation, migration and movement, inflammation response, and chemotaxis were remarkably augmented in HCs, PCs, OCs, and BECs but significantly inhibited in HSC; skeleton reconstruction, cell spreading, and RNA transcription were promoted to various degrees in most of cell types. Based on the similarities of GO categories presented by the dendrogram, HCs, PCs, OCs, and BECs were clustered together, while KCs and SECs, DCs, and HSCs were in one cluster, respectively, because the majority of physiological categories were inhibited (Figure 6). Notably, the dendrograms presented by Figures 5 and 6 resembled each other, indicating that the differences in OPN signaling pathway, regardless of reflected by gene expression profiles or physiological activities, were consistent among eight kinds of hepatic cells.
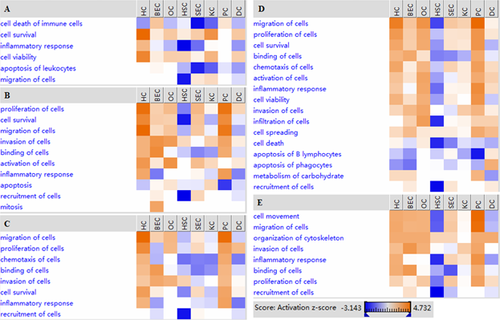
Regulatory roles of each branch of OPN signaling pathway in eight hepatic cell types
To obtain preliminary insights into the potential mechanisms of OPN signaling pathway in LR, LR-related genes in each branch of OPN signaling pathway were respectively collected (Table 3), and their expression extreme values were entered into IPA software for “Core analysis” and “Comparison analysis” and, thereby, the functional heatmaps of each branch were predicted and obtained in eight hepatic cell types (Figure 7). Obviously, JAK/STAT signaling branch mainly promoted survival and viability of HCs and KCs but inhibited inflammation and cell migration in HSCs and apoptosis and death in most cell types. ERK1/2 branch principally participated in boosting proliferation of most cell types except HSCs, survival of most cell types except KCs, HSCs and DCs and inflammation in HCs and PCs but inhibited apoptosis of most cell types including PCs. Overall, the regulatory roles of JNK branch were similar to that of ERK1/2, though JNK branch was weaker than ERK1/2 in promoting cell proliferation and inhibiting apoptosis. Remarkably, NF-κB branch inhibited apoptosis and death in most cell types and almost all physiological processes in HSCs but reinforced proliferation, survival, activation, and inflammation and its related cell movement in HCs, PCs, OCs, and BECs. RhoA-ROCK branch mainly took part in skeleton reconstruction, thereby strengthening movement and migration of most cell types, while strongly inhibiting the physiological processes in HSCs.
| Cell types | ||||||||
|---|---|---|---|---|---|---|---|---|
| OPN-mediated pathways | HCs | BECs | OCs | HSCs | SECs | KCs | PCs | DCs |
| JAK/STAT pathway | 11 | 10 | 9 | 11 | 8 | 11 | 5 | 12 |
| ERK1/2 pathway | 32 | 46 | 21 | 37 | 42 | 27 | 37 | 42 |
| JNK pathway | 28 | 39 | 15 | 32 | 34 | 22 | 32 | 33 |
| NF-kB pathway | 32 | 41 | 23 | 33 | 39 | 31 | 37 | 41 |
| RhoA-ROCK pathway | 50 | 62 | 39 | 55 | 55 | 44 | 53 | 55 |
| Total | 86 | 111 | 63 | 96 | 98 | 75 | 93 | 101 |
Discussion
OPN, as a highly phosphorylated chemokine-like protein, was closely associated with the occurrence of various liver diseases via promoting inflammation, cell activation, proliferation, and migration. Moreover, OPN was even found to induce the activation of hepatic stem cells during liver regeneration (LR) (Arai et al., 2004, 2006). LR is considered as a compensatory hyperplasia process, including cell proliferation and activation, and is usually accompanied by inflammation and immunity (Markiewski et al., 2006). After all, the liver is composed of various cell types including HCs, BECs, HSCs, SECs, KCs, PCs, and DCs, except for hepatic stem cells. On the other hand, OPN could function via PI3K/Akt, MAPK, and NF-κB signaling cascades. Therefore, whether OPN or OPN-mediated signaling pathway could modulate other cell types during LR is still unknown.
To uncover the possible regulatory effects of OPN signaling pathway on various hepatic cell types during LR, this study isolated and purified eight hepatic cell types from regenerating livers, detected the expression profiles of OPN-mediated signaling pathway-related genes in above-mentioned liver cell types, and applied IPA software to predict the enriched physiological activities. As a result, the physiological processes possibly regulated by OPN signaling pathway were significantly diverse in different cell types, and OPN signaling pathway may be closely related to HCs, OCs, BECs, and PCs but has less regulatory effect on SECs, KCs, HSCs, and DCs during rat LR.
Several researches have confirmed that OPN could inhibit apoptosis and promote survival of NKT cells, neutrophiles, macrophagocytes, and hepatoma carcinoma cells (Wang and Denhardt, 2008; Kiefer et al., 2010; Wu et al., 2012). In this study, OPN was up-regulated in almost cell types with greater than 10-fold overexpression in HCs, KCs, PCs, and DCs, and the expressions of anti-apoptosis genes Bcl2 and Bcl2l1 were also reinforced in most cell types, which is partially consistent with the report of Patouraux et al. (2014). Figures 6 and 7 illustrated that apoptosis, necrosis, and cell death regulated by OPN were significantly attenuated, suggesting that OPN might inhibit apoptosis in rat regenerative livers. Moreover, several physiological processes including cell proliferation, activation and survival, cytoskeleton reorganization, cell movement and migration, inflammation reaction, and chemotaxis were to different degrees activated in HCs, OCs, BECs, and PCs (Figure 6). HCs and BECs are hepatic parenchymal cells, whereas OCs, as one kind of hepatic stem cells, could be induced to proliferate rapidly and differentiate into BECs and HCs when liver was severely damaged or liver cell proliferation ability was restricted (Tanimizu and Mitaka, 2014). The transforming relationships mentioned above could partly explain the similar activities of OPN signaling pathway in HCs, OCs, and BECs. PCs, as liver-specific NKT cells, were essential for hepatic defense response (Xu et al., 2011c). OPN signaling pathway could promote secretion of various cytokines, and then modulate inflammation and immune reaction (Wang and Denhardt, 2008). Furthermore, there were several reports demonstrating that OPN could bind on the surface of immune cells and modulate chemotaxis of these cells (Koh et al., 2007; Vetrone et al., 2009). Therefore, OPN signaling pathway may be very important for PCs. In this study, the majority of OPN signaling pathway-related genes were found to be up-regulated and, thereby, cell activation, migration, invasion and chemotaxis were predicted to be strongly enhanced in PCs, suggesting OPN may have great effects on PCs during LR.
The expression peak of OPN signaling pathway-related genes appeared at 6 h in PCs, but it exhibited at 72 h in HCs (Table 2), which may be caused by the different dominant functions of OPN specifically in the above two cell types. The most important role of OPN signaling pathway in PCs was to promote inflammation response (Locatelli et al., 2013), cytoskeleton reorganization, and spreading, which was similar to the report of Xu et al. (2011c). However, its role was to inhibit apoptosis and promote cell proliferation in HCs (Figure 6), which agreed with the viewpoint of Patouraux et al. (2014). JAK/STAT signaling cascade was necessary for cell survival (Wu et al., 2014). However, the effects of JAK/STAT branch on HCs and PCs were significantly different during liver regeneration with enhanced cell survival and activation in HCs and little regulatory role for PCs (Figure 7), which was consistent with the result of Chen et al. (2010b). Surprisingly, the mitosis in BEC was evidently enhanced, but the proliferation of BECs was not activated as the former, which deserved further experimental studies.
SECs were similar to KCs in terms of expression profiles of OPN pathway-related genes (Figure 5). In addition, the OPN-modulated physiological activities including cell proliferation and survival, cell spreading, invasion, and migration were slightly increased in both of the above two cell types (Figures 6 and 7). The obvious difference between SECs and KCs was that the activation of ERK1/2 and JNK branches in SECs was stronger than that in KCs and, thereby, ERK1/2 and JNK branches may play critical roles in promoting the survival and proliferation of SECs (Figure 7). Hang et al. (2012) found ERK signaling pathway could facilitate the survival and proliferation of SECs, which is partly in accordance with our result. On the other hand, cell survival regulated by JAK/STAT branch was more activated in KCs than that in SECs during LR, whereas Chen et al. (2010b) showed that IFN-γ-induced JAK/STAT pathway genes were down-regulated particularly in KCs, and then might lead to the attenuation of apoptosis induction in KCs during rat LR. The above results inferred that different ligands (OPN and IFN-gamma) could activate JAK/STAT signaling pathway but have distinct effects on apoptosis in KCs during LR. Moreover, cell invasion in KCs, modulated by ERK1/2, NF-κB, and Rock-RhoA branches, was stronger than that of SECs. This result may to some extent confirm the fact that OPN could activate KCs and then promote inflammation (Yang et al., 2011). Furthermore, it seemingly supported the conclusion that the activation of KCs and its related inflammation were mainly regulated by NF-KB, ERK, and JNK branches (Wu et al., 2012a).
Furthermore, gene expression profiles of HSCs and DCs resembled each other, accompanied by more down-regulated genes than the up-regulated, but the inhibition of physiological processes in HSCs was stronger than that in DCs. Inflammation, cell chemotaxis, invasion, and migration in HSCs were significantly inhibited through JAK/STAT, NF-κB, and Rock-RhoA branches. However, Seth et al. (2014) demonstrated that OPN could mediate the activation of HSCs in alcoholic liver diseases. Thus, it is inferred that OPN signaling cascade might inhibit inflammation in HSCs during LR, which was not contrary to our previous report that HSCs had suppressed immunity/inflammation after PH in rats (Xu et al., 2011b). With respect to the effects of OPN on DCs, Shao et al. (2014) revealed that OPN had a pro-chemotactic sequence for DCs and could promote the migration of DCs. On the contrary, Umemura et al. found that OPN suppressed the DC migration to lymph nodes in immune response (Begum et al., 2007). One of our previous studies also indicated that the attenuated ability of producing chemokines and proinflammatory factors for DCs may lead to its weak inflammatory activities during LR (Xu et al., 2011a). In this study, inflammation response, chemotaxis, and migration in DCs were significantly inhibited through JAK/STAT, ERK1/2, and JNK branches, suggesting OPN signaling pathway might be responsible for the reduced inflammation and cell migration in DCs during LR.
Conclusions
In summary, to our knowledge it is the first time we discussed the possible relationship between OPN signaling pathway and rat liver restoration at cellular level. In our study, high-throughput analysis was utilized to measure and compare the expression pattern of OPN signaling pathway genes among eight hepatic cell types. The study findings demonstrated that the majority of OPN pathway-related genes were up-regulated in HCs, PCs, OCs, and BECs but down-regulated in other four cell types including SECs, KCs, DCs, and HSCs. In addition, functional enriched analysis indicated that OPN signaling pathway may promote cell proliferation, activation, migration, and inflammation in HCs, OCs, BECs, and PCs, and slightly boost proliferation and migration of SECs and KCs, but inhibit inflammation response and chemotaxis in SECs and KCs and almost all physiological processes in DCs and HSCs. It is supposed that our study may provide some data for modulating liver regeneration through OPN-mediated signaling pathway at cellular level. However, the conclusion is drawn mainly based on the microarray data and bioinformatics analysis, and there is no direct cause–effect relationship between gene profiling and the conclusion. Therefore, in order to prove that those changes in eight hepatic cell types are truly dependent upon OPN, experiments of OPN overexpression or knockdown and one or more cell types depletion are needed to further analyze the regulatory effects of OPN signaling pathway on regenerating livers in future.
Acknowledgements and Funding
We thank Dr. Wenbo Wang for preparing experimental materials, Dr. Cuifang Chang for her data anlysis, and Mrs. Jihong Zhang for her hard work during the revision of this manuscript. This study was funded by the National Natural Science Foundation Project [No. 81200317], the doctoral Scientific Research Start-up Foundation of Henan Normal University [No. 11128], and the Youth Science Foundation of Henan Normal University [No. 2013qk12].


