Acetazolamide triggers death inducing autophagy in T-47D breast cancer cells
Abstract
The inhibitory effects of acetazolamide on the growth and proliferation of epithelial breast cancer cells (T-47D) were investigated. Analysis of morphological changes indicated little apoptosis in T-47D cells incubated with acetazolamide, according to data from flow cytometry, DNA laddering, and expression of AIF. However, an increase in caspase-3 activity was detected in cells. This was concomitant with an increase in DFF45/DFF40 ratio leading to inhibition of caspase-3 activity, DNA fragmentation and progression of apoptosis. Flow cytometry also confirmed that acetazolamide had no significant effect on cell cycle progression. These results are consistent with lack of change in the expression of cell cycle regulatory proteins p21, p27, cdc2 and cyclinD1. Increased expression of ATG5, p53 and DRAM, along with an increase in BCLN1/Bcl-2 ratio, indicated that acetazolamide inhibited the proliferation of T-47D cells by inducing autophagy. Increased expression of PTEN, along with decreased expression of Akt1, also showed that acetazolamide treatment resulted in death inducing autophagy. Collectively the results indicate that autophagy is an adequate mechanism mediating the anti-cancer effects of acetazolamide in T-47D cells through engagement of p53/DRAM pathway and attenuation of Akt survival signalling.
Abbreviations
-
- Bax
-
- Bcl-2-associated X protein
-
- Bcl-2
-
- B-cell lymphoma 2
-
- DFF
-
- DNA fragmentation factor
-
- CAD
-
- caspase activated DNase
-
- iCAD
-
- inhibitor of caspase activated DNase
-
- AIF
-
- apoptosis inducing factor
-
- ATG5
-
- autophagy gene 5
-
- BCLN1
-
- Bcl-2 interacting protein or beclin1
-
- DRAM
-
- damage-regulated autophagy modulator
-
- AKT
-
- v-akt murine thymoma viral oncogene homolog
-
- PTEN
-
- phosphatase and tensin homolog
-
- DNA-PK
-
- DNA-dependent protein kinase
-
- GAPDH
-
- glyceraldehyde-3-phosphate dehydrogenase
-
- PARP1
-
- poly ADP-ribose polymerase 1
-
- Cdc2
-
- cell division cycle protein 2
-
- RT-PCR
-
- reverse transcriptase-polymerase chain reaction
Introduction
Sulphonamides are propounded as anti-metabolites due to their structural similarities with para-aminobenzoic acid used for the treatment of systemic bacterial infections (Seydel, 1968; Gennaro, 1990). The structure–activity relationship studies have demonstrated the existence of two groups of sulphonamides with anti-tumour activity, E7070 and E7010 (Mohan et al., 2006). These compounds exhibit anti-tumour effects by targeting the G2/M and G1/S phases of the cell cycle (Owa et al., 1999; Fukuoka et al., 2001; Ozawa et al., 2001). The cell cycle mechanisms of E7010 action are linked to prevention of the tubulin polymerisation (Supuran et al., 2003). New sulphonamide derivatives with anti-metalloprotease activity have also been reported with anti-viral, anti-tumour and anti-inflammatory effects (Supuran et al., 2003). Caspase inhibition by some sulphonamide derivatives can prevent apoptosis in some cancer cells (Supuran et al., 2003). This characteristic of sulphonamides is completely different from their commonly reported actions, induction of cell death and cell cycle arrest, making them useful in cancer therapy (Fukuoka et al., 2001; Ozawa et al., 2001; Mohan et al., 2006).
Acetazolamide or Diamox (C4H6N4O3S2) is a member of the sulphonamide drug family with carbonic anhydrase inhibitory activity, and is used in treatment of glaucoma and epilepsy. Acetazolamide does not have any anti-bacterial effect, and in this way it is different from other members of the sulphonamide family. Because of its low solubility in water, its sodium salt is commonly used (Hauge et al., 1983; Reiss and Oles, 1996; Scozzafava et al., 1999; Kaur et al., 2002; Safarian et al., 2007). Aromatic sulphonamides, such as acetazolamide, methazolamide, ethoxozolamide, and bis-sulphonamides with carbonic anhydrase inhibitory activities (e.g. dichlorphenamide), have been used clinically for over 40 years (Schrier, 1976). Chegwidden and Spencer (1995) reported that acetazolamide (LC50 = 0.25 mM) and ethoxozolamide (LC50 = 0.5 mM) could prevent cancer cell proliferation via carbonic anhydrase inhibition.
It is now clear that the toxic effects of sulphonamide family on different cancer cells are mediated through different cellular and molecular mechanisms. The tumours formed in the milk ducts of the breast are often malignant with an invasive potency towards other tissues. Here our efforts were focused on T-47D cells, a line of ductal epithelial cells from human breast tumour, to determine the mechanisms of sodium acetazolamide anti-tumour effects. We determined whether this drug exerts its anti-tumour effects through the previously reported common anti-proliferative mechanisms, apoptosis and cell cycle arrest, or other cellular mechanisms recently reported (Mohammadpour et al., 2012, 2013).
Materials and methods
Materials
Roswell Park Memorial Institute Medium 1640 (RPMI 1640) and fetal bovine serum (FBS) were from Gibco (England). Streptomycin and penicillin were purchased from Roche (Germany). 3-[4,5-dimethylthiazol-2-yl]-2,5-diphenyl tetrazolium bromide (MTT) was from Sigma (England). DNA Laddering kit, Annexin-V-FLOUS Staining Kit, Propidium Iodide (PI) kit, mRNA extraction kit, caspase-3 fluorometric immunosorbent enzyme assay kit, 4′,6-diamidino-2-phenylindole (DAPI) kit were all obtained from Roche. One step Maxime RT-PCR PreMix kit was from iNtRON Biotechnology (Korea). QuantiFast SYBR Green PCR master mix and total RNA extraction kit were provided from Qiagen (USA). cDNA generation was carried out with RevertAid™ M-MuLV reverse transcriptase and random hexamer primer both prepared by Fermentas (Germany). Primers were obtained from TAG Copenhagen Company (Denmark). Agarose was from Promega (USA). Gene Ruler Ladder Mix was purchased from Fermentas. Sodium salt of acetazolamide and doxorubicin were from Aventis Pharma (Canada) and Ebewe Pharma (Austria), respectively.
Cell culture
T-47D cells were purchased from the Cell Bank of Pasteur Institute (Tehran, Iran; ATCC number HTB-133). Cells were cultured in RPMI 1640 medium, supplemented with 10% FBS and 1% penicillin/streptomycin, in a humidified atmosphere of 5% CO2 in air at 37°C. Cells (80% confluency) were incubated with acetazolamide (LC50 = 26 mM) or doxorubicin (LC50 = 0.337 × 10⁻³ mM) for 48 h in a humidified incubator under the cited conditions.
MTT assay
The effect of acetazolamide and doxorubicin on cell viability was determined using MTT assay. Briefly, cells (1 × 10⁴) were plated in each well of 96-well cell culture plate. The activity of the mitochondrial respiratory enzymes was assayed in three different plates after 24, 48 and 72 h incubation with different concentration of drugs using MTT reagent (100 µg/well). After 3 h incubation, produced formazan was dissolved in 100 µL of dimethyl sulfoxide (DMSO) and quantified using a microplate reader (Rayto-China) at 570 nm. Cell viability was calculated as percent values relative to the control.
Quantification of apoptosis by flow cytometry
To quantify drug-induced apoptotic cell death, Annexin V-FITC and propodium iodide (PI) staining was performed as recommended by the manufacturer and analysed by flow cytometry (PartecPass instrument, USA) using FloMax software. We determined the major cell distribution regions by drawing the common two-dimensional plots of side scattering (SSC) against forward scattering (FSC) without the use of any fluorescent dye. All calculations were performed in the selected regions through drawing of a polygonal gate (gate R1). The necessary calculations were next carried out on the four squared regions of Q1 through Q4 using the drawn two-dimensional plot of Annexin V-FITC against PI. The Q1–Q4 square regions represent cells with following characteristics: Annexin V-FITC− and PI+ (Q1; necrotic cells), Annexin V-FITC+ and PI+ (Q2; late apoptotic cells), Annexin V-FITC− and PI− (Q3; live cells), and Annexin V-FITC+ and PI− (Q4; early apoptotic cells) (Hsu and Yen, 2006; Dowejko et al., 2009; LaPensee et al., 2009).
Cell cycle analysis by flow cytometry
Cell cycle distribution was analysed by measuring cellular DNA content using flow cytometry after DAPI staining. Following drug exposure for 48 h (26 mM and 0.337 × 10⁻³ mM of acetazolamide and doxorubicin, respectively), 5 × 10⁵ cells were collected, washed and stained with 1 mL fluorochrome solution (10 μg/mL DAPI and 6% Triton X-100 in PBS). Cells were incubated in the dark for 30 min at 4°C. The blue fluorescence of the single events was recorded using flow cytometry at 359 nm excitation and 461 nm emission wavelengths to measure DNA index.
Morphological analysis of apoptotic cells by fluorescence microscopy
Analysis of phosphatidylserine located on the outer leaflet of the apoptotic cell membrane was performed by Annexin-V-fluorescein isothiocyanate (Annexin V-FITC) and propidium iodide (PI) staining kit. Briefly, cells were cultured on coverslips and incubated with acetazolamide for 48 h at the LC50 dose. Following incubation, the medium was removed and the coverslips were covered with Annexin-V-FITC/PI staining solution (20 μL of each provided stain solution transferred into 1 mL of HEPES buffer) for 10–15 min in the dark, and the cells were examined under the fluorescence microscope (Carl Zeiss, Germany) using an excitation range of 450–500 nm and green detection range of 515–565 nm.
Caspase-3 activity assay
Caspase-3 activity was assayed using a fluorometric immunosorbent enzyme assay kit. Caspase-3 activity was determined using AC-DEVED-AFC substrate, which is cleaved proportionally to the amount of the activated enzyme. The concentration of the free fluorescent AFC, generated from substrate, was measured by a fluorospectrophotometer (HITICHI model MPF4-Japan) with the excitation and emission wavelengths of 400 and 505 nm, respectively.
DNA laddering assay
To detect fragmented DNA in drug-treated cells apoptotic DNA Ladder kit was used. Lysate from 2 × 10⁶ cells were collected, poured into a filter tube and centrifuged at 8,000 rpm for 1 min to separate DNA molecules. The filter-bound DNA was then washed twice, and DNA was eluted from the filter tube at the final step and collected by centrifugation. Quantity and quality of DNA was subsequently determined by Nanodrop (Thermoscientific, USA). The sample was then electrophoresed at 75 V for 1.5 h in 1% agarose gel in Tris-burate buffer. Gels were stained with ethidium bromide and visualised under ultraviolet light and photographed with a transluminator (UVTEC Cambridge).
Quantitative reverse transcription-polymerase chain reaction and DNA gel electrophoresis
To compare the expression of the individual genes examined, RT-PCR was performed using the Maxime RT-PCR PreMix kit. The mRNA was isolated using the mRNA extraction kit (Roche). The utilised primers were designed using Gene Runner software and are listed in Supporting Information Table S1. The RT-PCR reaction mixture contained the following program: 0.1 µg mRNA, 1 µg (10 pmol/µL) of each primer, and water to total reaction volume of 20 µL. DMSO (20%) was used as enhancer to promote PCR reaction. Single step RT-PCR was performed as follows: reverse transcription, 45°C for 30 min and 94°C for 5 min; amplification, 35 cycles included denaturation at 94°C for 1 min and annealing at Tm for 1 min started with touchdown program (the first 10 annealing cycles initiated 5° above the Tm) and then extension at 72°C for 1 min; final extension at 72°C for 5 min. RT-PCR products were separated by electrophoresis (80 V) in horizontal agarose gel (1.5%) and Tris-acetate buffer. Gels were stained with ethidium bromide and visualised under ultraviolet light and photographed using a transluminator.
Real time quantitative RT-PCR
Real time RT-PCR was performed using total RNA extracted by Qiagen reagent kit. The utilised primers were designed using Beacon Designer software (see Supporting Information, Table S1). The two step real time PCR program was set as follows: first step for cDNA synthesis, 25°C for 10 min and 42°C for 1 h; second step for PCR, initial denaturation, 95°C for 5 min; amplification, 40 cycles included denaturation at 95°C for 10 s followed by annealing at Tm for 25 s followed by extension at 72°C for 30 s. Threshold cycle (CT) was calculated using the algorithm provided by Corbett rotor-gene 6000 software. For each cDNA, using ΔΔCT method, mRNA levels were normalised to GAPDH mRNA levels, the adequate reference gene, and finally expressed as the ratio of mRNA levels for the treated cells to that of untreated cells.
Statistical analysis
Statistical analysis relied on SPSS version 16 and Excel 2007 software. Statistical analysis for flow cytometry, caspase-3 activity and real time RT-PCR methods used One-way ANOVA test using Bonferroni correlation test. For quantitative RT-PCR, statistical differences among the treated and untreated cells were determined by Mann–Whitney U-test. Differences of P < 0.05 were considered statistically significant. The symbols * and ** indicate significant difference at P < 0.05 and P < 0.01, respectively.
Results
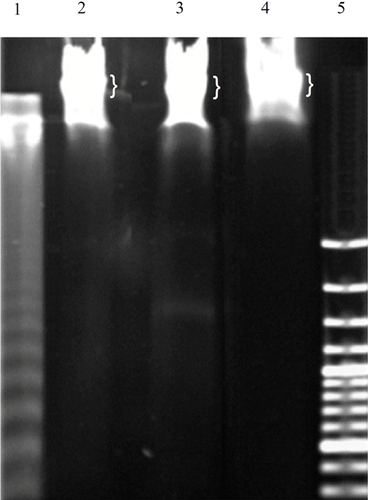
A 50% reduction in cell viability was observed in T-47D cells incubated with acetazolamide (26 mM) or doxorubicin (0.337 × 10⁻³ mM) for 48 h (see Figure S1). The doxorubicin anti-cancer effects on different cell types occur through distinct cellular processes including apoptosis and/or cell cycle arrest. It seemed that doxorubicin could be used as a positive control in our work. However, doxorubicin did not induce apoptosis but triggered cell cycle arrest (see below). Thus, doxorubicin could not be used as positive control in our work for assessment of apoptosis, but it could be utilised as a positive control for cell cycle arrest. The fragmentation of chromatin DNA is a common indication of conventional cell death, apoptosis and/or necrosis. In apoptosis, DNA fragments give a laddering pattern after separation by electrophoresis, which is distinguishable from the continuous pattern of DNA fragmentation observed in necrosis (Nagata, 2000). The DNA extract prepared from U937 cells incubated with camptothecin, which induces apoptosis in approximately 30% of the cells after 3 h of incubation, was used as positive control. Figure 1 shows the DNA laddering pattern in camptothecin-treated cells (lane1). However, no DNA laddering was observed in T-47D cells incubated with acetazolamide or doxorubicin (lanes 3 and 4). Thus, apoptosis did not occur when T-47D cells were incubated with acetazolamide or doxorubicin.
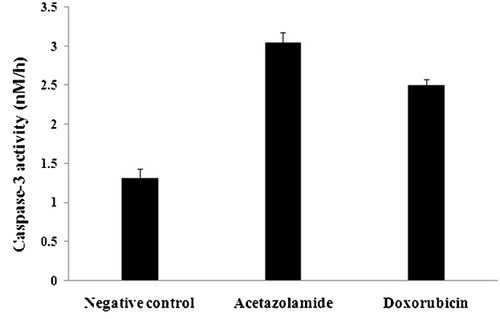
Caspase-3 is one of the most important executioner caspases during apoptosis (Nicholson and Thornberry, 1999). The effect of caspase-3 on the artificial substrate AC-DEVD-AFC results in liberation of AFC and production of emission photons. The recorded average fluorescence intensity, related to the liberated AFC, indicated that the velocity of the enzyme in the control, acetazolamide or doxorubicin-treated samples were 16.5 ± 1.42, 38.3 ± 1.71 and 31.6 ± 0.89 (mean ± SD) (ΔF, h−1, ΔF: mean fluorescent intensity alteration), respectively. Conversion of the enzyme velocity to enzyme activity was achieved by drawing a calibration curve for different concentrations of free AFC against the related fluorescence intensities. Using this calibration curve, the enzyme's activity in the control, acetazolamide- or doxorubicin-treated cells were 1.31 ± 0.12, 3.04 ± 0.14 and 2.50 ± 0.08 nM h–1, respectively (Figure 2). Increased Bax/Bcl-2 expression ratio confirmed a strong reason for increased caspase-3 activity since this ratio supports an increased tendency of the treated cells for caspase-3 activation via mitochondrial pathway (Figure 6 and Table S3). The 2.3- and 1.9-fold increase in caspase-3 activity in acetazolamide- and doxorubicin-treated samples were apparently in conflict with the lack of DNA laddering.
The direct examination of T-47D cells incubated with acetazolamide or doxorubicin, stained with Annexin V-PI, revealed no or few apoptotic and necrotic cells (Figure 3 and Table S2). Rounding up of the cells, resulted from breaking of the cell junctions in parallel with exposure of the membranous phosphatidylserines, was visualised with Annexin V-FITC as green fluorescence (Figure S2). The late apoptotic cells, based on the penetration of propidium iodide (PI) into the nucleus as well as exposing of the phosphatidylserines in the outer leaflet of the plasma membrane, were observed as green shiny fluorescent circles containing red nuclei (Figure S2). Another property of apoptotic cells is the appearance of the apoptotic bodies (Figure S2). Necrotic cells are mostly recognised based on the red dense nuclei without any staining of plasma membrane (PI+ and Annexin V-FITC−; Figure S2). Live cells were not observable under the fluorescent microscope as expected because their plasma membrane is not permeable to PI and lacks phosphatidylserines in the outer membrane leaflet (PI– and Annexin V-FITC−; not shown).
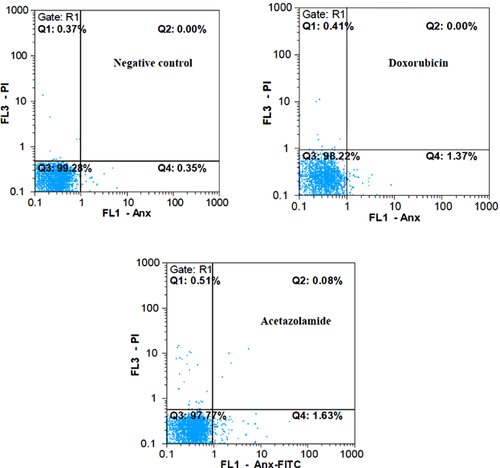
Quantification of apoptosis and necrosis was also carried out by flow cytometry. The sum of percent values in Q2 and Q4 regions was considered as the total percent value for apoptotic cells (early and late apoptotic cells) (Hsu and Yen, 2006; Dowejko et al., 2009; LaPensee et al., 2009). Under this condition, the percent values in the regions Q1 and Q3 indicate the percent value of necrotic and normal cells, respectively (Figure 3 and Table S2). The sum of the percent values in Q1 and Q2 were also considered because in some reports these two regions correspond to the percent value of necrotic cells (Davis et al., 2000). Hence, Q4 indicated the percent value of apoptosis alone. Although the two calculating methods for determination of apoptosis (Q2 + Q4 or Q4 alone) and necrosis (Q1 alone or Q1 + Q2) were considered, it was clear that the occurrence of apoptosis and necrosis were negligible.
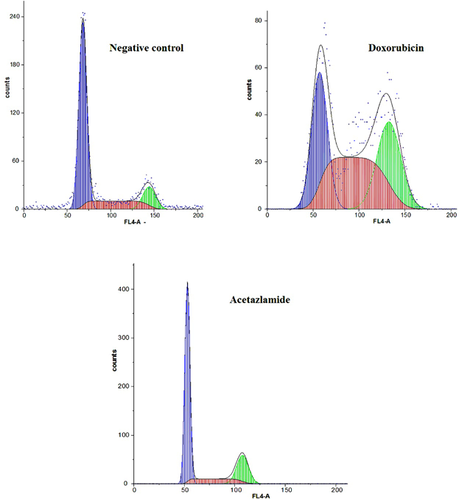
In addition to ascertaining the percent of necrotic and apoptotic cells in the medium, flow cytometry was used for analyzing the cell cycle distribution. Flow cytometric results indicated that incubation of cells with acetazolamide was accompanied by no considerable changes in the cell cycle progression (Figure 4). In contrast, doxorubicin-treated cells showed a major dissipation in the S phase of the cell cycle (Figure 4). Moreover, the doxorubicin-treated cells exhibited a decrease in the number of cells transiting from G2/M to G1 phase of the cell cycle.
Lack of cell cycle arrest in the presence of acetazolamide is also shown in Figure 5. There were no significant changes in the expression level of four essential cell cycle regulator genes including p21, p27, cyclin D1 and cdc2. The first two genes are negative regulator of G1 phase (Stein and Pardee, 2004). They inhibit G1 phase progression when an unusual event such as DNA damage is occurred. Constant expression level of p21, p27, and cyclin D1 demonstrated that incubation of T-47D cells with acetazolamide had no effects on the G1 phase progression as was indicated by flow cytometry analysis (Figures 4 and 5). The constant transcription level of cdc2 (a positive regulator of G2/M phase progression) indicated the lack of cell cycle arrest in G2/M phase for acetazolamide-treated cells (Figure 5). Constant expression of p21, p27, cyclin D1 (all are effective in G1 phase) and cdc2 (effective in G2/M phase) in doxorubicin-treated cells showed that doxorubicin (similar to acetazolamide) had no effects on G1 phase, but it may repress G2/M phase progression in a cdc2 independent manner.
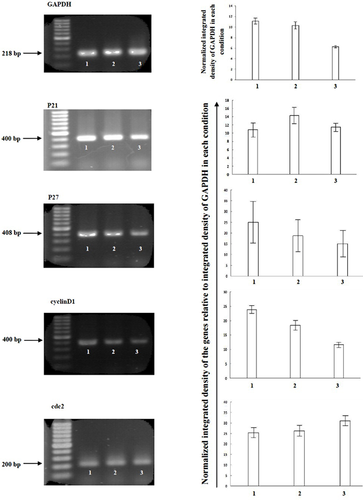
Figure 6 and Table S3 show that downregulation of AIF occurred in the presence of acetazolamide, which supports the lack of apoptosis. Alternatively, the real time RT-PCR results show that expressions of p53, ATG5, DRAM and BCLN1/Bcl-2 ratio were increased in T-47D cells incubated with acetazolamide compared to control (Figure 6 and Table S3). ATG5 is a key regulator of autophagy, and its increased expression level is indicative of the increased formation of autophagosomes (Yorimitsu and Klionsky, 2005). BCLN1 is among the first mammalian autophagy effectors establishing a complex with Class III PI3K to nucleate vesicle formation (Kihara et al., 2001). Bcl-2 binds to BCLN1 and suppresses its autophagy inducing activity (Pattingre et al., 2005). Increased expression ratio of BCLN1/Bcl-2, resulted from decreased Bcl-2 expression, supports the tendency of acetazolamide-treated cells for vesicle formation and autophagy function (Figure 6 and Table S3). Decreased expression of AKT1 along with increased expression of PTEN also indicated that the survival of the cells was decreased in the presence of acetazolamide (Figure 6 and Table S3).
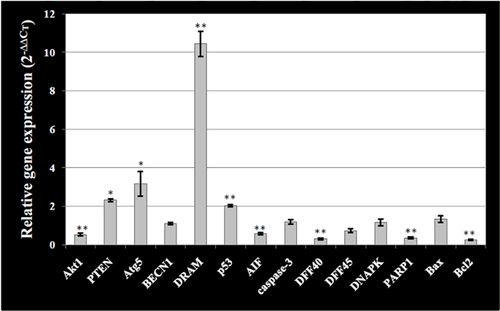
 (relative gene expression) for at least three different treatments and X-axis indicates the genes examined in cell incubated with acetazolamide. The relative amount of target material was quantified relative to the reference gene (GAPDH). Statistical significant difference is denoted by * and ** symbols indicating P < 0.05 and P < 0.01, respectively.
Discussion
Sulphonamides are commonly used for treatment of a variety of diseases. The vast pharmacological effects along with several conflicting reports regarding their mechanisms of action motivated us to determine the potency of an effective member of sulphonamide family, acetazolamide, on T-47D breast cancer cells. We determined whether this drug exerts its anti-proliferative action through previously reported mechanisms for sulpha drugs or utilises alternative mechanisms (Mohammadpour et al., 2012, 2013). Here we have shown that a 50% decrease in viability of T-47D cells occurred when incubated with acetazolamide (26 mM) for 48 h (Figure S1). We determined whether this effect was mediated through apoptosis and/or cell cycle arrest. These cells were also incubated with doxorubicin since numerous reports indicated induction of apoptosis and cell cycle arrest as its mechanism of action in a variety of cell types (Ling et al., 1998; Poter et al., 2002). Incubation of T-47D cells with acetazolamide resulted in rounding up and phosphatidylserine exposure in a few cells in the medium indicating the absence of significant apoptosis (Figure S2). Similarly, little apoptosis induction was detected in doxorubicin-treated T-47D cells (not shown). The low level of apoptosis in the drug-treated cells was confirmed by flow cytometry. Figure 3 shows that the total percent of apoptotic (column Q4 or Q2 + Q4) and necrotic cells (column Q1 or Q1 + Q2) was negligible. The lack of apoptosis in the presence of acetazolamide and doxorubicin was also confirmed by the absence of DNA laddering (Figure 1). These results were also consistent with decreased expression of AIF in the cells incubated with acetazolamide (Figure 6 and Table S3). Thus, the anti-proliferative effects of acetazolamide and doxorubicin in T-47D cells were not due to induced apoptosis.
Despite the lack of apoptosis, an increase in the level of caspase-3 activity was detected in the cells incubated with acetazolamide. This could be attributed to an increase in the transcript levels of the common apoptotic factors (such as Bax) or a decrease in the transcript levels of anti-apoptotic factors (such as Bcl-2) resulting in the increased apoptotic/anti-apoptotic gene expression ratio (Bax/Bcl-2 ratio; Figure 6 and Table S3). However, activation of caspase-3 (Figure 2) was not sufficient to drive apoptosis. It is possible that its enzymatic activity on downstream substrates is suppressed by other factors including DFF45. In addition, suppression of caspase-3 activity does not necessarily mean that its activity on other cellular pathways, including cleavage of PARP1 and DNA-PK for autophagy induction, is inhibited (see below). The real time RT-PCR data revealed that expression ratio of DFF45/DFF40 was increased in the presence of acetazolamide, which could oppose caspase-3 hyperactivity downstream apoptotic events and prevent its progression (Figure 6 and Table S3). DFF45 is a negative regulator of DFF40, which inhibits its function in DNA fragmentation and progression of apoptosis (Stein and Pardee, 2004). Conversely, autophagy may protect cells against apoptosis by eliminating damaged mitochondria, which may release pro-apoptotic signalling molecules to trigger apoptosis (Bursch et al., 1996). Furthermore, caspases are activated during autophagy in dying cells (Martin and Baehrecke, 2004; Yu et al., 2004). Thus, autophagy may trigger induction of some distinct regulators including upregulation of DFF45 to decrease caspase-3 activity on some special downstream substrates, including DFF45 and iCAD. These can result in increased DFF45/DFF40 expression ratio and inhibition of caspase dependent DNA fragmentation.
To describe anti-proliferative activity of acetazolamide and doxorubicin on T-47D cells, the effects of the two drugs on the cell cycle progression were measured by flow cytometry (Figure 4). Acetazolamide had no significant effect on cell cycle progression (Figure 4). The lack of changes in the expression level of G1-cyclin (cyclin D1), and also the two important G1-controllers (p21 and p27), further support the lack of G1 arrest. In addition, the flow cytometry data (Figure 4) indicated the lack of G2 arrest in acetazolamide-treated cells is consistent with lack of changes in cdc2 expression (Figure 5). However, doxorubicin induced no G1 arrest but induced S and G2/M arrest (Figure 4, Table S2). The lack of G1 arrest was consistent with no significant alterations in the transcription level of cyclin D1, p21 and p27. However, the G2 arrest was not in agreement with the constant level of cdc2 (Figure 5). It is plausible that the decrease in the activity of cdc2 occurred at the protein level. Together the data suggest that cell cycle arrest does play a role in the anti-proliferative action of doxorubicin in T-47D cells.
But autophagy is related to cell death and occurs in response to drug treatments (Bursch et al., 1996; Hoyer-Hansen et al., 2005). Tamoxifen is an anti-cancer drug, which induces autophagic cell death in MCF-7 breast cancer cells (Bursch et al., 1996; Hoyer-Hansen et al., 2005). In cells lacking apoptotic machinery, etoposide results in a non-apoptotic cell death through ATG-dependent mechanisms (Shimizu et al., 2004). The possible induction of autophagy in T-47D cells in the presence of acetazolamide has been demonstrated here by determination of the expression of p53, ATG5 and DRAM genes. The expression of these genes was significantly increased in cells treated with acetazolamide (Figure 6 and Table S3), indicating the induction of autophagy.
The p53 can promote autophagy in an Akt-independent manner via transcriptional up-regulation of its downstream target DRAM, which is also called Akt-independent p53/DRAM pathway (Roy and Debnath, 2010). The presence of acetazolamide resulted in increased p53 and DRAM expression (Figure 6 and Table S3). Thus, the autophagy induced by acetazolamide may occur through a pathway similar to that reported for Akt-independent p53/DRAM pathway (Mohammadpour et al., 2013). In the presence of acetazolamide, induction of autophagy occurred in parallel with down-regulation of Akt1, as well as up-regulation of PTEN (Figure 6 and Table S3). Thus, in the presence of acetazolamide cell survival pathways are downregulated and the death promoting effects of p53 is induced via DRAM protein. T-47D cells contain only a single copy of the p53 missense mutation at residue 194 within their zinc-binding domain (Schafer et al., 2000). Mutant p53 not only loses its natural anti-tumour activity but also may acquire additional pro-oncogenic gain of function activities via binding to the wild type p53 and inhibiting its normal function (Lambert et al., 2009). Interestingly, in the presence of acetazolamide the pro-oncogenic gain of function activities of mutant form of p53 returned to the normal anti-tumour condition of the wild type form to induce autophagy. This is very similar to the mechanism of action for some anti-tumour drugs reactivating mutant p53 to kill cancerous cells (Lambert et al., 2009).
Beclin1 (BCLN1) was among the first mammalian autophagy effectors establishing a complex with ClassIII PI3K to nucleate vesicle formation (Kihara et al., 2001). Bcl-2 binds to Beclin 1 and is a negative regulator of its autophagic behaviour (Pattingre et al., 2005). We found the decreased expression of Bcl-2 resulted in increased BCLN1/Bcl-2 transcription level ratio, favouring BCLN1's ability to induce autophagy in the presence of acetazolamide (Figure 6 and Table S3). Targeted silencing of Bcl-2 expression in human breast cancer cells with RNA-interference also promotes autophagic cell death, and thus presents a therapeutic potential (Akar et al., 2008).
Several studies have recently broadened the role of poly-ADP-ribosylation in cell killing showing that PARP-1 activation occurs during apoptosis, that is increase in PARP1 expression level is accompanied by AIF dependent apoptosis (Yu et al., 2002). The proteolytic cleavage of PARP-1 performed by caspases produces specific proteolytic cleavage fragments which are involved in the cell's decision to change its fate from apoptosis toward autophagy (Munoz-Gamez et al., 2009; Chaitanya et al., 2010). Furthermore, induction of autophagic cell death is dependent on DNA-PK inhibition (Graham and Chen, 2001). DNA-PK is one of the natural substrates of caspase-3 in the cells, which can be cleaved, and inactivated (Graham and Chen, 2001). Thus, downregulation of AIF and PARP1, as well as no increase in DNA-PK expression level (Figure 6 and Table S3), along with increased activity of caspase-3 ultimately abolished PARP1 and DNA-PK effects on induction of apoptosis while inducing autophagy.
We are aware that using other supplementary methods, such as Western blotting, would complement our RT and real time RT-PCR expression data. However, the consistency of the orchestrated alterations in the RNA transcript levels, and the expected cellular behaviour under various conditions guided us to suggest, with some exceptions, that the levels of RNA transcripts were well coordinated with the related protein levels. This notion is indicative of the fact that the level of RNA transcripts, albeit for the selected genes, provided us with adequate information to propose the associated changes in the protein expression levels in these cell.
Conclusions
In summary, cell cycle arrest may play a key role in the action of doxorubicin on T-47D cells. However, the contribution of apoptosis and cell cycle arrest to anti-proliferative effect of acetazolamide on T-47D cells was minimal. These observations are in contrast to many reports, where the mechanisms of action of sulphonamide derivatives on cancer cells are attributed to the conventional processes of apoptosis and cell cycle arrest. We believe that induction of autophagic cell death in T-47D cells is triggered through p53/DRAM pathway in acetazolamide-treated T-47D cells along with decreased Akt prosurvival activity.
Acknowledgments and funding
The main financial support was allocated by Iran National Science Foundation (INSF, grant number 8611973) and is greatly appreciated. The authors would also like to thank the Research Council of University of Tehran for the valuable patronage.
Conflict of interest
The authors declare that they have no competing interest.


