Osteopontin mediating cyclosporine A induced epithelial-to-mesenchymal transition on rat renal tubular epithelial cells
Abstract
Osteopontin (OPN) is highly correlated with cyclosporine A (CsA) nephrotoxicity. As epithelial-to-mesenchymal transition (EMT) of renal tubular epithelial cells plays an important role in CsA nephropathy, we investigated whether OPN mediated EMT of renal tubular epithelial cells upon CsA stimulation. OPN knockdown suppresses CsA induced EMT on NRK52E cells, and it also attenuates downregulation of E-cadherin and upregulation of α-smooth muscle actin (α-SMA) and fibronectin (FN) that are induced by CsA. OPN alone can induce EMT on NRK52E cells, which also results in upregulation of TGF-β1. Thus, OPN is a causative factor in mediating CsA induced EMT on NRK52E cells.
Introduction
Osteopontin (OPN) is a glycosylated phosphoprotein that mediates cell adhesion and migration. It can be produced by bone, dentin, cementum, hypertrophic cartilage, kidney, brain, bone-marrow-derived metrial gland cells, vascular tissues and cytotrophoblasts of the chorionic villus in the uterus and deciduas, ganglia of the inner ear, brain cells and specialised epithelia found in mammary, salivary and sweat glands, in bile and pancreatic ducts, and in distal renal tubules and in the gut, as well as in activated macrophages and lymphocytes. Its functional significance has been reported in a variety of biological processes, including development, bone remodelling, calcification, homeostasis, immunoprotection and tumorigenesis (Sodek et al., 2000). OPN expression in normal kidney tissue is at very low levels, but upregulation occurs in many diseases, including glomerulonephritis, hypertension, ischemic acute renal failure, renal ablation, unilateral ureteral obstruction (UUO) and CsA nephrotoxicity (Xie et al., 2001).
CsA is widely used as an immunosuppressive drug after kidney transplantation. However, it can induce both acute and chronic renal damage, which are mainly characterized by tubulointerstitial fibrosis, tubular atrophy, cytoplasmic vacuolisations and calcifications (Halloran, 2004; Nankivell and Chapman, 2006). Upregulation of OPN occurs in a rat CsA nephropathy model (Pichler et al., 1995). Its nephrotoxicity is significantly attenuated in OPN null mice, indicating that this protein is a critical mediator of the disease (Mazzali et al., 2002), but the mechanism of OPN in regulating CsA nephrotoxicity is not fully understood.
Inducing EMT of renal tubular epithelial cells is an important step on renal tubulointerstitial fibrosis. Myofibroblasts derived from tubular epithelial cells via EMT gain a migratory capacity and became the major contributors to renal tubulointerstitial fibrosis (Liu, 2004). In the present study, EMT was induced on SD rat renal proximal tubular epithelial cells (NRK52E cells) by Cs A. OPN was knockdown in these cells by specific shRNA. The expression of biomarkers for EMT, including E-cadherin, α-smooth muscle actin (α-SMA) and fibronectin (FN) (Badid et al., 2002; Zeisberg and Neilson, 2009) was analyzed by Western blot and immunofluorescence staining. Moreover, the degree of EMT was quantified on NRK52E cells stimulated with rhOPN.
Materials and methods
Materials
SD rat renal proximal tubular epithelial cell line (NRK52E) was purchased from American Type Culture Collection (ATCC) (Rockville, MD, USA). CsA was obtained from Novartis Pharmaceuticals Co., Ltd (Beijing, China), which was prepared as a stock solution (4.2 mM) in 100% ethanol as described (Slattery et al., 2005; Xu et al., 2010). rhOPN was purchased from R&D Systems (Minneapolis, MN, USA). Rabbit polyclonal antibodies to OPN, E-cadherin, α-SMA were obtained from Abcam (Hong Kong, China); rabbit polyclonal antibody to TGF-β1 was obtained from Cell Signaling Technology (Danvers, MA, USA); mouse anti-fibronectin (FN) antibody was purchased from BD Biosciences (Franklin Lakes, NJ, USA); TRITC/FITC/Cy3-conjugated secondary antibodies and horseradish peroxidase (HRP)-conjugated antibody were supplied by Beyotime (Nanjing, China).
OPN shRNA synthesis and transfection
The plasmid containing shRNA targeting OPN gene was purchased from GenePharma Co., Ltd (Shanghai, China). Sequences of OPN shRNA were as follows: (Sense) 5′-CACCGGATGAACCAAGCGTGGAAACTTCAAGAGTTTCCACGCT TCATCTTTTTTG-3′; (Antisense)5′-GATCCAAAAAAGGTGAAGCGTGGAAACTCTTGAAGTTTCCACGCTTGGTTCATCC-3′, a pair of scrambled sequences served as control: (Sense) 5′-CACCGTTCTCCGAACGTGTCAAGAGATTAC GTGACACGTTCGGAGAATTTTTT-3′; (Antisense) 5′-GATCCAAAAAATTCT CCGAACGTGTCACGTAATCTCTTGACGTGACACTTCGGAGAAC-3′. Lipofectamine 2000 (Invitrogen) was used for transfection (Grand Island, NY, USA).
Cell culture and treatment
NRK52E cells were cultured in DMEM-10%FBS supplemented with 100 IU/mL penicillin and 100 mg/mL streptomycin at 37°C in a 5% CO2 in air atmosphere. The cells were divided into five groups: cells maintained in DMEM; cells treated with CsA (4.2 µM); cells transfected with OPN shRNA, then treated with CsA (4.2 µM); cells transfected with control shRNA vector, then treated with CsA (4.2 µM); cells stimulated by rhOPN (0.12 µg/mL) and were cultured in serum free medium.
Immunofluorescence staining
NRK52E cells were grown on 22 mm × 22 mm glass slides in 35 mm dishes, and were treated as above. The cells were washed twice with PBS before fixing in 4% paraformaldehyde/PBS for 30 min at room temperature, and permeabilized with Triton X-100/PBS. After blocking in 5% BSA/PBS for 60 min, the cells were incubated with a 1:100 dilution of primary antibody overnight at 4°C. Following washing, the slides were stained with a TRITC/FITC/Cy3-conjugated secondary antibody (1: 100) for 1 h at 37°C. Finally, the cells were counterstained with Hoechst. The slides were mounted and viewed under a Leica Dfc480 fluorescent microscope (Germany).
Statistical analysis
Data are shown as means ± SEM, unless otherwise specified. Statistical analysis was performed using Graph Pad Prism. Paired Student's t-test was used for assessing statistical significance for experiments with only two data sets (control vs. treated). Intergroup differences were assessed by one-way ANOVA analysis. Correlations of E-cadherin, α-SMA, FN and TGF-β1 in rhOPN stimulated NRK52E cells were analysed by correlation test. Differences of P < 0.05 were considered statistically significant.
Results
CsA induces EMT on NRK52E cells
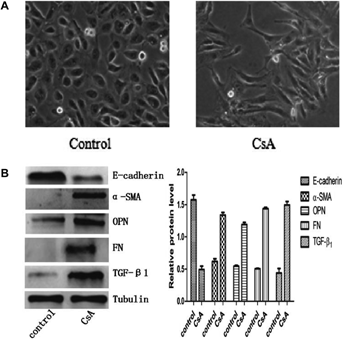
Since 4.2 µM was the best concentration inducing EMT (Slattery et al., 2005; Xu et al., 2010), we treated NRK52E cells with CsA at this level. Morphologic changes were detected after 72 h, including cell elongation, disassociation from neighbouring cells and loss of their cobblestone monolayer pattern (Figure 1A). The expression of E-cadherin, epithelial cell marker, was markedly decreased in the cells stimulated with CsA for 72 h compared with the control group, whereas the expression of fibroblast markers, α-SMA and FN, were dramatically increased (Figure 1B). Therefore, EMT was successfully induced on NRK52E cells upon CsA stimulation. In addition, the expression of OPN and TGF-β1 were significantly increased in CsA group (Figure 1B).
Knockdown of OPN expression occurs after transfection with its specific shRNA
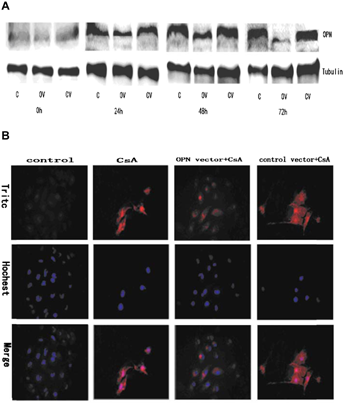
CsA induced EMT of NRK52E cells upregulated OPN expression (Figure 1B). To investigate whether upregulation of OPN is the causative factor of EMT on these cells, OPN expression was knockdown with specific shRNA. The protein levels were reduced to 52, 64 and 76%, respectively at 24, 48 and 72 h after transfection. No significant change was observed in the cells transfected with the control shRNA (Figure 2A). We also tested the expression of OPN protein by using indirect immunofluorescent staining. The results from immunofluorescent staining were consistent with these from Western blots (Figure 2B).
Knockdown OPN suppresses CsA-induced EMT on NRK52E cells
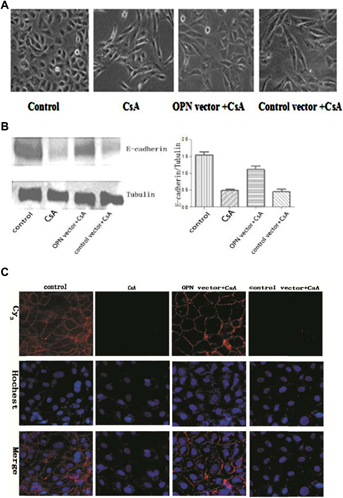
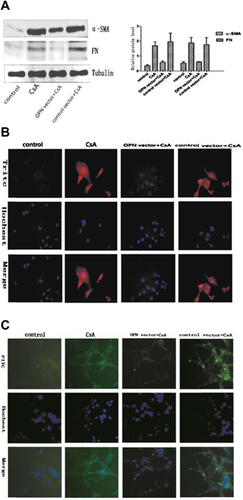
Untreated NRK52E cells displayed typical cobblestone morphology of epithelial cells (Figure 3A). Cell–cell junctions were formed as shown by E-cadherin staining (Figure 3C). Upon CsA stimulation, cell–cell junctions were disrupted and the cells became elongated and acquired migratory capacity. The process also featured E-cadherin loss. Knockdown OPN expression blocked EMT and E-cadherin loss was suppressed (Figure 3A–C). Moreover, the process of EMT was accompanied by upregulation of fibroblast markers, such as α-SMA and FN. Knockdown OPN expression significantly inhibited the upregulation of these markers (Figure 4A–C). These results suggest OPN plays a causative role in CsA induced EMT on NRK52E cells.
OPN stimulation induces EMT on NRK52E cells
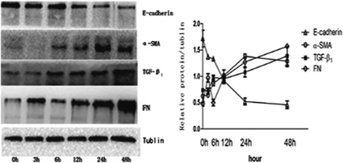
To see whether OPN alone could induce EMT on NRK52E cells, the cells were treated with rhOPN (0.12 µg/mL) and lysates were collected at different time-points. Western blot was used to measure the expression of E-cadherin, α-SMA, TGF-β1 and FN. OPN alone could induce the down-regulation of E-cadherin, and the upregulation of α-SMA and FN (Figure 5). The results suggest that OPN alone could induce EMT on NRK52E cells. The process was also associated with the upregulation of TGF-β1, indicating TGF-β1 involvement in the process.
Discussion
Although there are many improvements in graft survival, the chronic deterioration of renal allograft remains a serious problem (Meier-Kriesche et al., 2004). As a highly potent immunosuppressive drug, calcineurin inhibitor CsA dramatically improved the outcome after kidney transplantation (Jennings et al., 2007). However, the use of CsA often leads to tubular atrophy (TA) and interstitial fibrosis (IF), which can result in renal allograft failure. Although the mechanism of fibrosis might be complicated, more and more data suggest that EMT of renal tubular epithelial cells plays an important role in the process (McMorrow et al., 2005).
Upregulation of OPN has been associated with renal fibrosis for a long time (Pichler et al., 1995). Recently, OPN null mice were used to investigate the function of OPN in the process (Ophascharoensuk et al., 1999; Mazzali et al., 2002). However, different mouse models led to controversy about the function of OPN in the process of fibrosis. In the UUO model, OPN mediates early interstitial macrophage influx. It also functions as a survival factor for renal tubulointerstitial cells (Ophascharoensuk et al., 1999). On the other hand, in the CsA treated mouse model, OPN functioning as a mediator of macrophage infiltration is mild. OPN plays an important role in regulation of cortical interstitial cell proliferation, but not of tubular cell proliferation or apoptosis (Mazzali et al., 2002).
However, as a critical step in the process of fibrosis, the function of OPN on EMT of renal tubular epithelial cells is still unclear. We have found that knockdown of OPN in CsA-stimulated NRK52E cells can block the EMT process. It was also characterized by the suppression of the downregulation of E-cadherin and the upregulation of α-SMA and FN. The effects indicate that OPN plays an important role in mediating EMT of renal tubular epithelial cells. OPN alone in inducing EMT of NRK52E cells strongly suggests that it may act as a causative factor in the process. The function of OPN in regulation of EMT may have been present, but not noticed in the UUO mouse model and CsA-treated mouse model.
Increased expression of TGF-β1 occurs in CsA induced EMT models (McMorrow et al., 2005; Slattery et al., 2005), with which our data are consistent. TGF-β1 stimulation itself can result in a significant increase in OPN expression (Khanna, 2005; Lenga et al., 2008). On the other hand, OPN can stimulate TGF-β1 expression of porcine proximal tubular epithelial cells (Wolak et al., 2009). We found the same effect on rat proximal tubular epithelial cells, which suggests this is a general mechanism of TGF-β1 upregulation. The association between OPN and TGF-β1 was also found in an in-vivo renal fibrosis model; TGF-βmRNA was reduced in OPN null mice with UUO treatment, but not in CsA-treated mouse model (Ophascharoensuk et al., 1999; Mazzali et al., 2002). The difference may due to the model itself as well as the technique used, as only major changes could be detected by in situ hybridisation (Ophascharoensuk et al., 1999; Mazzali et al., 2002). The finds were also compromised by the fact that TGF-β1 is a post-transcriptionally regulated protein (Martin et al., 2011). Further study is required to clarify the possibility of a positive feedback loop between OPN and TGF-β1.
In summary, OPN plays an important role in CsA-induced EMT of NRK52E cells. OPN itself can induce EMT on NRK52E cells, and the process is associated with the upregulation of TGF-β1.
Acknowledgements and funding
This work was supported by a grant from the National Natural Science Foundation Program (30900503), People's Republic of China. We would like to thank Professor Beicheng Sun (Laboratory of liver transplantation, the First Affiliated Hospital of Nanjing Medical University, Nanjing, China) for providing us with lab space and equipment.
Conflict of interest
The authors have no conflicts of interest to declare.


