Intercellular communications and metabolic reprogramming as new predictive markers for immunotherapy responses in gastric cancer
Abbreviations
-
- KEGG
-
- Kyoto Encyclopedia of Genes and Genomes
-
- ICB
-
- Immune-checkpoint blockade
-
- SMC
-
- Samsung Medical Center
-
- TIDE
-
- Tumor Immune Dysfunction and Exclusion
-
- TCGA
-
- The Cancer Genome Atlas
Dear Editor,
Immune-directed therapeutic approaches have changed the paradigm of cancer treatment. The tumor-immune microenvironment [1] is a dynamic milieu consisting of heterogeneous metabolic conditions such as low oxygen, nutrient deficiency, acidity, and interactions between multiple cell types. In particular, immune cells in the tumor microenvironment are vulnerable to cellular dysfunctions (because of metabolic reprogramming [2]) and engage in intercellular communications with neighboring cells, thereby contributing to a tolerogenic and incompetent immune environment. Here, we evaluated 84 metabolic pathways in 12,422 single cells from patients with gastric cancer (GC) [3] and predicted immune checkpoint blockade (ICB) responses associated with cell type-specific metabolic features using clinical outcome data from 45 GC patients treated with ICB at the Samsung Medical Center (the SMC cohort) (Supplementary Table S1) [4] and molecular subtype data from 497 GC patients treated at Yonsei Severance Hospital (the Yonsei cohort) (Supplementary Table S2) [5].
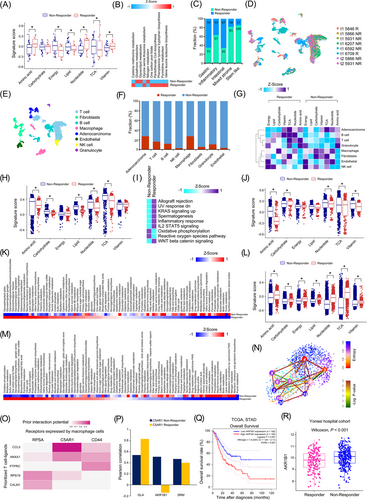
We first analyzed differences in the metabolic pathways in bulk GC samples between ICB responders and non-responders. The clinical data of the SMC cohort was subjected to systematic bioinformatics analyses for seven metabolic signatures [6]. In the responder group, biosynthetic pathways associated with amino acid synthesis (P = 0.026) and nucleotide synthesis (P = 0.006) were significantly enriched (Figure 1A). Differences in 84 metabolic pathways were also examined (Supplementary Figure S1A). The responder and non-responder groups demonstrated significant differences in 10 metabolic pathways. The highest differences were found in glutathione, glycerolipid, and nitrogen metabolic pathways (Figure 1B).

Furthermore, we predicted the responders and non-responders in the Yonsei cohort by analyzing the bulk transcriptome data using Tumor Immune Dysfunction and Exclusion (TIDE) for five molecular subtypes (Supplementary Table S3) [5, 7]. The stem-like subtype, which was associated with the worst prognosis [5], predicted the lowest proportion of responders (Figure 1C). Non-responders showed higher tumor immune dysfunction (P = 0.014) and exclusion scores (P < 0.001) than those shown by responders (Supplementary Figure S1B). Five metabolic pathways (thiamine metabolism, ether lipid metabolism, fatty acid elongation, phosphonate phosphinate, and cysteine methionine metabolism) were associated with the stem-like subtype (Supplementary Figure S1C). Further, in the non-responder group with the inflammatory and mixed-stroma subtypes, the glycosaminoglycan biosynthesis - chondroitin sulfate/dermatan sulfate pathway was significantly enriched (Supplementary Figure S1D).
Tumor-induced immune suppression can be ascribed to direct tumor factors and bystander tumor-related factors. To identify predictive biomarkers related to ICB responsiveness in terms of metabolic activity, we predicted the responses to ICB for each cell type using single-cell data. First, we prepared 8 simulated primary tumor samples for each patient with gastric single-cell data and predicted the ICB responses using TIDE. These samples were classified as 6 non-responder and 2 responder samples (Figure 1D; Supplementary Tables S5-S6). A total of 12,422 single cells were classified into 8 cell types, and each cell type showed a different response frequency (Figure 1E-1F). In the responder group, T and B cells related to innate immunity showed high metabolic activity. Macrophages had lower tricarboxylic acid cycle (TCA) levels in the responder group (false discovery rate [FDR] < 0.001; Figure 1G). The amino acid, carbohydrate, lipid, nucleotide, and TCA levels in adenocarcinoma cells were significantly higher in responder samples than in non-responder samples (all P < 0.001; Figure 1H). Among other cancer hallmarks, allograft rejection, decreased responses to ultraviolet light, and increased KRAS signaling were significantly enriched in adenocarcinoma cells from responder samples (FDR < 0.001; Figure 1I). Specifically, adenocarcinoma cells from responder samples were highly enriched (FDR < 0.001) for the mucin-type O-glycan biosynthesis, glycosaminoglycan biosynthesis - keratan sulfate, nitrogen metabolism, valine, leucine, and isoleucine biosynthesis, and glycosaminoglycan biosynthesis - chondroitin sulfate/dermatan sulfate pathways (Supplementary Figures S2 and S3A).
Macrophages were predicted to be the most responsive cells at the single-cell level (Figure 1F). However, it is unknown how macrophages regulate responsiveness to ICB. Furthermore, M2 macrophages from responder and non-responder patients in the SMC and Yonsei cohorts showed no significant difference in terms of glycolysis (Supplementary Figures S1D & S2). Macrophages from responder patients showed low levels of amino acid (P < 0.001), nucleotide (P = 0.003), and vitamin (P = 0.001), but high levels of carbohydrate (P = 0.002) and TCA (P = 0.009) (FDR < 0.001; Figure 1J). Single-cell data revealed high glycan metabolic reprogramming in macrophages from responder patients (Figure 1K). The metabolic pathways in cells from responder and non-responder patients differed by 83.33%. In cells from responder patients, the glycosphingolipid biosynthesis - globo and isoglobo series, glycosphingolipid biosynthesis - ganglio series, and glycosaminoglycan biosynthesis - chondroitin sulfate/dermatan sulfate reference pathways were highly enriched.
Further analysis revealed enrichment of all the seven metabolic signatures in T cells from responder patients (P < 0.001; Figure 1L). Particularly, pyrimidine metabolism, propanoate metabolism, and the biosynthesis of unsaturated fatty acids were highly enriched (FDR < 0.001; Figure 1M). Clustering T cells according to the degree of stemness using the VarID and StemID algorithms [8] showed that cluster 2 had the highest stemness whereas cluster 3 had the lowest stemness among others (Figure 1N, Supplementary Figure S3B). Of the cells constituting clusters 2 and 3, most (99%) of the T cells with the lowest stemness were in the non-responder group, and cluster 2 showed the highest stemness with over 90% in the responder group (Figure 1N). These results demonstrated that the immune response was activated while undergoing metabolic reprogramming (Supplementary Figure S3C) during T cell differentiation and activation.
As a cognate receptor interacting with C-C motif chemokine ligand 5 (CCL5), a prioritized T cell ligand, C5AR1, was predicted to be the most probable macrophage receptor (Figure 1O). C5a mediates macrophage polarization, and the combined inhibition of C5A/C5AR1 and programmed cell death 1 (PD-1) signaling have been predicted to show a synergistic anti-tumor effect [9]. The Pearson correlation analysis between C5AR1 and genes related to the glycerolipid metabolism pathways in the SMC dataset revealed an inverse correlation of the Aldo-Keto Reductase Family 1 Member B (AKR1B1) expression between the responder and non-responder groups (Figure 1P; Supplementary Table S7). AKR1B1 links glucose metabolism to epithelial-to-mesenchymal transition and is a potential cancer diagnostic marker [10]. We demonstrated that high AKR1B1 expression was associated with a poor prognosis, and it was expressed at significantly higher levels in the non-responder group (Figure 1Q-1R).
In this study, we unraveled how different immune cells engage in immunotherapy responses by cell type-dependent metabolic reprogramming at the single-cell level in GC. Our results demonstrated that intercellular conversation between macrophages and T cells in the non-responder group created a tumor metabolic microenvironment that suppressed overall immunity. Moreover, signal transduction in T cells and macrophages may affect glycerolipid metabolic reprogramming and be associated with immunotherapeutic outcomes in non-responder patients. We speculate that lipid components of the cell membrane might affect the phagocytosis of macrophages that would explain the reprogrammed glycerolipid metabolic activity in non-responders. Collectively, this study provides substantial metabolic insights for developing precision immunotherapy, which may help achieve better immunotherapeutic outcomes and potentially overcome ICB resistance in GC patients.
DECLARATIONS
ETHICS APPROVAL AND CONSENT TO PARTICIPATE
Not applicable
PATIENT CONSENT FOR PUBLICATION
Not applicable
AVAILABILITY OF DATA AND MATERIAL
All data are available in the main text and supplementary materials.
COMPETING INTERESTS
Authors declare that they have no competing interests.
FUNDING
This research was supported by a grant from the National Research Foundation, funded by the Ministry of Science and Information & Communication Technology, Republic of Korea (2018R1A5A2025079).
AUTHORS’ CONTRIBUTIONS
Conceptualization: JYS, JHC; Methodology: JYS, JHC; Data analysis: JYS; Writing – original draft: JYS; Writing – review & editing: JYS, JHC; Supervision: JHC; Project administration: JHC; Funding acquisition: JHC; Formal analysis: JYS; Both authors contributed to the interpretation of the results. Both authors have read and agreed to the published version of the manuscript.


