Analysis of the Global Burden of Disease study highlights the trends in death and disability-adjusted life years of leukemia from 1990 to 2017
Abstract
Background
The patterns of leukemia burden have dramatically changed in recent years. This study aimed to estimate the global trends of leukemia-related death and disability-adjusted life-years (DALYs) from 1990 to 2017.
Methods
The data was acquired from the latest version of the Global Burden of Disease (GBD) study. Estimated annual percentage changes (EAPCs) were calculated to estimate the trend of age-standardized rate (ASR) of death and DALYs due to leukemia and its main subtypes from 1990 to 2017.
Results
Globally, the numbers of death and DALYs due to leukemia were 347.58 × 10³ (95% uncertainty interval [UI] = 317.26 × 10³-364.88 × 10³) and 11975.35 × 103 (95% UI = 10749.15 × 103-12793.58 × 103) in 2017, with a 31.22% and 0.03% increase in absolute numbers from 1990 to 2017, respectively. Both of their ASR showed decreasing trends from 1990 to 2017 with the EAPCs being −1.04 (95% confidence interval [CI] = (−1.10-−0.99) and −1.52 (95% CI = −1.59-−1.44), respectively. Globally, the most pronounced decreasing trend of death and DALYs occurred in chronic myeloid leukemia with EAPCs of −2.76 (95% CI = −2.88-−2.64) and −2.84 (95% CI = −2.97-−2.70), respectively, while the trend increased in acute myeloid leukemia. The death and DALYs of leukemia decreased in most areas and countries with high socio-demographic index (SDI) including Bahrain, Finland, and Australia.
Conclusions
The disease burden of death and DALYs due to leukemia decreased globally, and for most regions and countries from 1990 to 2017. However, the leukemia burden is still a substantial challenge globally and required adequate and affordable medical resources to improve the survival and quality of life of leukemia patients.
List of abbreviations
-
- ALL
-
- acute lymphoblastic leukemia
-
- AML
-
- acute myeloid leukemia
-
- ASDR
-
- age-standardized death rate
-
- ASR
-
- age-standardized rate
-
- CI
-
- confidence interval
-
- CLL
-
- chronic lymphoblastic leukemia
-
- CML
-
- chronic myeloid leukemia
-
- DALY
-
- disability-adjusted life year
-
- EAPC
-
- estimated annual percentage change
-
- GBD
-
- Global Burden of Disease
-
- GHDx
-
- Global Health Data Exchange
-
- HDI
-
- Human Development Index
-
- SDG
-
- Sustainable Development Goal
-
- SDI
-
- socio-demographic index
-
- UI
-
- uncertainty interval
-
- UNDP
-
- United Nations Development Programme
-
- YLL
-
- years of life lost
1 BACKGROUND
Leukemia plays a significant part in the global cancer burden and its epidemiological patterns have been changing dramatically in the last decades [1, 2]. The Global Burden of Disease (GBD) study reported that leukemia was the ninth leading cause of cancer deaths globally in 2015, which was responsible for 353,000 deaths and 12,000,000 disability-adjusted life years (DALYs), and led to an 8% decrease in the age-standardized DALYs rates for both sexes from 2005 to 2015 [3]. The latest GBD study reported that leukemia demonstrated a decreasing percentage in the age-standardized years of life lost (YLL) rate, particularly for chronic myeloid leukemia (CML) and chronic lymphoblastic leukemia (CLL) [4]. Owing to the development of new therapeutic strategies and targeted drugs, the overall survival and the quality of life of leukemia patients had shown remarkable improvements [5-8]. The clinical application of tyrosine kinase inhibitors (such as imatinib [9] and nilotinib [10]) dramatically improved the outcome and overall survival of CML [11]. The HAEMACARE study reported that the survival for CML in Europe improved from 37% in 1994 [12] to 45% in 2002 [13]. The CONCORD program showed that the increasing rate of 5-year survival for pediatric acute lymphoblastic leukemia (ALL) was observed mainly in European countries between 1995–1999 and 2005–2009 [14], and in Asian countries between 1995–1999 and 2010–2014 [15].
Leukemia is a key target of the third Sustainable Development Goals (SDGs), which plans to cut down one-third of the premature mortality from non-communicable diseases by 2030 [16]. Tracking the changes in leukemia burden could provide related data for better policy making. In this study, we report results of tracking the estimated annual percentage changes (EAPCs) of death and DALYs due to leukemia and its main subtypes from 1990 to 2017. We believe this analysis could potentially promote the improvement of disease management and health decision-making.
2 MATERIALS AND METHODS
2.1 Data sources
Data on leukemia was collected from the latest version of the GBD study by using the Global Health Data Exchange (GHDx) query tool (http://ghdx.healthdata.org/gbd-results-tool). According to the GBD 2017 online tools instruction, the number and rate of death and DALYs were extracted between 1990 and 2017 based on age, sex, subtype, region, and country, without any inclusion/exclusion criteria. Data on the four main subtypes of leukemia, including acute myeloid leukemia (AML), ALL, CLL, and CML were gathered. The socio-demographic index (SDI) areas were categorized into 5 levels including low, low-middle, middle, high-middle, and high. According to the geographical feature, the world was divided into 21 geographic regions, including East Asia, South Asia, and Western Europe. Data were available for 195 countries/territories, including China, India, and France. The methodologies of the overall GBD 2017 and estimations of disease burden were as described in previous studies [3, 15, 17]. The Human Development Index (HDI) comprises of macro indicators of human development, reflecting the level and availability of health resources. The HDI data was acquired from the United Nations Development Programme (UNDP; http://hdr.undp.org/en/data).
2.2 Statistical analysis
In the formula, αi denotes the age-specific rates in the ith age group, wi denotes the number of persons (or the weight) in the corresponding ith age subgroup of the selected reference standard population, and A denotes the number of age groups.
It is a widely accepted method that the EAPC describes the magnitude of the ASR trend change in a regression model [18-21], which quantifies the average annual rate of change in ASR over the given interval. A regression line was used to estimate the natural logarithm of the rates, for example, y = α+βx+ε, where y = ln(ASR), and x = calendar year. The EAPC was calculated as 100 × [exp(β)-1], along with the 95% confidence interval (CI) with the linear regression model. An increasing trend was observed when the EAPC value and its 95% CI were > 0. In contrast, a decreasing trend was observed when the EAPC value and its 95% CI were < 0. Others represented that ASR was stable over time. To explore the impact factors of EAPC, the relations between EAPCs and ASR in 1990 and between EAPCs and HDI in 2017, respectively, were estimated using the Pearson correlation analysis in the Statistical Package for Social Sciences (SPSS; version 25.0; SPSS Inc., Chicago, IL, USA). Choropleth maps were drawn using the R program (version 3.6.2).
3 RESULTS
3.1 Trends in death and DALYs due to leukemia
The global death number of leukemia was 347.58 × 10³ (95% uncertainty interval [UI] = 317.26 × 10³-364.88 × 10³) in 2017, with a 31.22% increase from 1990 to 2017 (Table 1). The age-standardized death rate (ASDR) showed a decreasing trend with an annual average of 1.04% from 1990 to 2017 (EAPC = −1.04; 95% CI = −1.10-−0.99; Table 1 and Figure 1A). The burden of death and DALYs were higher and showed lower decreasing trends in male than in female leukemia patients (Table 1). A dramatic decrease in percentages of absolute death numbers in leukemia was observed in children and adolescents (Supplementary Table S1 and Figure 1B). The trend in ASDR decreased in both sexes and most of the SDI areas and geographic regions (Table 1 and Figure 1A). Among the 195 countries/territories, 126 countries/territories showed decreasing trends in ASDR of leukemia and the largest decreasing one occurred in Bahrain, with an EAPC of −3.01 (95% CI = −3.47-−2.55), followed by Finland, and Australia. The trends of ASDR increased in forty-five countries/territories, and the most pronounced increase was in Georgia (EAPC = 1.73; 95% CI = 1.30-2.16; Supplementary Table S2 and Figure 2A–C).
| Characteristics | No. of deaths | DALYs | ||||
|---|---|---|---|---|---|---|
| Number in 2017, cases × 103 (95% UI) | Percentage change in absolute number (%) | EAPC (95% CI) | Number in 2017, cases × 103 (95% UI) | Percentage change in absolute number (%) | EAPC (95%CI) | |
| Total | 347.58 | 31.22 | −1.04 | 11975.35 | 0.03 | −1.52 |
| (317.26-364.88) | (−1.10-−0.99) | (10749.15-12793.58) | (−1.59-−1.44) | |||
| Sex | ||||||
| Male | 197.27 | 37.84 | −0.86 | 6823.69 | 4.21 | −1.38 |
| (178.44-209.08) | (−0.92-−0.80) | (6005.94-7296.35) | (−1.46-−1.29) | |||
| Female | 150.31 | 23.44 | −1.29 | 5151.66 | −5.02 | −1.70 |
| (131.44-160.48) | (−1.34-−1.23) | (4419.01-5628.29) | (−1.76-−1.63) | |||
| SDI | ||||||
| Low | 34.40 | 61.00 | −0.45 | 1694.14 | 39.29 | −0.79 |
| (29.27-38.49) | (−0.49-−0.41) | (1448.54-1917.77) | (−0.84-−0.73) | |||
| Low-middle | 53.87 | 56.27 | −0.31 | 2441.33 | 29.05 | −0.72 |
| (48.5-61.90) | (−0.37-−0.25) | (2196.18-2787.40) | (−0.79-−0.65) | |||
| Middle | 86.97 | 24.63 | −1.12 | 3395.96 | −11.63 | −1.72 |
| (75.62-91.48) | (−1.20-−1.04) | (2967.99-3580.70) | (−1.84-−1.59) | |||
| High-middle | 68.25 | 15.78 | −1.21 | 2324.88 | −17.31 | −1.87 |
| (60.62-71.36) | (−1.29-−1.13) | (2030.45-2446.36) | (−2.00-−1.74) | |||
| High | 102.82 | 30.18 | −1.16 | 2071.55 | −3.01 | −1.73 |
| (100.31-105.12) | (−1.24-−1.08) | (2011.94-2129.54) | (−1.79-−1.67) | |||
| Regions | ||||||
| East Asia | 63.51 | −9.86 | −2.20 | 2431.87 | −39.41 | −2.85 |
| (53.81-68.52) | (−2.41-−1.98) | (2049.31-2608.08) | (−3.13-−2.57) | |||
| South Asia | 52.41 | 65.13 | −0.21 | 2248.37 | 27.97 | −0.62 |
| (45.68-58.7) | (−0.29-−0.14) | (1946.54-2543.11) | (−0.73-−0.52) | |||
| Southeast Asia | 31.82 | 64.06 | −0.09 | 1264.40 | 27.27 | −0.39 |
| (26.20-34.58) | (−0.22-0.03) | (1070.74-1378.40) | (−0.52-−0.27) | |||
| Central Asia | 2.95 | 14.97 | −0.29 | 133.75 | −3.50 | −0.80 |
| (2.77-3.13) | (−0.43-−0.15) | (123.33-143.57) | (−0.96-−0.65) | |||
| High-income Asia Pacific | 12.21 | 39.53 | −1.37 | 254.07 | −19.72 | −2.30 |
| (11.73-12.67) | (−1.43-−1.31) | (241.01-267.09) | (−2.37-−2.23) | |||
| Oceania | 0.49 | 94.85 | −0.09 | 24.76 | 86.23 | −0.09 |
| (0.38-0.61) | (−0.13-−0.05) | (19.02-32.55) | (−0.15-−0.04) | |||
| Australasia | 2.65 | 22.29 | −2.15 | 58.04 | −1.49 | −2.30 |
| (2.41-2.89) | (−2.38-−1.93) | (52.67-63.30) | (−2.51-−2.08) | |||
| Eastern Europe | 13.49 | 3.73 | −0.53 | 388.54 | −21.48 | −1.39 |
| (13.06-13.92) | (−0.69-−0.36) | (371.51-406.62) | (−1.53-−1.25) | |||
| Western Europe | 48.52 | 25.18 | −0.97 | 901.17 | −5.41 | −1.60 |
| (46.56-50.34) | (−1.09-−0.84) | (857.33-941.13) | (−1.73-−1.48) | |||
| Central Europe | 9.76 | 24.59 | −0.28 | 225.37 | −11.16 | −1.05 |
| (9.21-10.10) | (−0.40-−0.16) | (214.14-234.06) | (−1.13-−0.96) | |||
| High-income North America | 31.90 | 35.27 | −0.98 | 658.36 | 9.24 | −1.53 |
| (31.00-32.96) | (−1.08-−0.89) | (634.86-688.34) | (−1.62-−1.43) | |||
| Andean Latin America | 2.83 | 72.58 | −0.04 | 123.08 | 32.18 | −0.30 |
| (2.38-3.14) | (−0.16-0.09) | (98.30-139.24) | (−0.44-−0.16) | |||
| Central Latin America | 11.48 | 63.68 | −0.53 | 487.96 | 28.45 | −0.63 |
| (11.00-12.05) | (−0.57-−0.49) | (466.42-517.54) | (−0.67-−0.58) | |||
| Caribbean | 2.45 | 38.60 | −0.66 | 83.32 | 9.34 | −0.87 |
| (2.25-2.75) | (−0.74-−0.58) | (74.16-99.50) | (−0.96-−0.77) | |||
| Tropical Latin America | 8.91 | 56.77 | −0.62 | 307.52 | 8.59 | −1.00 |
| (8.68-9.16) | (−0.69-−0.54) | (296.68-317.06) | (−1.10-−0.90) | |||
| Southern Latin America | 3.61 | 33.67 | −0.78 | 105.35 | 6.32 | −1.03 |
| (3.34-3.92) | (−0.86-−0.71) | (97.67-114.02) | (−1.09-−0.97) | |||
| Eastern Sub-Saharan Africa | 10.13 | 86.83 | −0.25 | 560.13 | 78.83 | −0.40 |
| (7.90-12.01) | (−0.32-−0.18) | (424.47-679.14) | (−0.50-−0.31) | |||
| Southern Sub-Saharan Africa | 2.30 | 64.83 | −0.24 | 80.45 | 43.04 | −0.47 |
| (1.89-2.49) | (−0.59-0.10) | (64.35-88.75) | (−0.91-−0.02) | |||
| Western Sub-Saharan Africa | 8.36 | 102.01 | −0.07 | 437.06 | 100.80 | −0.31 |
| (6.75-9.86) | (−0.14-−0.01) | (351.92-517.61) | (−0.43-−0.19) | |||
| North Africa and Middle East | 25.10 | 64.66 | −0.49 | 1057.85 | 35.72 | −0.71 |
| (22.07-28.53) | (−0.55-−0.43) | (936.25-1198.02) | (−0.77-−0.64) | |||
| Central Sub-Saharan Africa | 2.69 | 97.48 | −0.16 | 143.93 | 84.45 | −0.37 |
| (1.96-3.22) | (−0.18-−0.13) | (98.78-198.83) | (−0.41-−0.33) | |||
- Abbreviations: DALY, disability-adjusted life year; EAPC, estimated annual percentage change; CI, confidence interval; UI, uncertainty interval; SDI, socio-demographic index.
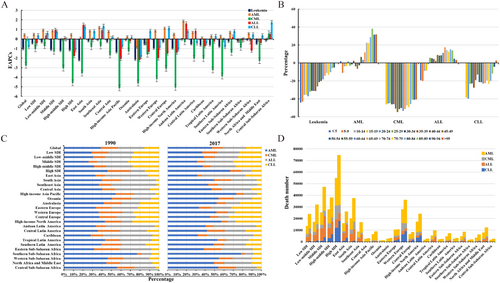
The distribution and trends of leukemia death globally. A. The EAPCs in ASDR of leukemia and 4 main subtypes globally, by SDI areas, and geographic regions from 1990 to 2017. B. The percentage changes in number of deaths from leukemia and the 4 main subtypes in the indicated age groups between 1990 and 2017. C. The proportion of number of deaths from 4 leukemia subtypes globally, by SDI areas, and geographic regions in 1990 and 2017. D. The distribution of number of deaths from 4 leukemia subtypes in SDI areas and geographic regions in 1990 and 2017.
Abbreviations: EAPC, estimated annual percentage change; AML, acute myeloid leukemia; CML, chronic myeloid leukemia; ALL, acute lymphoblastic leukemia; CLL, chronic lymphocytic leukemia
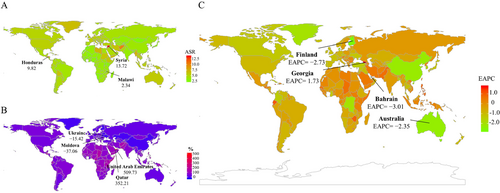
The distribution and trends of leukemia death in 195 countries/territories. A. The ASDR of leukemia in 195 countries/territories in 2017. B. The percentage changes in absolute number of leukemia deaths between 1990 and 2017. C. The EAPCs in ASDR of leukemia from 1990 to 2017. Countries/territories with an extreme value were annotated.
Abbreviations: ASDR, age-standardized death rate; EAPC, estimated annual percentage change
Globally, the number of DALYs caused by leukemia was 11975.35 × 103 (95% UI = 10749.15 × 103-12793.58 × 103) in 2017. The ASR of DALYs had a decreasing trend from 1990 to 2017 (EAPC = −1.52; 95% CI = −1.59-−1.44; Table 1 and Figure 3A). The most pronounced decreasing percentages in the absolute number of DALYs were noted in children and adolescents (Supplementary Table S1 and Figure 3B). The trends of DALYs generally decreased in both sexes, SDI areas, and geographic regions, particularly in East Asia (EAPC = −2.85; 95% CI = −3.13-−2.57; Table 1 and Figure 3A). Of the 195 countries/territories, 30 countries/territories showed increasing trends in ASR of DALYs from 1990 to 2017, and Jamaica had the largest increase (EAPC = 1.31; 95% CI = 0.87-1.75). 148 countries/territories had decreasing trends in the ASR of DALYs, including Bahrain and China, whose EAPCs were −2.99 (95% CI = −3.41-−2.57) and −2.93 (95% CI = −3.22-−2.64), respectively (Supplementary Table S2 and Figure 4A–C). The trends of death and DALYs due to leukemia were negatively correlated with HDI at a national level (ρ = −0.36 and P = 0.003 for trends of death; ρ = −0.47 and P < 0.001 for trends of DALYs; Figure 5A–B), but not with the ASR in 1990. Similar correlations were also seen in the four main subtypes of leukemia. Overall, the decreasing trends of death and DALYs due to leukemia and its subtypes generally occurred in the countries with high HDI, particularly the CML and CLL subtypes, while increasing trends were more common in countries with low HDI.

The distribution and trends of DALYs due to leukemia in global. A. The EAPCs in ASR of DALYs due to leukemia and 4 main subtypes in global, SDI areas, and geographic regions from 1990 to 2017. B. The percentage changes in DALYs of leukemia and 4 main subtypes in age groups between 1990 and 2017. C. The proportion of DALYs of 4 leukemia subtypes in global, SDI areas and geographic regions in 1990 and 2017; D. the distribution of DALYs of 4 leukemia subtypes in SDI areas and geographic regions in 1990 and 2017.
Abbreviations: EAPC, estimated annual percentage change; ASR, age-standardized rate; SDI: socio-demographic index; DALY, disability-adjusted life year
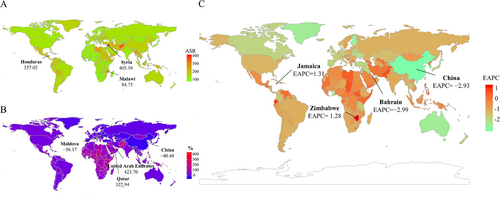
The distribution and trends of DALYs due to leukemia in 195 countries/territories. A. The ASR of DALYs due to leukemia in195 countries/territories in 2017. B. The percentage changes in absolute numbers of leukemia DALYs between 1990 and 2017. C. The EAPCs in ASR of leukemia DALYs from 1990 to 2017. Countries/territories with an extreme value were annotated.
Abbreviations: ASR, age-standardized rate; EAPC, estimated annual percentage change; DALY, disability-adjusted life year
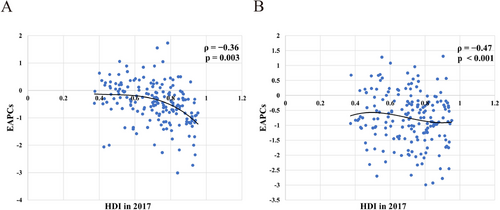
The correlation between EAPCs and HDI in 195 countries/territories. A. The EAPCs in ASR of leukemia death had a negative correlation with the HDI in 2017. B. The EAPCs in ASR of DALYs due to leukemia had a negative correlation with the HDI in 2017. The correlation was calculated with Pearson correlation analysis.
Abbreviations: ASR, age-standardized rate; EAPC, estimated annual percentage change; HDI, human development index; DALY, disability-adjusted life year
3.2 Trends in death and DALYs due to acute myeloid leukemia
Globally, the number of AML deaths increased to 92.98% from 1990 to 2017, and was 99.90 × 10³ (95% UI = 91.28 × 10³-104.58 × 10³) in 2017. The ASDR of AML had an increasing trend from 1990 to 2017 (EAPC = 0.45; 95% CI = 0.37-0.53; Supplementary Table S3 and Figure 1A, C, and D). The percentage changes of the number of deaths remarkably increased in older age groups (> 65 years old) (Supplementary Table S1 and Figure 1B). The increasing trends of ASDR were observed in most SDI areas and geographic regions (Supplementary Table S3 and Figure 1A). The trends of ASDR increased in 132 countries/territories from 1990 to 2017, with the largest increase observed in El Salvador (EAPC = 3.62; 95% CI = 2.96-4.28), followed by Ecuador and Dominican Republic. Thirty-seven countries/territories had decreasing trends of ASDR, particularly observed in Bahrain and Qatar (EAPC were −3.17, 95% CI: −3.65-−2.69, and −2.55; 95% CI = −3.06-−2.03, respectively; Supplementary Table S4 and Figure 6A).
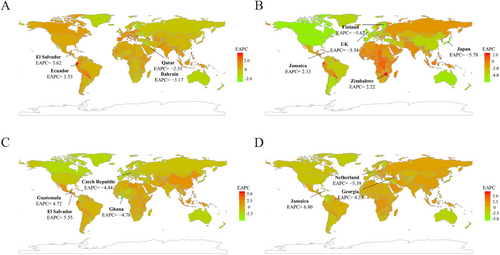
The EAPCs in ASDR of four leukemia subtypes in 195 countries/territories. A. The EAPCs in ASDR of AML from 1990 to 2017. B. The EAPCs in ASDR of CML from 1990 to 2017. C. The EAPCs in ASDR of ALL from 1990 to 2017. D. The EAPCs in ASDR of CLL from 1990 to 2017. Countries/territories with an extreme value were annotated.
Abbreviations: ASDR, age-standardized death rate; EAPC, estimated annual percentage change; AML, acute myeloid leukemia; CML, chronic myeloid leukemia; ALL, acute lymphoblastic leukemia; CLL, chronic lymphocytic leukemia
The number of DALYs due to AML was 3221.47 × 103 (95% UI = 2890.15 × 103-3438.43 × 103) in 2017, with a 56.14% increase from 1990 to 2017. The ASR of DALYs had an increasing trend from 1990 to 2017 (EAPC = 0.13; 95% CI = 0.07-0.18; Supplementary Table S5 and Figure 3A, C and D). Based on age groups, the percentages of the absolute number of DALYs significantly increased in older patients (> 65 years old) (Supplementary Table S1 and Figure 3B). The ASR of DALYs showed decreasing and increasing trends in female and male patients, respectively. The trends of DALYs increased in low- and middle-SDI areas and regions (Supplementary Table S5 and Figure 3A). The increasing trends of ASR were observed in 113 countries/territories from 1990 to 2017, and the largest increases were seen in Ecuador and El Salvador, with the respective EAPCs being 3.19 (95% CI = 2.82-3.55) and 3.09 (95% CI = 2.46-3.73). Decreasing trends in the ASR of DALYs were seen in fifty-nine countries/territories, with the largest decrease observed in Bahrain (EAPC = −3.01; 95% CI = −3.44-−2.57); Supplementary Table S6 and Figure 7A).
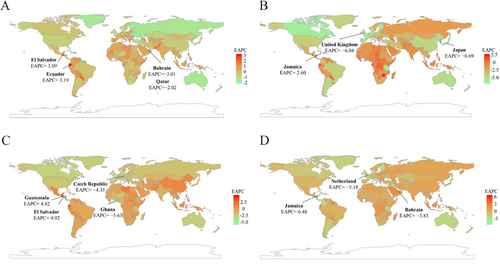
The EAPCs in ASR of DALYs due to four leukemia subtypes in 195 countries/territories. A. The EAPCs in ASR of DALYs due to AML from 1990 to 2017. B. The EAPCs in ASR of DALYs due to CML from 1990 to 2017. C. The EAPCs in ASR of DALYs due to ALL from 1990 to 2017. D. The EAPCs in ASR of DALYs due to CLL from 1990 to 2017. Countries/territories with an extreme value were annotated.
Abbreviations: ASR, age-standardized rate; EAPC, estimated annual percentage change; DALY, disability-adjusted life year; AML, acute myeloid leukemia; CML, chronic myeloid leukemia; ALL, acute lymphoblastic leukemia; CLL, chronic lymphocytic leukemia
3.3 Trends in death and DALYs due to chronic myeloid leukemia
Globally, the number of deaths caused by CML was 24.05 × 10³ (95% UI = 22.23 × 10³-26.07 × 10³) in 2017, with a 0.59% decrease from 1990 to 2017. The ASDR of CML decreased at an annual average of 2.76% from 1990 to 2017 (EAPC = −2.76; 95% CI = −2.88-−2.64; Supplementary Table S3 and Figure 1A, C, and D). The percentages in absolute death number of CML decreased in all age groups (Supplementary Table S1 and Figure 1B). The trends of ASDR dramatically decreased in both sexes, SDI areas, and geographic regions, particularly in high SDI areas and the high-income Asia Pacific regions, with the respective EAPCs of −4.58 (95% CI = −4.79-−4.37) and −5.12 (95% CI = −5.30-−4.95; Supplementary Table S3 and Figure 1A). The decreasing trends of ASDR were observed in 164 countries/territories, with the largest decreases seen in Japan and Finland with EAPCs of −5.78 (95% CI = −6.11-−5.45) and −5.62 (95% CI = −6.01-−5.23). Twenty-two countries/territories, including Jamaica and Zimbabwe, had increasing trends of ASDR (Supplementary Table S4 and Figure 6B).
Globally, the number of DALYs due to CML decreased by 10.88% from 1990 to 2017, and was 654.98 × 10³ (95% UI = 594.73 × 10³-712.95 × 10³) in 2017. The ASR of DALYs had a decreasing trend from 1990 to 2017, with an EAPC of −2.84 (95% CI = −2.97-−2.70; Supplementary Table S5 and Figure 3A, C and D). The trends in ASR of DALYs decreased in both sexes, SDI areas, and most geographic regions, and the most significant one was in the high-income Asia Pacific region (EAPC = −5.94; 95% CI = −6.16-−5.73; Supplementary Table S5 and Figure 3A). The ASR of DALYs showed decreasing trends in 171 countries/territories from 1990 to 2017, with the largest decreases seen in Japan and United Kingdom, with EAPCs of −6.69 (95% CI = −7.07-−6.30) and −6.04 (95% CI = −6.52-−5.56). The increasing trends in the ASR of DALYs occurred in fourteen countries/territories, particularly Jamaica (EAPC = 2.60; 95% CI = 2.22-2.99); Supplementary Table S6 and Figure 7B).
3.4 Trends in death and DALYs due to acute lymphoblastic leukemia
Globally, the number of deaths due to ALL was 52.22 × 10³ (95% UI = 45.97 × 10³-56.73 × 10³) in 2017, with an increase of 40.12% from 1990 to 2017. The EAPCs of ASDR due to ALL demonstrated no significant change during the period 1990–2017 (Supplementary Table S3 and Figure 1A, C, and D). The percentages in absolute death numbers of ALL decreased in the age groups of < 25 years while increasing in other groups (Supplementary Table S1 and Figure 1B). The ASDR showed remarkably decreasing trends in high SDI areas and high-income geographic regions, with the largest increasing trends observed in Andean Latin America and East Asia (Supplementary Table S3 and Figure 1A). The decreasing trends of ASDR occurred in 108 countries/territories from 1990 to 2017, and the largest decrease was found in Ghana and the Czech Republic, with EAPCs of−4.78 (95% CI = −5.71-−3.83) and −4.44 (95% CI = −4.98-−3.90). Sixty-five countries/territories had increasing trends of ASDR, particularly El Salvador and Guatemala (Supplementary Table S4 and Figure 6C).
The global number of DALYs due to ALL increased by 18.56% from 1990 to 2017, and was 2704.69 × 103 (95% UI = 2375.06 × 103-2985.23 × 103) in 2017. The changes in ASR of DALYs had a decreasing trend globally from 1990 to 2017 (EAPC = −0.20, 95%CI:−0.27-−0.13) (Supplementary Table S5 and Figure 3A, C, and D). The ASR of DALYs showed significant decreasing trends in high SDI areas and high-income geographic regions (Supplementary Table S5 and Figure 3A). Forty-nine countries/territories had increasing trends of DALYs from 1990 to 2017, with the largest increases seen in El Salvador and Guatemala, with EAPCs of 4.92 (95% CI = 4.04-5.80) and 4.82 (95% CI = 4.53-5.11). Decreasing trends in the ASR of DALYs occurred in 115 countries/territories, and the most pronounced one was in Ghana (EAPC = −5.63; 95% CI = −6.73-−4.52); Supplementary Table S6 and Figure 7C).
3.5 Trends in chronic lymphocytic leukemia
Globally, the number of deaths due to CLL increased by 70.90% from 1990 to 2017, and was 35.17 × 10³ (95% UI = 33.54 × 10³-36.88 × 10³) in 2017. The ASDR decreased by an average of 0.86% per year from 1990 to 2017 (EAPC = −0.86; 95% CI = −0.94-−0.78) (Supplementary Table S3 and Figure 1A, C, and D). The percentages in absolute death number of CLL decreased in most age groups (Supplementary Table S1 and Figure 1B). The trends in ASDR decreased in the high SDI areas and high-income regions, while increasing in Central Sub-Saharan Africa, East Asia, and Southeast Asia (Supplementary Table S3 and Figure 1A). The increasing trends of ASDR were seen in 116 countries/territories from 1990 to 2017, with the largest increases seen in Jamaica and Georgia, with respective EAPCs of 6.80 (95% CI = 5.92-7.69) and 4.33 (95% CI = 2.98-5.70). The trends of ASDR decreased in fifty-two countries/territories, with the largest decrease seen in the Netherlands (EAPC = −5.39; 95% CI = −6.70-−4.06; Supplementary Table S4 and Figure 6D).
The global number of DALYs due to CLL increased by 56.82% from 1990 to 2017, and was 708.68 × 10³ (95% UI = 666.84 × 10³-755.09 × 10³) in 2017. The ASR of DALYs showed a decreasing trend (EAPC = −0.90; 95% CI = −0.96-−0.84; Supplementary Table S5 and Figure 3A, C, and D). The percentages in absolute number of deaths caused by CLL decreased in most age groups (Supplementary Table S1 and Figure 3B). The trends in ASR of DALYs decreased in high SDI areas and high-income regions, while increasing in low SDI areas and regions (Supplementary Table S5 and Figure 3A). The increasing trends of DALYs were recorded in 115 countries/territories, with the largest increase noted in Jamaica, with EAPC of 6.48 (95% CI = 5.64-7.33). The pronounced decreasing trend in the ASR of DALYs was observed in the Netherlands (EAPC = −5.18; 95% CI = −6.41-−3.93; Supplementary Table S6 and Figure 7D).
4 DISCUSSION
In the past decades, there have been considerable progresses in the therapies for leukemia and their associated treatment-related prognoses, which resulted in dramatic change in the survival patterns of leukemia patients. The GBD study in 2019 reported that the ASR of death and DALYs due to the four main subtypes of leukemia decreased from 1990 to 2017 [4]. In this article, decreasing trends of the ASR of death and DALYs were also observed globally, which was probably on account of the effective strategies of diagnosis and treatment. Similar to that reported in the previous studies [3, 22], a higher leukemia burden was observed in male than in female patients, probably due to harmful exposures of smoking and occupational factors [23]. Concerning the subtypes of leukemia, CML had the most pronounced decreasing trends in death and DALYs, both globally and in several regions, which could be a consequence of advanced diagnostic methods and targeted therapy [24]. The EAPCs had a negative correlation with HDI because the prognosis and survival closely depended on socioeconomic conditions [25].
The disequilibrium of disease burden largely varied globally [16, 26], which was deeply impacted by demographics and socioeconomic status [27-29]. The largest disease burden was observed in East and South Asia, which was largely attributed to the huge population size and inadequate medical resources [30, 31]. We found a pronounced decreasing trend in the death and DALYs due to leukemia and its main subtypes in high SDI areas and high-income regions, both of which were probably because of the adequate medical resources and health care system [15, 32, 33]. The low HDI countries generally had a higher burden and worse outcomes than the high HDI countries [3, 22, 34]. Meanwhile, leukemia was diagnosed at an earlier age in low and middle-income countries, for example, the CML patients were diagnosed at the mean age of 38.50 years in developing countries [35, 36]. However, the gap of leukemia survival had gradually narrowed in most countries [37]. Encouragingly, minor decreasing trends were observed in low- and low-middle SDI areas, including most of Latin America and East Asia regions, which might be an optimistic achievement of local health infrastructure, international cooperation, and health aid [38]. For example, in Brazil, the primary health care system is very important and could provide the most effective intervention for AML [39]. Pronounced decreasing trends in death and DALYs were observed in China, which greatly depended on the development of socio-economical and health care resources. In China, the new rural cooperative medical care system covered approximately 80% of the total rural population (∼830 million people), making health resources more accessible and affordable [40, 41].
Our study had some limitations. Diagnostic accuracy and ascertainment bias in cancer registries were the potential limitations of the estimation of GBD cancer mortality and DALYs estimates, caused by misclassification and miscoding of death [42-44]. To our knowledge, the diagnostic standards and classification of hematologic malignancies varied across countries and over time [45], which complicated the analysis of leukemia burden. Because of the limitation of ASR estimates, this study estimated the trends of leukemia in age groups only by using the percentage changes of the absolute number between 1990 and 2017. The diagnostic standards of some rare types of leukemia were complicated, which were categorized as “other leukemia”. Therefore, other leukemia subtypes were not investigated in this present work.
In conclusion, this study found that the ASRs of death and DALYs due to leukemia showed decreasing trends globally, especially according to patient's sex, and in most SDI areas and geographic regions from 1990 to 2017. However, because of the limitation of medical sources and health care systems, the leukemia burden continues to remain a substantial challenge, both globally and in local regions. Furthermore, it should be emphasized that efficient health care systems are very important to reduce death and DALYs due to leukemia. These findings could be an important reference for public health strategies to further decrease the leukemia burden.
DECLARATIONS
ETHICS APPROVAL AND CONSENT TO PARTICIPATE
Not applicable.
CONSENT FOR PUBLICATION
Not applicable.
AVAILABILITY OF DATA AND MATERIALS
The data that support the findings of this study are available from the corresponding author upon reasonable request.
COMPETING INTERESTS
The authors declare that they have no competing interests.
FUNDING
Not applicable.
AUTHORS' CONTRIBUTIONS
ZJO: project administration and drafting.
DFY: Data analysis and validation.
YHL: Data analysis and visualization.
WQH, YZL, MYZ, FFY, HH: Data collection and collation.
QC: supervision and drafting and editing.
All authors read and approved the final manuscript.
ACKNOWLEDGEMENTS
Not applicable.


