

Proteomics identifies EGF-like domain multiple 7 as a potential therapeutic target for epidermal growth factor receptor-positive glioma
Abstract
Background
Glioma, the most frequent primary tumor of the central nervous system, has poor prognosis. The epidermal growth factor receptor (EGFR) pathway and angiogenesis play important roles in glioma growth, invasion, and recurrence. The present study aimed to use proteomic methods to probe into the role of the EGF-EGFR-angiogenesis axis in the tumorigenesis of glioma and access the therapeutic efficacy of selumetinib on glioma.
Methods
Proteomic profiling was used to characterize 200 paired EGFR-positive and EGFR-negative glioma tissues of all pathological types. The quantitative mass spectrometry data were used for systematic analysis of the proteomic profiles of 10 EGFR-positive and 10 EGFR-negative glioma cases. Consensus-clustering analysis was used to screen target proteins. Immunofluorescence analysis, cell growth assay, and intracranial xenograft experiments were used to verify and test the therapeutic effect of selumetinib on glioma.
Results
Advanced proteomic screening demonstrated that the expression of EGF-like domain multiple 7 (EGFL7) was higher in EGFR-positive tumor tissues than in EGFR-negative tumor tissues. In addition, EGFL7 could act as an activator in vitro and in vivo to promote glioma cell proliferation. EGFL7 was associated strongly with EGFR and prognosis. EGFL7 knockdown effectively suppressed glioma cell proliferation. Selumetinib treatment showed tumor reduction effect in EGFR-positive glioblastoma xenograft mouse model.
Conclusions
EGFL7 is a potential diagnostic biomarker and therapeutic target of glioma. Selumetinib could target the EGFR pathway and possibly improve the prognosis of EGFR-positive glioma.
List of abbreviations
-
- AKT
-
- alpha serine/threonine-protein kinase
-
- ANOVA
-
- one-way analysis of variance
-
- AP-2
-
- APETALA2
-
- CaMK
-
- Ca+2-dependent kinase
-
- CBL
-
- casitas B-lineage lymphoma
-
- CCK-8
-
- cell counting kit-8
-
- CGGA
-
- the Chinese Glioma Genome Atlas
-
- DAPI
-
- 4,6-diamino-2-phenylindole
-
- DMEM
-
- Dulbecco's modified Eagle's medium
-
- DMSO
-
- dimethyl sulfoxide
-
- EGFL7
-
- EGF-like domain multiple 7
-
- EGFR
-
- epidermal growth factor receptor
-
- EPS15
-
- epidermal growth factor receptor pathway substrate 15
-
- ERK
-
- extracellular signal-regulated kinase
-
- FBS
-
- fetal bovine serum
-
- FGFR
-
- fibroblast growth factor receptor
-
- GAPDH
-
- glyceraldehyde-3-phosphate dehydrogenase
-
- GBM
-
- Glioblastoma
-
- H2AX
-
- H2A histone family member X
-
- HPLC
-
- high performance liquid chromatography
-
- IDH
-
- isocitrate dehydrogenase
-
- IHC
-
- Immunohistochemistry
-
- ITRAQ
-
- isobaric tags for relative and absolute quantitation
-
- JNK
-
- c-Jun N-terminal kinase
-
- LOH
-
- loss of heterozygosity
-
- MALDI
-
- matrix-assisted laser desorption ionization
-
- MEK
-
- mitogen-activated protein kinase
-
- MET
-
- mesenchymal epithelial transition
-
- MS
-
- mass spectrometry
-
- MTOR
-
- mammalian target of rapamycin
-
- NCK
-
- non-catalytic region of tyrosine kinase
-
- OS
-
- overall survival
-
- PAK
-
- p21-activating kinases
-
- PBS
-
- phosphate-buffered saline
-
- PDGFRA
-
- platelet—derived growth factor receptor alpha
-
- PI3K
-
- phosphatidylinositol 3-kinase
-
- PKB
-
- protein kinase B
-
- PKM
-
- phosphorylated pyruvate kinase
-
- RAF
-
- Raf-1 proto-oncogene
-
- RAS
-
- rat sarcoma
-
- STAT3
-
- signal transducer and activator of transcription 3
-
- TCF4
-
- β-catenin/transcription factor 4
-
- TCGA
-
- the Cancer Genome Atlas
-
- VAV2
-
- vav guanine nucleotide exchange factor 2
-
- VEGFR
-
- vascular endothelial growth factor receptor
-
- WHO
-
- World Health Organization
1 BACKGROUND
Glioblastoma (GBM), the most frequent malignant primary brain tumor in adults, shows invasive growth and extremely poor prognosis [1, 2]. Angiogenesis plays an important role in glioma growth, invasion, and recurrence [3, 4]. The epidermal growth factor receptor (EGFR) comprises a family of tyrosine kinase receptors that directly regulates glioma angiogenesis [3, 4]. EGFR was identified more than twenty years after the recognization of its ligand epidermal growth factor (EGF) in 1962 [1-3]. The significance of EGFR in protein phosphorylation [1, 4, 5] and in tumorigenesis [6] was established afterwards. Subsequently, the EGF-EGFR signaling axis has been a principal focus of cancer research for over three decades. Therefore, this pathway is considered to be a key contributor to the high density, rapid proliferation, and drug resistance of glioma cells [5]. The latest technological progresses in mass spectrometry (MS) have enabled in depth analysis of cancer proteomes [7]. Comprehensive proteomic technology is a valuable approach that works on genomic detection of driver events and identification of treatment targets [8]. The advent of new proteomic approaches and experimental techniques has enabled researchers to rethink the EGF-EGFR-angiogenesis axis and understand its important role in the initiation and maintenance of the biological progression of GBM.
The molecular mechanism of glioma tumorigenesis and the exploration of targeted therapies have been a core issue in neurosurgery and neuro-oncology [9]. Therefore, identifying genes related to glioma, examining the molecular pathology, and exploring new strategies and targets for the treatment of glioma have become important in the field of glioma research [10, 11]. Glioma has been characterized by its radiological and genetic features. However, only a few patients could be genetically profiled in real-world clinical practice due to expenses and methodology limitation. The down-stream clinically meaningful protein changes are thus necessary to be evaluated, which could be achieved via proteomics analysis. Especially, the advances in MS-based proteomics allow extensive and quantitative surveys of the human proteome. Selumetinib, an MEK inhibitor, has a simple chemical structure and is fat-soluble with a low molecular weight (458 Da). Selumetinib has been used in many anti-tumor studies. It significantly inhibited the phosphorylation of mitogen-activated protein kinase (MEK), thereby inhibiting EGFR expression and tumor progression [12]. As MEK signaling, a downstream pathway of EGFR, promotes the progression of malignant glioma, we hypothesize that the selumetinib-induced inhibition of MEK signaling may impair the EGFR pathway.
In this study, we focused on using advanced proteomics methods to screen EGFR-related proteins to identify proteins that are differentially expressed among different subsets of patients with gliomas. We then explored the biological role of the identified proteins and efficacy of selumetinib on glioma.
2 MATERIALS AND METHODS
2.1 Clinical specimens and bioinformatics
Frozen glioma tissues were collected from the Glioma Center of Xiangya Hospital (Changsha, Hunan, China). In total, 100 EGFR-positive and 100 EGFR-negative glioma samples were collected for protomic analysis. The criteria for patient selection were as follows: age of ≥ 18 and ≤ 70 years; subtype confirmed by pathology; patient did not receive glucocorticoid treatment 5 days before enrollment; no anti-EGFR treatment was received before collecting the samples. Consensus-clustering dataset was used to analyze the MS data from different batches, and SC3 software (Vladimir Kiselev, Hinxton, Cambridge, UK) was used to generate the cluster map [13]. The gene set enrichment analysis was used to select key genes in clustering results and process proteomics data [14]. In addition, clinical data was provided by two large glioma gene expression databases: 277 glioma patients from the Chinese Glioma Genome Atlas (CGGA; http://www.cgga.org.cn) and 665 glioma samples of various pathological subtypes from the Cancer Genome Atlas (TCGA; https://gdc.cancer.gov).
2.2 Isobaric tags for relative and absolute quantitation (iTRAQ) proteome analysis
We selected 20 glioma samples for proteomic characterization using iTRAQ (SCIEX, Foster City, CA, USA). Cluster sampling method, a randomization-based sampling method, was used in this selection process. Cluster sampling was performed according to different pathological subtypes. Proteomic analysis was carried out by using the iTRAQ-labeled technique on the same mass spectrometer with stable quality control. iTRAQ 8-plex was completed for all 20 tumor tissues for discovery and validation of proteomic data (Figure 1). Tumor tissue samples were kept in cryovials at -80°C until cryopulverization using a CP02 Cryprep Pulverizer (Covaris, Woburn, MA, USA). For each case, 40 mg of tissue was used to provide an expected yield for each set of 1.5-2 mg protein based on 4%-5% recovery. To obviate systematic deviation, sample processing was block randomized, with each intrinsic subtype proportionally represented in each processing tranche. The samples were mixed with the iTRAQ reagent for 1 h in dark. A volume of 0.1% trifluoroacetic acid nine times the sample volume was added into the samples. Desalted peptides were labeled with 8-plex iTRAQ reagents (SCIEX) according to the manufacturer's instructions. All peptides were separated using an online nanoflow Proxeon EASY-nLC 1000 UHPLC system (Thermo Fisher Scientific, Waltham, MA, USA) and analyzed on a Benchtop Orbitrap Q Exactive HF mass spectrometer (Thermo Fisher Scientific).

2.3 Immunohistochemistry (IHC)
Generally, specimens were fixed in formaldehyde solution, routinely processed, and then enclosed in paraffin. Five-micron-thick sections were prepared. These sections were deparaffinized and rehydrated. H2O2 at a concentration of 0.3% was used to block endogenous peroxidase activity. Sections were put in 10 mmol/L citrate antigen-unmasking solution (pH 6.0) heating in oven at 90°C for 15 min. All sections were incubated with 10% fetal bovine serum (FBS) (Thermo Fisher Scientific) at 37°C for 10 min. Next, sections were incubated with primary antibodies (1:100 dilution) overnight at 4°C, followed by incubation with biotin-labeled secondary antibodies (1:100 dilution) for 1 h at 37°C and then incubated with 3,3’-diaminobenzidine substrate solution (Zhongshan Bio Corp, Zhongshan, Guangdong, China), counterstained with hematoxylin (Zhongshan Bio Corp), and visualized under a light microscope. The antibodies used in IHC included antibodies against EGF-like domain multiple 7 (EGFL7) (sc-373898, dilution 1:100, Santa Cruz Biotechnology, Dallas, TX, USA), EGFR (MA5-13070, dilution 1:100, Invitrogen, Waltham, MA, USA), marker of proliferation Ki67 (KI67) (ab15580, dilution 1:200, Abcam, Cambridge, MA, USA), phosphorylated extracellular signal-regulated kinase (p-ERK)1/2 (ab214362, dilution 1:200, Abcam), and phosphorylated pyruvate kinase M1/2 (p-PKM1/2) (#3827, dilution 1:200, Cell Signaling Technology, Danvers, MA, USA). The staining intensity was scored on a scale of 0 to 3 (0, negative; 1, slightly positive; 2, moderately positive; 3, intensely positive) by two experienced pathologists without knowledge of the diagnosis. A score of 0 or 1 indicated low expression, whereas a score of 2 or 3 indicated high expression. If there was an inconsistency, the two senior pathologists simultaneously reviewed the images to achieve a consensus.
2.4 Cell lines and culture conditions
EGFR-active human GBM cell lines, U87-MG and U251-MG, were obtained from Institute of Biochemistry and Cell Biology, Chinese Academy of Science (Shanghai, China). Both cell lines were grown and cultured in Dulbecco's modified Eagle's medium (DMEM) nutrient mixture (Gibco, Grand Island, NY, USA) supplemented with 10% FBS, 2 mmol/L glutamine (Sigma, St. Louis, MO, USA), 100 units/mL of penicillin (Sigma), and 100 mg/mL of streptomycin (Sigma) at 37°C with 5% CO2.
2.5 Drug treatments and lentiviral infection
Selumetinib (Selleck Chemicals, Houston, TX, USA) was used to inhibit MEK1/2 phosphorylation. GBM cells were treated with 0.195, 0.39, 0.78, 1.56, 3.125, 6.25, 12.5, 25, 50, and 100 µmol/L selumetinib dissolved in dimethyl sulfoxide (DMSO, Sigma-Aldrich, St. Louis, MO, USA) for 72 h.
Lentiviruses containing an EGFL7 inhibitor sequence (shEGFL7) or negative control sequences were purchased from GeneChem (Shanghai, China) (Supplementary Table S1). The transfection process follows GeneChem's instructions. U87-MG and U251-MG cells were infected with lentiviruses at 70% confluence. The infected cells (named U87-EGFL7kd and U251-EGFL7kd) were harvested for further use after 48 h. A universal negative control lentiviral vector was used as control.
2.6 qRT-PCR
Total RNA was extracted using the TRIzol reagent (Life Technologies, Rockville, MD, USA). To detect EGFL7 mRNA, quantitative real-time reverse transcription-polymerase chain reaction (qRT-PCR) was performed using a Reverse Transcription System (Promega, Madison, WI, USA) according to the manufacturer's instructions. All EGFL7 expression data were normalized to that of glyceraldehyde-3-phosphate dehydrogenase (GAPDH). The primers for EGFL7 and GAPDH are shown in Supplementary Table S2.
2.7 Cell growth assay
Cells were plated at 104 cells per well in 96-well plates with three replicate wells per sample. Then, 20 µL of Cell Counting Kit-8 (CCK-8) reagent (Beyotime, Shanghai, China) was added into each well for 4 days after plating, and the cells were incubated for additional 1 h. At last, 200 µL of DMSO was added to each well to dissolve the precipitate. The optical density (OD) was measured at a wavelength of 450 nm. The results are presented as the mean ± standard deviation (SD), which were derived from triplicate samples of at least three independent experiments.
2.8 Immunofluorescence analysis
Cultured U87-MG and U251-MG cells were fixed using 4% paraformaldehyde in phosphate-buffered saline (PBS) (Santa Cruz Biotechnology) for 20 min at room temperature. Thereafter, the cells were permeabilized using 0.2% Triton X 100 (Solarbio, Beijing, China) in PBS for 15 min. Non-specific binding was blocked by incubation with 5% goat serum (Thermo Fisher Scientific) in PBS for 30 min. The primary anti-EGFL7 antibodies (sc-373898, dilution 1:100, Santa Cruz Biotechnology) and anti-EGFR antibodies (MA5-13070, dilution 1:100, Invitrogen) were used for immunofluorescence. The slides were then incubated with appropriate antibodies in antibody dilution buffer overnight at 4°C, followed by a further incubation at room temperature for 1 h with Alexa Fluor® 488 donkey anti-mouse IgG antibody (A-21202, dilution 1:500, Invitrogen), anti-rabbit IgG Fab2 Alexa Fluor® 488 antibody (ab181346, dilution 1:500, Cell Signaling Technology) or Alexa Fluor® 594 donkey anti-rabbit IgG antibody (R37119, dilution 1:500, Invitrogen). The samples were washed and embedded into mounting medium with 4,6-diamino-2-phenylindole (DAPI; nuclear DNA was labeled in blue; VECTOR, Burlingame, CA, USA). Microscopy analysis was performed using a confocal laser scanner microscope (Olympus, Tokyo, Japan).
2.9 Nude mouse tumor xenograft model and treatment
For intracranial xenograft experiment, 4-week-old Bagg albino (BALB/c) nude mice (Animal Center of the Cancer Institute at the Chinese Academy of Medical Science, Beijing, China) were assigned to three groups with different conditions: 1) U87-MG cells only, 2) U87-EGFL7kd cells, and 3) U87-MG with selumetinib treatment. Each group contains 9 mice. Tumor cells were intracranially injected into mice. All experimental procedures, including animal feeding, intracranial tumor implantation, and specimen collection, were performed according to Xiangya Hospital Medical Research Used Animal Principle policies. U87-MG (5 × 10⁵) cells expressing luciferase were intracranially injected into athymic nude mice. After 3 days, 50 mg/mL selumetinib dissolved in 5 µL of DMSO were intratumorally injected every 3 days. Tumor volume was monitored by using in vivo bioluminescence imaging spectrum system (PerkinElmer, Waltham, MA, USA), which was carried out at day 14 after the injection to measure tumor volume using the formula: volume = (length × width2) / 2. When the mice hunched posture for more than 48 h and appeared labored breathing and cyanosis (skin or mucous membranes in blue), it is considered a humane endpoint. The mice were euthanized, and their brains were dissected for further pathological examination. Paraffin-embedded tissue sections were used for IHC analysis [15].
2.10 Statistical analysis
All statistical calculations were running on GraphPad Prism 6 (GraphPad Software, San Diego, CA, USA). Differences between two groups were determined using Student's t-test. Gene profiling data were analyzed using either BRB-Array Tools (Richard Simon, Bethesda, MD, USA) [16] or Gene Pattern software (Broad Institute, Cambridge, MA, USA) [17]. Proteomics data were processed using MaxQuant software (Jurgen Cox, Martinsried, Bavaria, Germany) [18] at 1% false discovery rate. For the screening of significantly differentially expressed proteins, we set fold change greater than 1.3 and P value < 0.1 [19].
Kaplan-Meier analysis and log-rank tests were used to evaluate the prognostic significance of EGFL7 expression level for patient overall survival (OS), which was defined as the duration from diagnosis to death of any cause. The patients survived at the end of the study period were censored. One-way analysis of variance (ANOVA) was used to test for differences among three or more groups, and the least significant difference post-hoc test was used to obtain individual P values. P values < 0.05 were considered significant. The Pearson product moment correlation test was used to evaluate the relationships between EGFL7 and p-ERK and p-PKM2 with semi-quantitative scores (using a scale from 0 to 10).
3 RESULTS
3.1 Demographic data of patients and protein identification in glioma tissues
We selected 100 EGFR-positive and 100 EGFR-negative tumor tissues from 200 patients with glioma diagnosed at Xiangya hospital (Table 1). In World Health Organization (WHO) grade IV glioma, classic-like and mesenchymal-like classification glioma, EGFR showed a higher positive rate (P < 0.001). OS was shorter in EGFR-positive patients than in EGFR-negative patients (Figure 2A). Compared with patients with other glioma pathological subtypes, patients with GBM had the shortest OS (Figure 2A).
| EGFR expression [cases (%)] | ||||
|---|---|---|---|---|
| Variable | Total (cases) | Positive | Negative | P value |
| Total | 200 | 100 (50.0) | 100 (50.0) | |
| Sex | 0.671 | |||
| Male | 105 | 51 (48.6) | 54 (51.4) | |
| Female | 95 | 49 (48.4) | 46 (51.6) | |
| Age | 0.982 | |||
| < 40 years | 95 | 51 (53.7) | 44 (46.3) | |
| ≥ 40 years | 105 | 49 (46.7) | 56 (53.3) | |
| WHO grade | 0.102 | |||
| I-III | 150 | 70 (46.7) | 80 (53.3) | |
| IV | 50 | 30 (60.0) | 20 (40.0) | |
| Pathological classification | 0.268 | |||
| Astrocytoma | 65 | 29 (44.6) | 36 (55.4) | |
| Oligodendroglioma | 49 | 26 (53.1) | 23 (46.9) | |
| Oligoastrocytoma | 36 | 15 (41.7) | 21 (58.3) | |
| GBM | 50 | 30 (60.0) | 20 (40.0%) | |
| Molecular classification | <0.001 | |||
| Classic-like | 22 | 22 (100.0) | 0 (0) | |
| Codel | 42 | 20 (47.6) | 22 (52.4) | |
| G-CIMP-high | 70 | 26 (37.1) | 44 (62.9) | |
| G-CIMP-low | 7 | 1 (14.3) | 6 (85.7) | |
| LGm6-GBM | 5 | 0 (0) | 5 (100.0) | |
| Mesenchymal-like | 33 | 22 (66.7) | 11 (33.3) | |
| PA-like | 6 | 1 (16.7) | 5 (83.3) | |
| Unknown | 15 | 8 (53.3) | 7 (46.7) | |
- Abbreviations: GBM: glioblastoma; Codel: co-deletion of chromosome arms 1p and 19q; G-CIMP: glioma cytosine-phosphate-guanine island methylator phenotype; LGm6-GBM: pan-glioma DNA methylation subtype 6 GBM; PA-like: pilocytic astrocytoma-like

Demographic data and mass spectrometry profiles of patients
(A) Kaplan-Meier overall survival curves of patients with different EGFR expression status (P = 0.0018) and different pathological subtypes (P < 0.001). P values were calculated using a two-sided log-rank test. (B) The distribution of identified proteins in 10 EGFR-positive glioma and 10 EGFR-negative glioma samples. (C) The histogram shows the average number of protein detected in EGFR-positive and EGFR-negative glioma samples. (D) A volcano plot shows the comparison of protein abundance in EGFR-positive glioma and paired EGFR-negative glioma. P values were calculated using paired two-sided moderated Student's t test. EGFR, epidermal growth factor receptor; GBM, glioblastoma; WHO, World Health Organization
iTRAQ proteomic analysis on the 20 selected cases (10 EGFR-positive cases and 10 EGFR-negative cases) showed that more proteins were identified from EGFR-positive tumors than from EGFR-negative tissues (Figure 2B). In particular, 4531 proteins per EGFR-positive glioma and 4324 proteins per EGFR-negative glioma were identified (Figure 2C). We identified 322 significantly different proteins (approximately 7% of the 4743 spots) using the data obtained from the proteomic analysis. Among them, 181 proteins were up-regulated and 141 proteins were down-regulated in EGFR-positive tumors compared with those in EGFR-negative tumors (Figure 2D).
3.2 Signature proteins and pathways in EGFR-positive glioma
Consensus-clustering analysis demonstrated dramatically different proteomic profiles between EGFR-positive and -negative tumor samples, highlighting the high heterogeneity among tumor samples (Figure 3A).

The proteins shown in Figure 3A are typical examples of signaling molecules involved in the EGFR network. In total, more than 100 interacting proteins and more than 200 EGFR-related substrates are described in the literature. Using a non-negative matrix factorization consensus-clustering analysis, we identified 9 major cell function groups in the EGFR-positive tumor cohort. Signaling pathways including angiogenesis, differentiation, apoptosis, survival, degradation, transcription, and endocytosis were significantly enhanced in the EGFR-positive tumor cohort (Figure 3B).
3.3 Associations of EGFL7 expression with patient prognosis and glioma cell growth in vitro
Focusing on proteins that directly interact with EGFR noted in the previous subsection, we identified a member of the EGF protein family, EGFL7, of which the expression intensity was higher in EGFR-positive tumors than in EGFR-negative tumors. By analyzing the genome-wide sequencing data of human glioma cases recorded in CGGA and TCGA, we found that the EGFL7 gene was highly expressed in 469 of 942 patients with glioma. EGFL7 expression level was significantly associated with OS in our proteomic analysis cohort, the CGGA primary glioma cohort, and the TCGA GBM cohort (Figure 4A). Kaplan-Meier analysis indicated that an elevated level of EGFL7 was a risk factor for poor prognosis in patients with glioma in the three cohorts (Table 2).

| Overall survival [months; median (range)] | ||||
|---|---|---|---|---|
| Cohort | Total (cases) | High EGFL7 expression | Low EGFL7 expression | P value |
| The present proteomic analysis cohort | 200 | 19.0 (0.3-180.4) | 32.6 (2.4-145.1) | 0.009 |
| CGGA primary glioma cohort | 220 | 34.9 (0.6-138.8) | 78.0 (3.2-138.1) | 0.043 |
| CGGA recurrent glioma cohort | 57 | 13.8 (2.1-143.3) | 10.8 (0.7-150.5) | 0.703 |
| TCGA GBM cohort | 155 | 8.9 (0.2-46.9) | 14.7 (0.2-88.1) | 0.022 |
| TCGA low-grade glioma cohort | 510 | 80.0 (0.1-211.2) | 87.5 (0.1-182.3) | 0.173 |
- Abbreviations: EGFL7, EGF-like domain multiple 7; GBM: glioblastoma; CGGA, Chinese Glioma Genome Atlas; TCGA, The Cancer Genome Atlas.
To confirm the role of EGFL7 in glioma, we specifically knocked down EGFL7 in U87-MG and U251-MG cells. The immunofluorescence results showed EGFL7 protein signals were weak in cell lines silenced for EGFL7 (Figure 4B). A CCK-8 assay showed that cell proliferation was significantly suppressed in U87-EGFL7kd and U251-EGFL7kd cells (Figure 4C). We found the survival rate was decreased in both U87-MG and U251-MG cells after treatment with selumetinib (Figure 4D).
3.4 Associations of EGFL7 expression with xenograft tumor growth and mouse survival
We explored the effects of EGFL7 in an intracranial xenograft mouse model. To better understand the heterogeneity of GBM, nude mice received intracranial injection of U87-MG cells, intracranial injection of U87-EGFL7kd cells, or intracranial injection of U87-MG cells with selumetinib treatment.
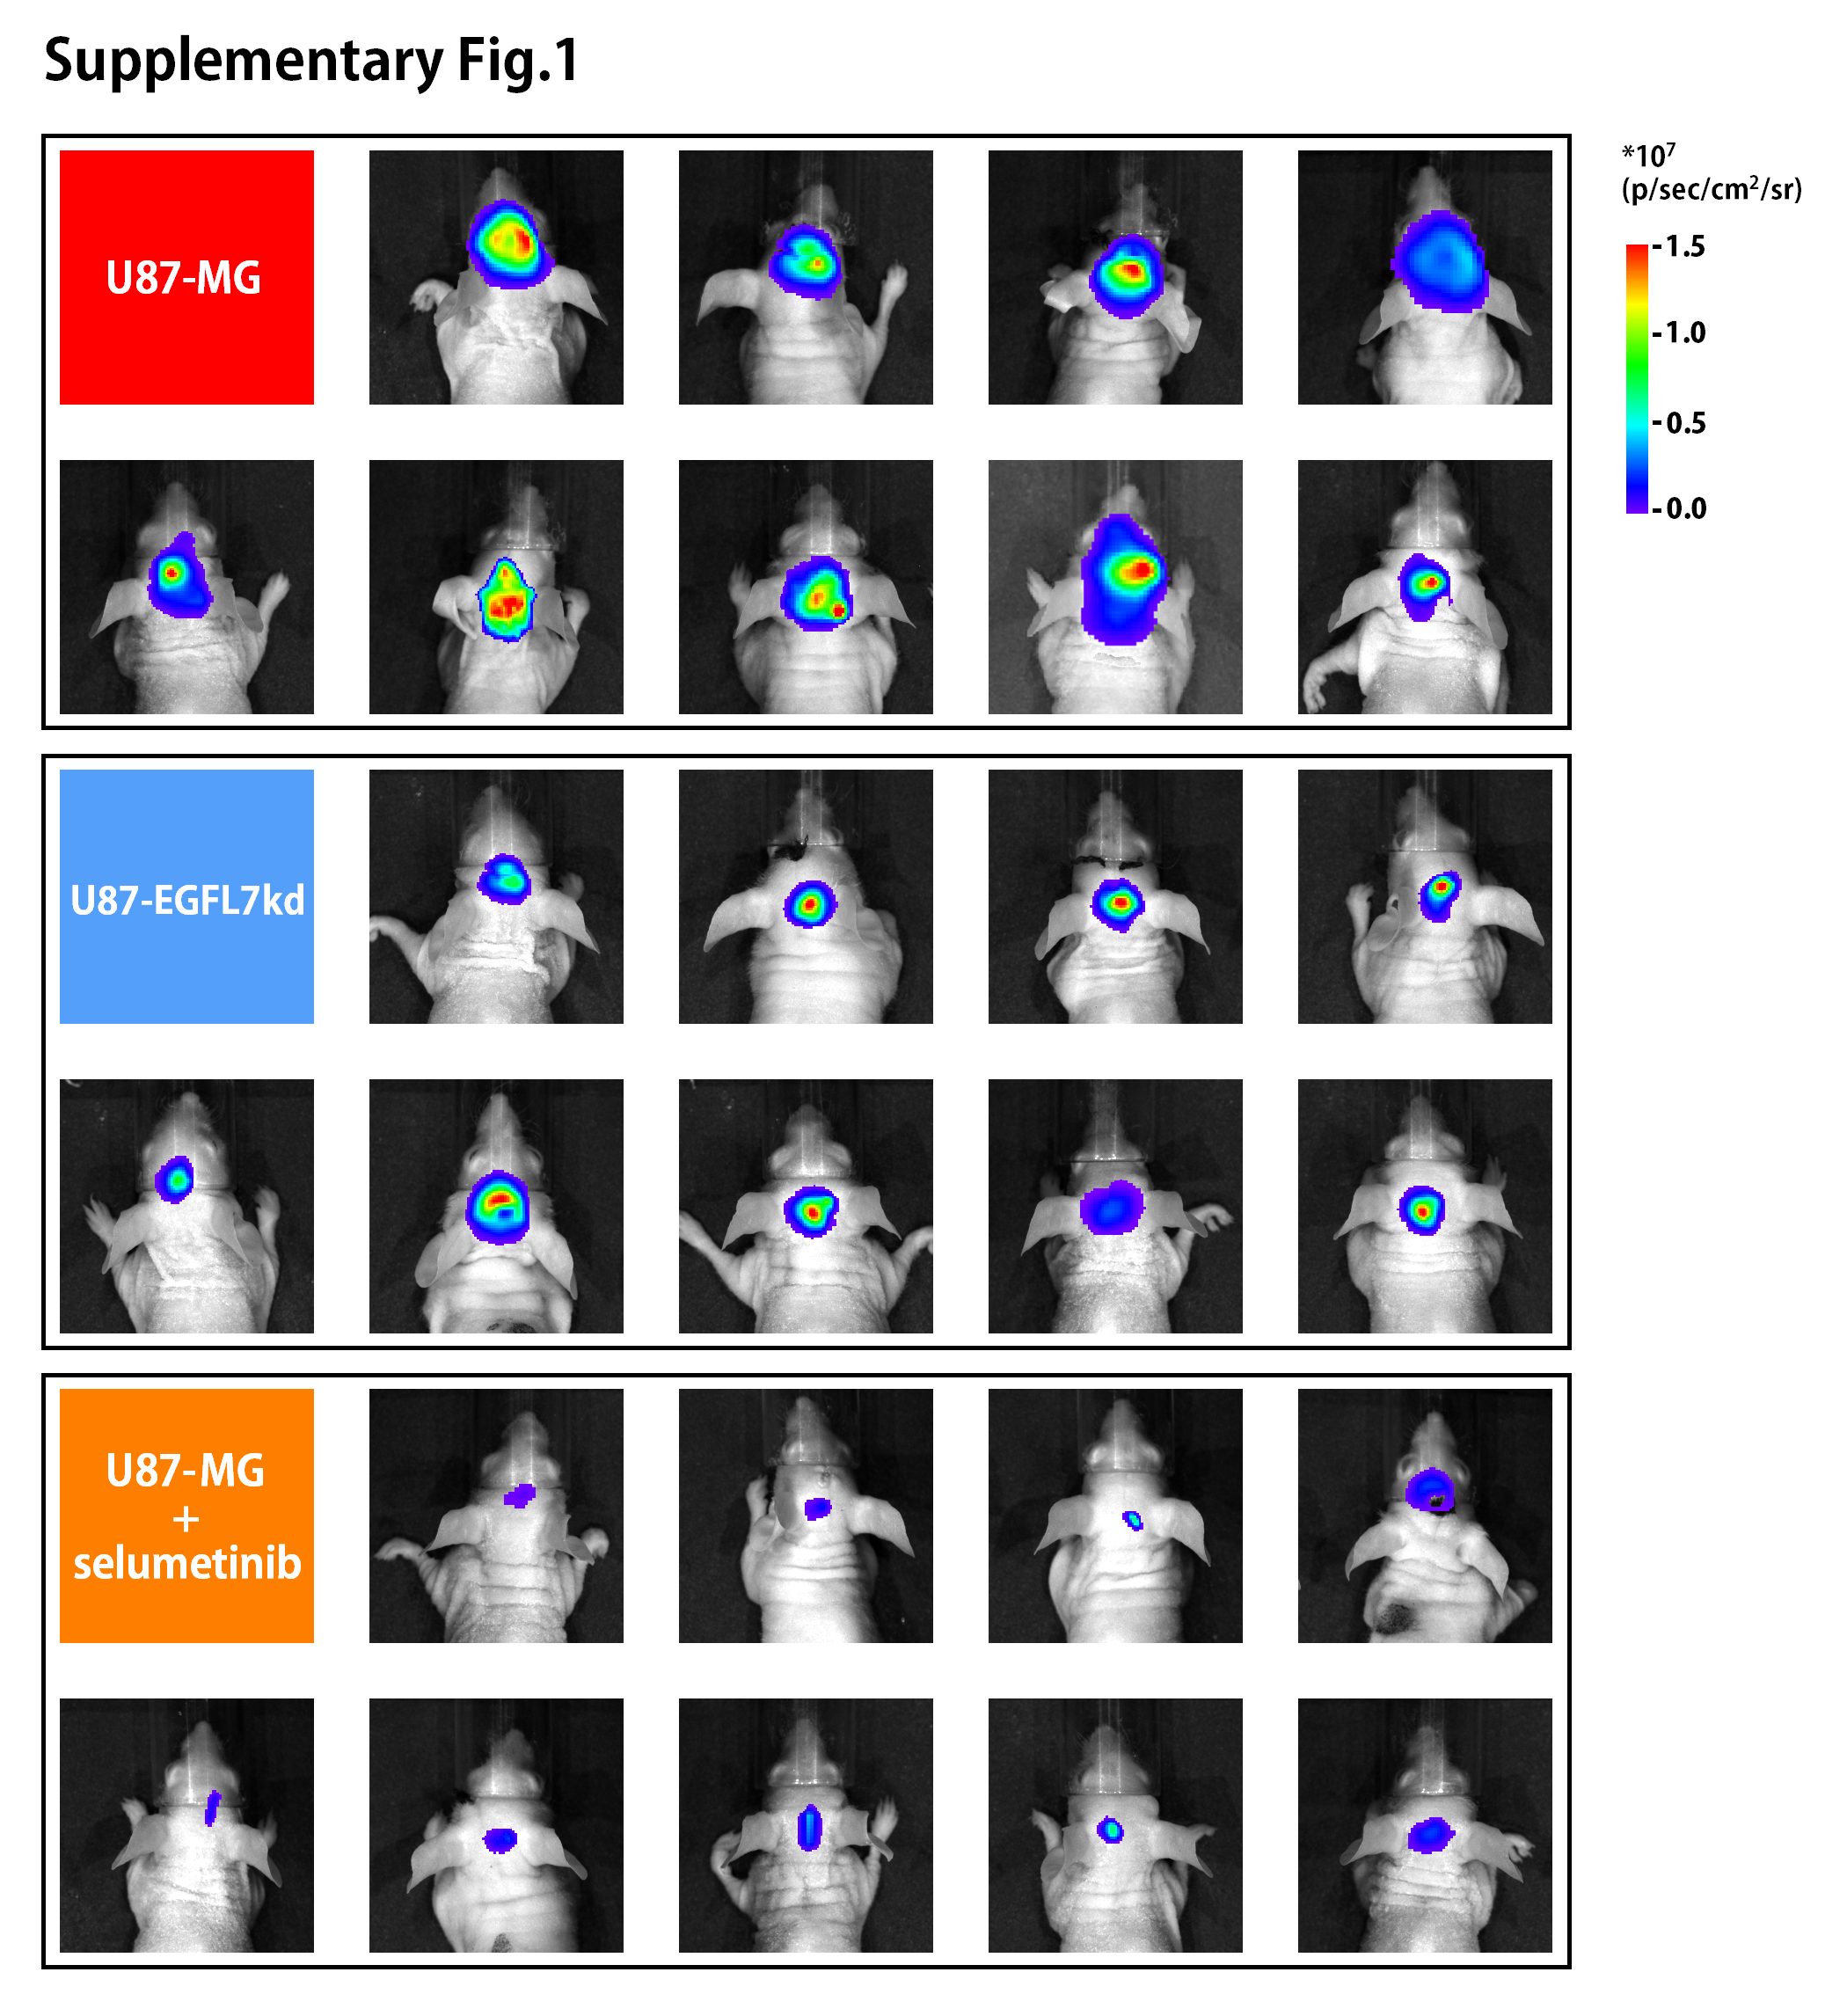
The intracranial signal intensity of the EGFL7 knockdown group and the selumetinib treatment group indicated differences in tumor volume on the 14th day after tumor cell injection (Figure 5A and B, and Supplementary Fig. S1). The mouse survival analysis (Figure 5C) and IHC staining for KI67 (Figure 5D) indicated that selumetinib effectively inhibited the growth of U87 glioma in mice and, to a certain extent, prolonged the survival of mice.

Quantification of the staining intensity showed that both ERK and PKM2 expression were positively correlated with EGFL7 expression among intracranial tumor specimens from mice (Figure 5E). Furthermore, the local treatment of selumetinib inhibited tumor growth (Figure 5A) and reduced the phosphorylation of ERK and PKM2 (Figure 5E).
4 DISCUSSION
In the present study, we systematically analyzed the proteomic profiles of 10 EGFR-positive and 10 EGFR-negative glioma cases. Our proteomic screening demonstrated that EGFL7 expression was higher in EGFR-positive than in EGFR-negative tumor tissues. Furthermore, verified the effect of EGFL7 on the proliferation of glioma cells and confirmed the EGFL7-induced activation of the EGFR pathway.
In the present study, the identified signature proteins in EGFR-positive tumors indicated that the proteomic signatures of EGFR resembled most findings from transcriptomics. Although some discrepancies between transcriptomic and proteomic profiles existed, we found that differentially expressed proteins between EGFR-positive and -negative patients showed a general consistence to the transcriptomic profile. For example, the TCGA cohort research showed an enrichment of PI3K-Akt signaling pathway genes in EGFR-amplified patients [20]. Our proteomic data also demonstrated elevated expression of proteins in the PI3K-Akt pathway in EGFR-positive patients, such as phosphatidylinositol 3-kinase (PI3K), ERK, MEK, PKM2, and so on. At protein levels, molecular networks such as angiogenesis, degradation, proliferation, survival, and apoptosis were observed in the proteomic profiles of the EGFR-positive glioma patients [21-24]. Interestingly, we also identified some unreported overexpressed proteins in both cultured cells and patient samples, including EGFL7, Ca+2-dependent kinase (CaMK), casitas B-lineage lymphoma (CBL), H2A histone family member X (H2AX), epidermal growth factor receptor substrate 15 (ESP15), and non-catalytic region of tyrosine kinase (NCK), highlighting potential treatment targets in glioma.
One of the EGFR characteristic proteins that attracted our interest was EGFL7. The EGFL7 gene encodes a 30 kDa secreted protein. EGFL7 is an early embryonic gene that is down-regulated or not expressed in most normal differentiated mature tissues but is highly expressed in vascular tissue-rich organs such as the lung, heart, and uterus [25]. Currently, it is believed that the main function of EGFL7 is to participate in the formation of tubular structures during the vascular development of vertebrate embryos [26]. The main effect of EGFL7 might be to regulate the cluster migration of endothelial cells during angiogenesis. Previously, we reported positive correlations of EGFL7 expression with glioma proliferation and microvascular density, which also indicated its angiogenesis enhancement role [27].
Nowadays, increasing studies have shown that EGFR-positive glioma cells from particular subpopulations secrete proteins that affect tumor microenvironment [28-30], eventually leading to paracrine stimulation of the growth, invasiveness, and metastasis of peripheral tumor cells. EGFL7 is a protein with outstanding features in secretomics. EGFL7 is overexpressed in many human cancers, including breast cancer, lung cancer, liver cancer, colon cancer, nasopharyngeal cancer, and so on [26]. EGFL7 is also involved in angiogenesis in solid tumors [31, 32]. Increasing evidence shows that EGFL7 plays a key role in the initiation and development of glioma [33]. EFGL7 gene in the EGFR pathway is also negatively correlated with glioma prognosis [34].
Membrane-associated EGFL7-induced downstream factor phosphorylation is a representative transformation event for primary brain tumors, with almost 50% of patients with glioblastoma displaying overexpression of EGFL7 [35].
Other angiogenic growth factors and their receptors, such as vascular endothelial growth factor receptor (VEGFR), fibroblast growth factor receptor (FGFR), mesenchymal epithelial transition (MET), platelet-derived growth factor receptor A (PDGFRA), and adhesion molecules, showed a heterogeneous expression pattern in EGFR-positive glioma, indicating a complicated tumor micro-environment of glioma and resulting urgent challenge for treatment [36, 37]. In the present study, EGFL7 overexpression was observed to be associated with high tumor grade and short OS. We believe that these phenomena are activated by EGFR. EGFR phosphorylation results in increased transcription and extracellular secretion of EGFL7, suggesting that EGFR carcinogenicity in glioma cells is driven by its expression induced by EGFL7. In our previous study, EGFL7 was identified as a ligand that binds to EGFR [27]. We hypothesized that the paracrine loop extending from EGFR to EGFL7 played a key role in glioma invasion and proliferation.
The β-catenin/transcription factor 4 (TCF4) transcription is the last step in EGFR-stimulated cell proliferation. To further clarify the relationship between EGFL7-activating β-catenin/TCF4 transcription and the proliferation of human glioma, we used the MEK activity inhibitor selumetinib to inhibit the activity of the EGFL7-EGFR-ERK axis. Selumetinib was originally discovered by Array BioPharma [38]. This agent is an oral, potent, selective MEK inhibitor that inhibits the MEK pathway in tumor cells, thereby preventing tumor growth [39, 40]. MEK is part of the EGFL7-EGFR-ERK axis, which is often activated in cancer cells and is elevated in many solid tumors, including tumors carrying KRAS mutations [41, 42]. A study is currently underway to evaluate first-line treatment comprising selumetinib and chemotherapy for metastatic uveal melanoma [43, 44]. In addition to uveal melanoma, AstraZeneca is also investigating selumetinib in the treatment of KRAS-mutated lung cancer and thyroid cancer in a phase III trial [45] and of type I neurofibroma in children in a phase II clinical study [46]. In the present study, U87-MG and U251-MG cell lines received selumetinib intervention. The results showed that certain concentrations of selumetinib directly inhibited the activity of the downstream factors MEK and PKM2 and led to elimination of EGFR tumorigenic effect. When we injected selumetinib into tumor-bearing mice, we found that it inhibited the growth of glioma cells and extended the survival of mice. By analyzing the IHC results, we found that low EGFL7 levels were significantly associated with decreased phosphorylation of ERK and PKM2. This result was also consistent with the reported effect of selumetinib on the EGFR pathway [47].Our study had several limitations. Firstly, we selected and analyzed only two cell lines due to the research scale. Secondly, the intratumoral injection was used as delivery approach in this study, which limited the real-world application. Thirdly, the whole-proteome level anti-EGFR effects of selumetinib were still waiting to be revealed. We are working on above-mentioned topics.
5 CONCLUSIONS
Our study revealed the proteomic landscape in EGFR-positive glioma, and EGFL7 could act as an activator for EGFR to promote glioma cell proliferation. Selumetinib may target the EGFR pathway and improve the prognosis of EGFR-positive glioma. We believe that EGFL7 may serve as a diagnostic biomarker and promising therapeutic target of gliomas.
DECLARATIONS
ETHICS APPROVAL AND CONSENT TO PARTICIPATE
This study was approved by the Research Ethics Committee of Xiangya Hospital. Written informed consent was obtained from all patients.
CONSENT FOR PUBLICATION
Not applicable.
AVAILABILITY OF DATA AND MATERIALS
The CGGA and TCGA datasets analyzed for this study are available as indicated in the Materials and Method section. The proteomic cohort data are available from the corresponding author upon reasonable request.
CONFLICT OF INTEREST
We declare that no conflict of interest exits in the submission of this manuscript. Additionally, the manuscript is approved by all authors for publication. I would like to declare on behalf of my co-authors that the work described was original research that has not been published previously.
AUTHORS’ CONTRIBUTIONS
Dr. Fei-yi-fan Wang conducted the major molecular biology and animal experiments; Dr. Si-yi Wang-gou designed the experiment and processed the data; Dr. Hang Cao and Dr. Nian Jiang conducted the cell culture and animal experiments; Dr. Qi Yang and Dr. Qi Huang participated in the experimental design and paper writing; Prof. Chun-hai Huang participated in the paper writing; Prof. Xue-jun Li managed the research, designed the experiments, and provided financial support.
FUNDING
This work was supported by grants from the National Natural Science Foundation of China (81770781 to XJL), Hunan Provincial Innovation Foundation for Postgraduate (CX2018B114 to FYFW), the Fundamental Research Funds for the Central Universities of Central South University (2018zzts043 to FYFW), and China Scholarship Council (201806370130 to FYFW).
ACKNOWLEDGMENTS
We thank Elixigen for professional editing services.
