
Quantitative determination of pancreas size using anatomical landmarks and its clinical relevance: A systematic literature review
Abstract
There have been many reports of altered pancreas size in diseases of the endocrine and exocrine pancreas, but few attempts to quantify such changes. The aim of this study was to conduct a systematic literature review, documenting the methodology, and quantitative data in studies reporting on pancreas size. Three electronic databases (Embase, Scopus, and MEDLINE) were searched by two reviewers independently. Studies of humans were included if they compared pancreas size (reported as pancreas diameters, areas, and/or lengths) between diseased populations and controls. A total of 28 studies with 3,810 individuals were included. Among these, 22 measured pancreas diameters, seven measured pancreas areas, and one measured pancreas lengths. The most common landmark for the head of the pancreas was the confluence of the superior mesenteric and splenic veins (three out of nine studies, 33.3%); for the body it was the superior mesenteric artery (seven out of nine, 77.8%); for the tail it was the internal border of the left kidney (two out of six, 33.3%). Pancreas diameters and areas tended to be smaller in diabetes mellitus, the extent of reduction being greater in individuals with type 1 than type 2 diabetes. Pancreas diameters tended to be greater in acute pancreatitis and pancreatic cancer but not in chronic pancreatitis. Pancreas diameters are a clinically relevant measure for diseases of the endocrine and exocrine pancreas. Consensus guidelines need to be developed to standardize their measurements. Clin. Anat. 31:913–926, 2018. © 2018 Wiley Periodicals, Inc.
INTRODUCTION
Diseases of the endocrine and exocrine pancreas entail an increasing health and socioeconomic burden globally. Diabetes mellitus, a spectrum of chronic metabolic disorders characterized by chronic hyperglycemia with a central component of pancreatic endocrine dysfunction, has been reported to affect >400 million individuals worldwide. In 2015, 1.6 million deaths were directly attributable to diabetes mellitus, and hyperglycemia was a significant risk factor in a further 2.2 million cardiovascular deaths (WHO, 2017). Diseases of the exocrine pancreas includes acute pancreatitis, chronic pancreatitis, and pancreatic cancer. A recent meta-analysis reported that acute pancreatitis has the highest global incidence (33.7 cases per 100,000 person-years), while pancreatic cancer has the highest mortality rate (6.9 deaths per 100,000 person-years) (Xiao et al., 2016). Diseases of the exocrine pancreas lie on a continuum and there is strong evidence supporting a transition from acute to chronic pancreatitis via recurrence of the acute condition, driven by risk factors such as tobacco smoking and heavy alcohol consumption (Sankaran et al., 2015). Chronic pancreatitis has both endocrine and exocrine sequelae—diabetes of the exocrine pancreas and pancreatic exocrine insufficiency—in addition to causing a significantly increased risk of pancreatic cancer (Lew et al., 2017).
23217Alterations of pancreas size in diseases of the endocrine and exocrine pancreas have been discussed extensively in the literature, but few researchers have quantified the changes. Pancreas size can be quantified by noninvasive imaging via straightforward yet underused measurements such as pancreas volumes, diameters, areas, and lengths. While total pancreas volume provides a quantitative holistic measurement of pancreas size (DeSouza et al., 2018), the latter three measurements differ from it in several regards. First, they are typically applied to different regions of the pancreas, allowing regional alterations in size to be investigated. Various anatomical landmarks have been reported either to demarcate the different regions and/or to act as reference points for measurements. Second, the unidimensional parameters of pancreas diameter and length are measured along different axes, allowing for investigation into axial differences in pancreas size changes. Third, the latter three measurements are less time-consuming to obtain than total pancreas volume. Therefore, while these parameters do not provide a holistic assessment of pancreas size, they complement volumetry by providing information about regional alterations of pancreas size with regard to different axes. However, the clinical relevance of these parameters of pancreas size across a range of diseases has not been systematically reviewed to date.
The aims of the present study were to systematically document all studies investigating pancreas size using pancreas diameters, areas, and/or lengths in both diseased and normal human populations, to document the methodologies of these studies, in particular the anatomical landmarks used, and to amalgamate quantitative data about pancreas size across a range of diseases in a manner easily understandable by clinicians.
MATERIALS AND METHODS
Search Strategy
The search strategy was designed in consultation with an experienced subject (Supporting Information S1). A systematic literature search was conducted independently by two authors using three electronic databases—Embase, Scopus, and MEDLINE—up to January 7, 2017. The earliest article retrieved was published in 1946. The screening process involved the removal of duplicates, followed by screening of articles on the basis of title and abstract. Relevant articles were identified for full text review and were examined for eligibility by the same two authors. Relevant articles were also identified through the reference lists of full text articles. Any disagreement about eligibility was resolved by discussion with the senior author.
Eligibility Criteria
Studies were included in this systematic review if they reported on pancreas size as measured by diameters, areas, and/or lengths in both clearly-defined normal and diseased human populations. The following were excluded: case reports, case series (fewer than ten individuals), interventional/experimental studies without baseline data, postmortem studies, studies involving cohorts of exclusively diseased or normal populations, and studies not in the English language.
Definitions
Definitions of normality and disease were accepted as reported by the authors of the primary studies. Normality was defined as the absence of pancreatic disease in all studies that included individuals within control cohorts. Most of these studies further excluded other abdominal pathologies. Insulin-dependent and non-insulin-dependent diabetes mellitus were taken to be type 1 (T1DM) and type 2 (T2DM) diabetes mellitus, respectively. Tropical pancreatic diabetes was taken to be diabetes of the exocrine pancreas (DEP).
Data Collection
Data on the following were collected: study characteristics (publication year, study country, study type, imaging modality, and imaging protocols), study population characteristics [disease setting, total number of individuals, sex ratio, age, body mass index, disease duration, measurements of pancreas endocrine function (e.g., blood glucose, glycated hemoglobin, or C-peptide), and measurements of pancreas exocrine function (direct measurements such as pancreatic juice  concentration and indirect measurements such blood amylase, lipase, and trypsin, or fecal elastase and fat content)], and measurements of pancreas size (anatomical landmarks used, axes of measurement, and diameters, areas, and lengths as reported for the head, body, and tail of the pancreas).
RESULTS
Study Characteristics
The total number of articles retrieved from the three databases was 3,864. After duplicates had been removed (n = 1,574), 2,290 articles were screened on the basis of title and abstract. Full texts were obtained for 118 articles that were further screened for inclusion (Fig. 1). Finally, 28 studies (encompassing 3,810 individuals) met the eligibility criteria and were included in the systematic review (Table 1). Of these, 23 (encompassing 3,492 individuals) used transabdominal ultrasound (US), four (encompassing 215 individuals) used computed tomography (CT), and one (encompassing 103 individuals) used magnetic resonance (MR) imaging (Table 2).

Flowchart of study selection process.
| Study | Country | Type | Study groups | Total number of individuals (n) | Males n (%) | Age (mean ± SD), years | BMI (mean ± SD), kgm−2 |
|---|---|---|---|---|---|---|---|
| Altobelli et al., 1998 | Italy | Obs + CS | Normala | 60 | 30 (50.0) | NRb | NR |
| T1DMa | 60 | 30 (50.0) | NRb | NR | |||
| Alzaid et al.,1993 | Saudi Arabia | Obs + CS | Normal | 19 | 4 (21.1) | 37.0 ± 15.0 | NR |
| T1DM | 14 | 11 (78.6) | 26 ± 10 | NR | |||
| T2DM | 43 | 22 (51.2) | 51 ± 10 | NR | |||
| Arger et al., 1979 | USA | Obs + RC | Normal, AP, PCa, RPc | 407d | NR | NR | NR |
| Basiratnia et al., 2007 | Iran | Obs + CS | Normal | 60 | NR | NR | NR |
| T1DM + T2DM | 60 | NR | NR | NR | |||
| Bilgin et al., 2009 | Germany | Obs + RC | Normal | 21 | 9 (42.9) | 26.1 ± 4.3 | NR |
| CPe | 82 | 54 (65.9) | 60.2 ± 12.9 | NR | |||
| Brunova et al.,1986 | Czech Republic | Obs + CS | Normal | 14 | NR | 39.1 ± 6.9 | NR |
| T1DMf | 21 | 13 (61.9) | 35.9 ± 8.1 | NR | |||
| Coleman et al.,1983 | USA | Obs + CS | Normala | 70 | NR | NRb | NR |
| AP | 25 | NR | NRb | NR | |||
| Cuntz et al.,2000 | Germany | Int + PC | Other psychiatric disorders | 24 | NR | 27.6 ± 4.6 | 22.6 ± 3.8 |
| PEDg, h | 109 | 2 (1.8) | 26.1 ± 12.5 | 15.9 ± 4.1 | |||
| d'Annunzio et al., 1996 | Italy | Obs + CS | Normal | 12 | NR | NRi | NR |
| T1DM | 15 | 11 (73.3) | 6.7 – 18.5j | NR | |||
| El-Hodhod et al., 2005 | Egypt | Int + PC | Normal | 12 | 5 (41.7) | 1.2 ± 0.6 | NR |
| PEMk | 33 | 15 (45.5) | 1.0 ± 0.7 | NR | |||
| Fonseca et al., 1985 | UK | Obs + CS | Normal | 19 | NR | NR | NR |
| T1DM | 22 | NR | NR | NR | |||
| T2DM | 19 | NR | NR | NR | |||
| T2DM + insulin | 19 | NR | NR | NR | |||
| Fleischer et al., 1983 | USA | Obs + CS | Normal | 17 | NR | 1.7– 16j | NR |
| Pancreatitisl | 21 | NR | 0.6 – 17.0j | NR | |||
| Gilbeau et al., 1992 | Belgium | Obs + CS | Normal | 57 | 27 (47.4) | 60.5 ± 20 (SEM) | NR |
| T1DM | 20 | 10 (50.0) | 48 ± 3.9 (SEM) | NR | |||
| T2DM | 25 | 9 (36.0) | 61.7 ± 2.2 (SEM) | NR | |||
| T2DM + Insulin | 12 | 3 (25.0) | 63.5 ± 9.9 (SEM) | NR | |||
| Migdalis et al., 1991 | Greece | Obs + CS | Normal | 80 | 42 (52.5) | 51.1 ± 7.3 | 26.5 ± 3.2 |
| T2DM | 84 | 44 (52.3) | 52.4 ± 7.2 | 26.8 ± 3.6 | |||
| Mohan et al., 1985 | India | Obs + CS | Normal | 20 | 12 (60.0) | 23 ± 1.2 | 21.3 ± 1.0 |
| DEP | 20 | 12 (60.0) | 25 ± 2.3 | 19.6 ± 0.9 | |||
| MODY | 20 | 11 (55.0) | 26 ± 1.5 | 22.5 ± 1.5 | |||
| T1DM | 20 | 11 (55.0) | 24 ± 2.5 | 20.3 ± 1.2 | |||
| Ohno et al., 1981 | Japan | Obs + CS | Normal | 10 | NR | NR | NR |
| T1DM | 13 | NR | NR | NR | |||
| T2DM | 13 | NR | NR | NR | |||
| Oliviera et al., 2008 | Brazil | Obs + CS | Normal | 14 | NR | NR | NR |
| IGHD—GHRH-R mutant homozygotes | 11 | NR | NR | NR | |||
| Raeder et al., 2008 | Norway | Obs + CS | Normal | 11 | 7 (63.6) | 9.4 ± 2.3 | 18.6 ± 2.9 |
| Nondiabetic MODY-8 CEL mutant homozygotes | 11 | 7 (63.6) | 9.5 ± 3.8 | 16.8 ± 2.5 | |||
| Rajput et al., 2001 | India | Obs + CS | Normal | 15 | NR | NR | NR |
| T1DMm | 35 | NR | NR | NR | |||
| Siegel et al., 1987 | USA | Obs + CS | Normala | 273 | NR | <0.1 – 19j | NR |
| AP | 13 | NR | NRb | NR | |||
| Shawker et al., 1984 | USA | Obs + CS | Normal | 16 | 8 (50.0) | 26.3 ± 10 | NR |
| CF | 16 | 6 (37.5) | 16.3 ± 5 | NR | |||
| Silva et al., 1993 | Brazil | Obs + CS | Normal | 60 | 20 (33.3) | 42.2 ± 16.7 | 22.7 ± 3.0 |
| T1DMm | 40 | 20 (40) | 26.5 ± 11.2 | 20.9 ± 3.0 | |||
| T2DMm | 36 | 6 (16.7) | 60.0 ± 12.6 | 26.4 ± 3.6 | |||
| Soyer et al., 1999 | France | Obs + CS | Normal | 15 | 9 (60.0) | 27 ± 8.3 | NR |
| CF | 15 | 10 (66.7) | 25 ± 6.5 | NR | |||
| Tamura et al., 1988 | Japan | Obs + CS | Normal | 85 | 60 (70.6) | 35.3 ± 9.2 | NR |
| T1DM | 31 | 12 (38.7) | 23.9 ± 7.2 | NR | |||
| T2DM-J | 15 | 4 (26.7) | 25.7 ± 8.4 | NR | |||
| T2DM-M | 23 | 19 (82.6) | 49.7 ± 11.4 | NR | |||
| Taudorf et al., 1984 | Denmark | Int + PC | Normal | 10 | NR | NR | NR |
| Atopy | 7 | NR | NR | NR | |||
| Tosun et al., 2014 | Turkey | Obs + CS | Normal pregnant women | 230 | 0 (0) | 28.1 ± 5.7 | 24.6 ± 2.9 |
| GDM | 28 | 0 (0) | 26.6 ± 5.3 | 24.7 ± 2.9 | |||
| Treiber et al., 2016 | Germany | Obs + CS | Normal | 921 | 443 (48.1) | 40.5 ± 12.6 | 23.7 ± 4.3 |
| CP | 72 | 41 (56.9) | NR | NR | |||
| Valean et al., 1997 | Romania | Obs + CS | Normal | 108 | NR | NRb | NR |
| T1DM | 27 | NR | 0.7 – 17j | NR |
- Abbreviations: AP, acute pancreatitis; CEL, carboxyl ester lipase; CF, cystic fibrosis; CP, chronic pancreatitis; CS, cross-sectional; DEP, diabetes of the exocrine pancreas; GDM, gestational diabetes mellitus; GHRH-R, growth hormone releasing hormone receptor; IGHD, isolated growth hormone deficiency; Int, interventional; MODY, mature onset diabetes of the young; NR, not reported; Obs, observational; PC, prospective cohort; PCa, pancreatic cancer; RC, retrospective cohort; RP, retroperitoneal pathology; SEM, standard error of the mean; SD, standard deviation; T1DM, type 1 diabetes mellitus; T2DM, type 2 diabetes mellitus; T2DM-J, juvenile onset T2DM; T2DM-M, mature onset T2DM.
- a Further stratified by age.
- b Age was not reported as a mean or by range, but this group comprised infants, children, and adolescents.
- c Comprises patients with primary retroperitoneal masses or metastatic retroperitoneal lymph nodes not of pancreatic origin, within the peri-pancreatic area.
- d This is the total number of individuals in the study; however, the total number of individuals per group is not reported, but rather the total number of ultrasound scans. Normal: 168 scans, AP: 236 scans, PCa: 35 scans, and RP: 16 scans.
- e Further stratified by the presence of diabetes mellitus and pancreatic exocrine insufficiency.
- f Further stratified by serum C-peptide serum concentrations.
- g Subgroups statistically combined.
- h Includes subgroups of anorexia nervosa (restrictive type), anorexia nervosa (bulimic type), bulimia nervosa (restrictive type), and bulimia nervosa (purging type).
- i Age was not reported as a mean or by range, but this group comprised children and adolescents.
- j Range.
- k Includes subgroups of kwashiorkor, marasmus and marasmic kwashiorkor malnutrition.
- l Comprises 19 patients with acute pancreatitis and two with chronic pancreatitis. The two individuals with chronic pancreatitis were not included in any analyses.
- m Further stratified by disease duration.
All 28 studies reported on pancreas size in diseased cohorts and respective control cohorts. Nineteen of them included a single cohort of diseased individuals and nine included multiple cohorts of different diseases (Table 1). Overall, nine disease settings were covered: diabetes mellitus [T1DM (12 cohorts), T2DM (seven cohorts), mature onset diabetes of the young (two cohorts), DEP (one cohort), gestational diabetes mellitus (one cohort), and mixture of T1DM and T2DM (one cohort)], pancreatitis [acute (four cohorts) and chronic alone (two cohorts)], cystic fibrosis (two cohorts), pancreatic cancer (one cohort), allergy to soy protein (one cohort), isolated growth hormone deficiency (one cohort), retroperitoneal pathologies (one cohort), protein energy malnutrition (one cohort), and psychiatric eating disorders (one cohort) (Table 1).
Anatomical Landmarks
Pancreas diameters
Twenty-two studies measured pancreas diameters (Table 2). Sixteen measured the diameters across the head, body, and tail, three across the head and body, two across the body only, and one across the head only (Table 3). The most commonly measured region was the body (n = 21, 95.5%) and the least was the tail (n = 16, 72.7%).Twelve studies used landmarks to demarcate regions of the pancreas and/or to act as reference points for diameter measurements (Ohno et al., 1981; Fleischer et al., 1983; Taudorf et al., 1984; Brunova et al., 1986; Siegel et al., 1987; Gilbeau et al., 1992; Silva et al., 1993; Valean et al., 1997; Altobelli et al., 1998; Soyer et al., 1999; Cuntz et al., 2000; Treiber et al., 2016).
| Study | Imaging modality | Quantitative Measurements | Landmarks | ||||
|---|---|---|---|---|---|---|---|
| Diameters | Areas | Length | Head | Body | Tail | ||
| Altobelli et al.,1998 | US | Yes | Yes | No | Right of the confluence of the SMV and SV. | Left of the confluence of the SMV and SV. | Anterior to the left kidney. |
| Alzaid et al.,1993 | US | No | Yes | No | Right of the confluence of the SMV and SV. | Left of the confluence of the SMV and SV. | Anterior to the left kidney. |
| Arger et al.,1979 | US | Yes | No | No | NR | NR | NR |
| Basiratnia et al.,2007 | US | Yes | No | No | NR | NR | NR |
| Bilgin et al., 2009 | MR | Yes | No | No | NR | NR | NR |
| Brunova et al., 1986 | CT | Yes | No | No | NR | Anterior to the SMA. | Halfway between the left lateral border of a lumbar vertebral body and the spleen. |
| Coleman et al., 1983 | US | Yes | No | No | NR | NR | NR |
| Cuntz et al.,2000 | US | Yes | No | No | Middle of the confluence of the SMV and SV. | Anterior to the SMA. | NR |
| d'Annunzio et al.,1996 | US | No | Yes | No | NR | NR | NR |
| El-Hodhod et al.,2005 | US | Yes | No | No | NR | NR | NR |
| Fonseca et al., 1985 | US | No | Yes | No | Right of the SMV. | NR | Anterior to the left kidney. |
| Fleischer et al., 1983 | US | Yes | No | No | NR | Anterior to the SV. | NR |
| Gilbeau et al., 1992 | CT | Yes | No | No | Right of the SMA and SMV. | In line with left border of a lumbar vertebral body. | In line with the internal border of the left kidney. |
| Migdalis et al., 1991 | US | No | Yes | No | Right of the SMV. | Anterior to the SV. | NR |
| Mohan et al., 1985 | US | Yes | No | Yes | NR | NR | NR |
| Ohno et al., 1981 | CT | Yes | No | No | NR | In line with the SMA. | NR |
| Oliveira et al., 2008 | US | Yes | No | No | NR | NR | NR |
| Raeder et al.,2008 | US | Yes | No | No | NR | NR | NR |
| Rajput et al., 2001 | US | No | Yes | No | NR | NR | NR |
| Shawker et al., 1984 | US | Yes | No | No | NR | NR | NR |
| Siegel et al., 1987 | US | Yes | No | No | Right of the confluence of the SMV and SV.a | In line with the SMA.a | NR |
| Silva et al., 1993 | US | Yes | No | No | Anterior to the IVC. | Anterior to the SMA. | In line with the left lateral border of a lumbar vertebral body. |
| Soyer et al., 1999 b | CT | Yes | No | No | In line with the right side of the SMV. | In line with the left lateral border of the lumbar vertebral body. | In line with the internal border of the left kidney. |
| Tamura et al., 1988 | US | No | Yes | No | NR | Anterior to the SMA. | NR |
| Taudorf et al., 1984 | US | Yes | No | No | Anterior to the middle of the HPV. | In line with the SMA. | 10–20 mm to the left of the SMA. |
| Tosun et al., 2014 | US | Yes | No | No | NR | NR | NR |
| Treiber et al., 2016 | US | Yes | No | No | In line with the middle of the confluence of the SMV and SV.a | NR | In line with the middle of the SV.a |
| Valean et al., 1997 | US | Yes | No | No | Anterior to the IVC. | In line with the SMA. | NR |
- Abbreviations: CT, computed tomography; HPV, hepatic portal vein; IVC, inferior vena cava; MR, magnetic resonance; NR, not reported; SMA, superior mesenteric artery; SMV, superior mesenteric vein; SV, splenic vein; US, transabdominal ultrasound.
- a Landmarks interpreted from an image.
- b This study also reported pancreas neck diameters. The superior mesenteric artery was the reference anatomical landmark.
In studies reporting on landmarks for the head (n = 9), all but one used them as reference points for diameter measurements (Taudorf et al., 1984; Siegel et al., 1987; Gilbeau et al., 1992; Silva et al., 1993; Valean et al., 1997; Soyer et al., 1999; Cuntz et al., 2000; Treiber et al., 2016). The most common landmark used as a reference point for the head was the confluence of the superior mesenteric and splenic veins (n = 3, 33.3%). Two studies used the middle of the confluence as the specific reference point (Cuntz et al., 2000; Treiber et al., 2016) while one used the confluence's rightmost point in a similar fashion (Siegel et al., 1987). The remaining study (Altobelli et al., 1998) used the confluence of the superior mesenteric and splenic veins to demarcate the head (to its right) from the body (to its left), allowing the greatest diameter to be measured.
Among the studies reporting on landmarks for the body (n = 10), nine used them as reference points for diameter measurements (Ohno et al., 1981; Fleischer et al., 1983; Taudorf et al., 1984; Brunova et al., 1986; Gilbeau et al., 1992; Silva et al., 1993; Valean et al., 1997; Soyer et al., 1999; Cuntz et al., 2000). The most common landmark used as a reference point for the body was the superior mesenteric artery (n = 7, 77.8%) (Ohno et al., 1981; Taudorf et al., 1984; Brunova et al., 1986; Siegel et al., 1987; Silva et al., 1993; Valean et al., 1997; Cuntz et al., 2000). The remaining study (Altobelli et al., 1998) defined the body as being to the left of the confluence of the superior mesenteric and splenic veins, and used this landmark for demarcation.
In studies reporting on landmarks for the tail (n = 7), six used them as reference points for diameter measurements (Taudorf et al., 1984; Brunova et al., 1986; Gilbeau et al., 1992; Silva et al., 1993; Soyer et al., 1999; Treiber et al., 2016). The most common landmark used as a reference point was the internal border of the left kidney (n = 2, 33.3%) (Gilbeau et al., 1992; Soyer et al., 1999). Tail diameters were measured from the intersection of the pancreas parenchyma with a line drawn in extension from the internal border of the left kidney. The remaining study (Altobelli et al., 1998) used the left kidney to demarcate the tail from the body by defining the region as anterior to the left kidney.
Diameters were measured along either the antero-posterior (AP), cranio-caudal (CC), or transverse axis, or in relation to the organ's midline (either perpendicular or parallel to it). Twenty-one studies reported on the axes used and one did not. The AP axis was most commonly used for diameters across all three regions [head (n = 16, 88.9%); body (n = 19, 90.5%); tail (n = 12, 92.3%)].
Pancreas areas
Seven studies measured pancreas areas (Table 2). Six reported on total pancreas area; four of them measured this as the maximal transverse area visualized in one image (Migdalis et al., 1991; d'Annunzio et al., 1996; Altobelli et al., 1998; Rajput et al., 2001) and two measured it as an aggregation of regional areas viewed in different images (Fonseca et al., 1985; Alzaid et al., 1993). Five studies reported on regional areas along longitudinal planes; one of these reported on areas of the head, body, and tail (Rajput et al., 2001), three of the head and body (Fonseca et al., 1985; Migdalis et al., 1991; Alzaid et al., 1993), and one just the body (Tamura, 1988). The body was measured in all five studies reporting on regional areas so it was the most commonly measured region (n = 5, 100.0%), whereas the tail was least commonly measured (n = 1, 20.0%) (Rajput et al., 2001).
All but two studies (d'Annunzio et al., 1996; Rajput et al., 2001) reported on the landmarks used to demarcate regions of the pancreas and/or to act as reference points for measurements. All studies reporting on landmarks for the head (n = 4) defined it as being to the right of the confluence of the superior mesenteric and splenic veins and/or the superior mesenteric vein (Fonseca et al., 1985; Migdalis et al., 1991; Alzaid et al., 1993; Altobelli et al., 1998). In studies reporting on landmarks for the body (n = 4), it was most commonly defined as being to the left of that same venous confluence (n = 2, 50%) (Alzaid et al., 1993; Altobelli et al., 1998). Only two studies reported on landmarks used for the tail and both defined it as the region directly anterior to the left kidney (Fonseca et al., 1985; Alzaid et al., 1993).
Pancreas lengths
In the one study reporting on total pancreas length (which also measured pancreas diameters) (Mohan et al., 1985), measurements were taken from the right lateral-most point of the head (abutting the second part of the duodenum) to the left lateral-most point of the tail. This required the amalgamation of multiple measurements from multiple oblique scans.
Pancreas Diameters
Diabetes mellitus
Ten studies investigated pancreas diameters in the setting of diabetes mellitus. Three of them included separate T1DM and T2DM cohorts (Ohno et al., 1981; Gilbeau et al., 1992; Silva et al., 1993), three included only T1DM cohorts (Brunova et al., 1986; Valean et al., 1997; Altobelli et al., 1998), one a gestational diabetes mellitus (GDM) cohort (Tosun et al., 2015), one a mature onset diabetes of the young type 8 (MODY-8) cohort (Raeder et al., 2008), one separate cohorts of diabetes of the exocrine pancreas (DEP), MODY (type unspecified), and T1DM (Mohan et al., 1985), and one a mixed T1DM and T2DM cohort (Basiratnia et al., 2007) (Table 3).
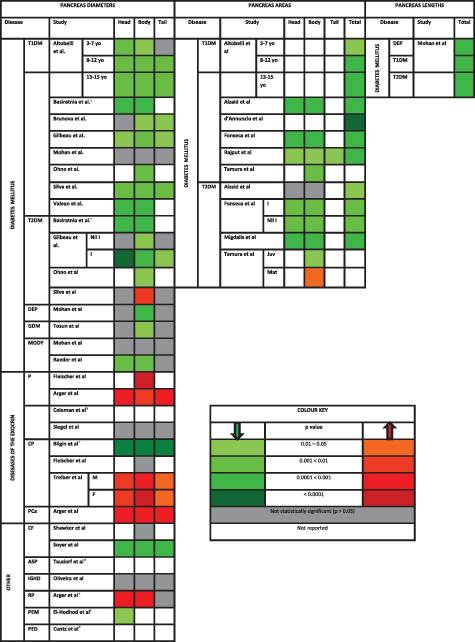
|
- Abbreviations: ASP, allergy to soy protein; CF, cystic fibrosis; CP, chronic pancreatitis; DEP, diabetes of the exocrine pancreas; F, female; GDM, gestational diabetes mellitus; I, insulin; IGHD, isolated growth hormone deficiency; Juv, juvenile; M, male; Mat, mature; MODY, mature onset diabetes of the young; P, pancreatitis; PCa, pancreatic cancer; PED, psychiatric eating disorders; PEM, protein-energy malnutrition; RP, retroperitoneal pathology.
- a Differences between T1DM and T2DM individuals and controls were reported separately; however, the subject characteristics were reported for the mixed group of T1DM and T2DM.
- b No P values reported; however, isolated pancreas head and tail enlargement was more frequent than in controls.
- c Total pancreas size as measured by the combination of the AP diameters of the head, body, and tail, was significantly smaller in all groups of CP patients than controls (P < 0.0001).
- d Pancreas diameters, though they were measured, were not compared with controls.
- e Comprises a variety of nonpancreatic retroperitoneal masses that abutted the pancreas thereby increasing pancreas size measurement.
- f Head diameters used to calculate head volume. [Color table can be viewed at wileyonlinelibrary.com]
The most common finding from these studies was that pancreas diameters in individuals with T1DM were significantly lower than in controls (seven out of eight studies). Five studies measured diameters across the head, body, and tail; three of these measured AP diameters (Mohan et al., 1985; Brunova et al., 1986; Silva et al., 1993), one measured both AP and CC diameters (Altobelli et al., 1998), and the other did not specify the axis of measurement (Gilbeau et al., 1992). Among these five studies, three reported on reductions across all three regions (Gilbeau et al., 1992; Silva et al., 1993; Altobelli et al., 1998), one across just the body and tail (Brunova et al., 1986), and one reported no difference from controls (Mohan et al., 1985). Two studies measured AP diameters across the head and body only, and both reported significant reductions in these regions (Valean et al., 1997; Basiratnia et al., 2007). One study measured AP diameters across the body only and reported a significant reduction in this region (Ohno et al., 1981) (Table 3).
Four of the eight studies investigating pancreas diameters in the setting of T1DM also investigated them in the setting of T2DM. The most common finding they reported (three out of four studies) was that pancreas size in individuals with T2DM was intermediate between those with T1DM and controls. Two of these studies reported intermediate AP diameters across the body (Ohno et al., 1981; Gilbeau et al., 1992) and one across both the head and body (Basiratnia et al., 2007). However, one study reported no significant difference in pancreas diameters between T2DM individuals and controls overall (Silva et al., 1993).
The relationship between pancreatic function, both endocrine and exocrine, and pancreas diameter in the setting of T1DM and T2DM was investigated in four studies (Ohno et al., 1981; Brunova et al., 1986; Gilbeau et al., 1992; Altobelli et al., 1998). Pancreatic endocrine function was assessed via glycemic control (by proxy of glycated hemoglobin and the nature of therapy) in two studies (Gilbeau et al., 1992; Altobelli et al., 1998), and by insulin secretion (by proxy of C-peptide) in all four. Glycemic control by glycated hemoglobin did not correlate significantly with pancreas diameter in individuals with T1DM (Altobelli et al., 1998); however, individuals with T2DM requiring exogenous insulin for glycemic control had lower AP diameters across all regions of the pancreas than T2DM individuals treated by diet and oral hypoglycemics (Gilbeau et al., 1992). This same study was also one of the three that reported on insulin secretion and undertook subgroup analyses suggesting a positive relationship between C-peptide and pancreas diameters across both T1DM and T2DM (Ohno et al., 1981; Brunova et al., 1986; Gilbeau et al., 1992). In contrast to the findings of these three studies, one study (undertaking correlation analyses) reported that the relationship between C-peptide and pancreas diameter was not significant in their T1DM cohort. Pancreas exocrine function was only investigated in one study via a pancreatic function test; pancreatic amylase, trypsin, and chymotrypsin were found to be lowest in individuals with the greatest reduction in AP diameter of the body (Ohno et al., 1981).
The relationship between disease duration and pancreas diameter in T1DM and T2DM was investigated in five studies (Brunova et al., 1986; Gilbeau et al., 1992; Silva et al., 1993; Altobelli et al., 1998; Basiratnia et al., 2007). Two of these undertook correlation analyses and both reported significant negative correlations between disease duration and pancreas size across both types of diabetics, one reporting the correlation with head AP diameters (Basiratnia et al., 2007) and the other with tail AP diameters (Gilbeau et al., 1992). The remaining three studies conducted subgroup analyses based on various disease durations. Adolescents between the ages of 13 and 15 years with a T1DM duration greater than five years had the greatest reduction in AP and CC diameters across all regions, and had pancreata that were smaller than those of children between the ages of two and three years who had a T1DM duration less than two years (Altobelli et al., 1998). This finding was reflected in adults with T1DM: individuals with disease duration greater than ten years showed the greatest reduction in AP diameter across all regions of the pancreas in one study (Silva et al., 1993) and across the body and tail in another (Brunova et al., 1986). In contrast, the only study to stratify a T2DM cohort by disease duration reported that pancreas size differed significantly from controls only in a greater body AP diameter after ten years (Silva et al., 1993).
The other three diseases in the diabetes mellitus spectrum that were covered were DEP (Mohan et al., 1985), GDM (Tosun et al., 2015), and MODY (Mohan et al., 1985; Raeder et al., 2008). The results of these studies are presented in Table 3.
Pancreatitis
Six studies investigated pancreas diameters in the setting of pancreatitis: four included patients with acute pancreatitis (Arger et al., 1979; Coleman et al., 1983; Fleischer et al., 1983; Siegel et al., 1987) and two included cohorts of chronic pancreatitis only (Bilgin et al., 2009; Treiber et al., 2016) (Table 3).
Three of the four studies that investigated pancreas diameters in acute pancreatitis reported that enlargement was the most common finding (Arger et al., 1979; Coleman et al., 1983; Fleischer et al., 1983). Two of these studies comprised small cohorts and were based on pediatric populations (Coleman et al., 1983; Fleischer et al., 1983). One measured body AP diameter (adjusted by lumbar vertebral body transverse diameter) and reported that it was significantly larger in children with acute pancreatitis than controls (Fleischer et al., 1983). The other study reported that 60% of children with pancreatitis displayed focal enlargement of the pancreas (86.7% of whom displayed enlargement of the head only and 13.3% of the tail) (Coleman et al., 1983). Notably, the study that reported no significant difference in overall pancreas size between children with acute pancreatitis and controls also reported that focal head enlargement was most commonly seen in those with enlargement of the gland (Siegel et al., 1987). The only study to investigate acute pancreatitis in an adult population reported that head, body, and tail AP diameters were significantly larger in acute pancreatitis patients than controls. Further, head, body, and tail AP diameters exceeded 2.5 cm, 2.0 cm, and 2.0 cm, respectively, in a significantly greater proportion of individuals with pancreatitis than controls [acute pancreatitis (59%, 67%, and 71%) versus controls (0%, 6%, and 3%)] (Arger et al., 1979).
The two studies that investigated pancreas diameters in the setting of chronic pancreatitis alone gave conflicting results. One reported that AP diameters across all three regions of the pancreas were lower in individuals with chronic pancreatitis than controls (Bilgin et al., 2009), whereas the other reported that the AP diameters of the head and body, and the diameters perpendicular to the midline of the tail, were significantly greater in individuals with chronic pancreatitis than controls (Treiber et al., 2016). The latter study also specified that this increase in pancreas diameter was still significant in individuals who had not experienced an acute bout of pancreatitis and had disease duration greater than two years (Treiber et al., 2016).
One study assessed pancreatic exocrine function in the setting of chronic pancreatitis (Bilgin et al., 2009) through fecal elastase-1 tests and reported a significant positive correlation between pancreas size (mean of head, body, and tail AP diameters) and fecal elastase-1. Furthermore, this cohort was stratified into three subgroups: isolated diabetes mellitus (DM), isolated pancreas exocrine insufficiency (PEI), and combined diabetes mellitus and pancreas exocrine insufficiency (DM + PEI). Individuals with DM + PEI had a significantly smaller pancreas size than those with DM alone. Individuals with DM alone did not differ significantly in pancreas size from those with PEI alone. Although it was specified that DM was diagnosed through retrospective review, it was not specified whether those diagnoses were made prior to or after the onset of chronic pancreatitis symptoms.
Pancreatic cancer
One study investigated pancreas diameters in the setting of pancreatic cancer (Arger et al., 1979). It included cohorts of individuals with pancreatic cancer, acute and chronic pancreatitis, retroperitoneal pathologies, and controls (Table 3). The retroperitoneal pathologies comprised primary retroperitoneal masses or metastatic retroperitoneal lymph nodes not of pancreatic origin in the peri-pancreatic area.
Individuals with pancreatic cancer showed both focal and diffuse enlargement of the pancreas. Head, body, and tail AP diameters exceeded 2.5 cm, 2.0 cm, and 2.0 cm in a significantly greater proportion of individuals with pancreatic cancer than controls [pancreatic cancer (80%, 74%, and 42%) versus controls (0%, 6%, and 3%)] (Arger et al., 1979). Further, individuals with pancreatic cancer had a greater frequency of head and body enlargement than those with pancreatitis and retroperitoneal pathologies. Tail enlargement was more frequent in individuals with retroperitoneal pathologies (50%), but this was attributable to poor delineation of the normal tail from surrounding pathology.
However, this study did not report the type of pancreatic cancer (e.g., pancreatic ductal adenocarcinoma versus neuroendocrine tumors etc.) or its staging. Further, the region in which the primary mass was located was not reported, nor were the frequencies of individuals presenting with isolated focal enlargement (due to the primary mass) and/or diffuse enlargement. Finally, it did not specify whether the mass was excluded from pancreas diameter measurements.
Other diseases
Pancreas diameters were also investigated in the settings of cystic fibrosis (Shawker et al., 1984; Soyer et al., 1999), protein-energy malnutrition (El-Hodhod et al., 2005), psychiatric eating disorders (Cuntz et al., 2000), and soy allergy (Taudorf et al., 1984). The results of these studies are presented in Table 3.
Pancreas Areas
All seven studies that investigated pancreas areas were based on diabetes mellitus, of which three included both T1DM and T2DM cohorts (Fonseca et al., 1985; Tamura, 1988; Alzaid et al., 1993), three T1DM cohorts only (d'Annunzio et al., 1996; Altobelli et al., 1998; Rajput et al., 2001), and one a T2DM cohort only (Migdalis et al., 1991) (Table 3).
All six studies that investigated pancreas areas in the setting of T1DM reported that individuals with T1DM had smaller pancreas areas, both total and regional, than controls (Fonseca et al., 1985; Tamura, 1988; Alzaid et al., 1993; d'Annunzio et al., 1996; Altobelli et al., 1998; Rajput et al., 2001). Similarly, three of the four studies investigating pancreas areas in the setting of T2DM reached a similar conclusion (Fonseca et al., 1985; Tamura, 1988; Migdalis et al., 1991; Alzaid et al., 1993). Pancreas area in T2DM was intermediate between that observed in individuals with T1DM and controls (Fonseca et al., 1985; Tamura, 1988; Alzaid et al., 1993).
The relationship between pancreatic function, both endocrine and exocrine, and pancreas area in the setting of T1DM and T2DM was investigated in five studies (Fonseca et al., 1985; Tamura, 1988; Migdalis et al., 1991; Alzaid et al., 1993; Altobelli et al., 1998). Pancreatic endocrine function was assessed through glycemic control (by proxy of glycated hemoglobin and blood glucose) in four studies (Tamura, 1988; Migdalis et al., 1991; Alzaid et al., 1993; Altobelli et al., 1998), and by insulin secretion (by proxy of C-peptide) in three (Migdalis et al., 1991; Alzaid et al., 1993; Altobelli et al., 1998). Neither blood glucose nor glycated hemoglobin was significantly related to pancreas area, but C-peptide correlated positively with pancreas area in both T1DM and T2DM (Migdalis et al., 1991; Alzaid et al., 1993). Pancreatic exocrine function was assessed by serum amylase in one study (Fonseca et al., 1985) and by serum trypsin in another (Tamura, 1988). In the latter study, serum trypsin correlated positively with unadjusted pancreas body area and with the area adjusted for height and weight in individuals with both T1DM and T2DM (Tamura, 1988).
The relationship between disease duration and pancreas area in the setting of T1DM and T2DM was investigated in six studies (Fonseca et al., 1985; Tamura, 1988; Migdalis et al., 1991; Alzaid et al., 1993; Altobelli et al., 1998; Rajput et al., 2001). Two of these reported that disease duration correlated significantly with pancreas area in individuals with T1DM (Altobelli et al., 1998; Rajput et al., 2001), and one study reported such a correlation in individuals with T2DM (Tamura, 1988).
Pancreas Length
Only one study investigated pancreas length in conjunction with pancreas diameter (Mohan et al., 1985) (Table 3). The total pancreas lengths in individuals with DEP, MODY, T1DM, and controls were reported. Individuals with both MODY and T1DM had lower total pancreas lengths than controls, but only individuals with DEP had reductions that reached statistical significance.
DISCUSSION
This study has systematically reviewed the current literature on pancreas size as assessed by pancreas diameters, areas, and lengths. Its strengths include a robust search strategy, the systematic documentation of anatomical landmarks, and the amalgamation of quantitative data regarding alterations in pancreas size across a range of diseases.
The anatomical landmarks used for pancreas size measurements have been systematically documented. These landmarks were used either to demarcate the pancreas into three regions or to act as reference points for diameter measurements. There was consistency among studies that used anatomical landmarks to demarcate regions of the pancreas, where the confluence of the superior mesenteric and splenic veins served to divide the head (to its right) and the body (to its left), and the tail was defined as the region immediately anterior to the left kidney. In contrast, there was significant heterogeneity among studies using landmarks as reference points for diameter measurements. The confluence of the superior mesenteric and splenic veins, the superior mesenteric artery, and the medial border of the left kidney served most commonly as the landmarks of reference for diameter measurements across the head, body, and tail, respectively. The potential benefit of using anatomical landmarks is that they provide an easy stepping stone for standardizing future investigations into regional alterations in pancreas size. However, this benefit will only be achieved when two major drawbacks of the current field are overcome.
The first drawback is the significant variability associated with measurements of pancreas size, which could be influenced by patient, technical, and rater-related factors. To measure pancreas size, the pancreas and its anatomical landmarks must be visualized in the same plane. Visualization can be impaired by patient factors including the presence of bowel gas, ascitic fluid, peri-pancreatic masses, and minimal visceral fat. Furthermore, the overall position of the pancreas and the direction of its regions (in particular, the tail) relative to the position of anatomical landmarks can differ among individuals. For example, individuals with a tail that moves in a postero-superior direction relative to the body are more likely to have fewer common axial slices with the left kidney than individuals with a tail that moves in a postero-inferior course relative to the body. Technical factors specific to US (transducer frequency, the use of water in the stomach as an acoustic window, or the application of Doppler imaging) and cross-sectional imaging in CT/MR (such as the plane of sectioning, the administration of contrast, and the pulse sequences used for MR) can also affect visualization. Rater-related factors such as knowledge and experience of abdominal anatomy in the context of the specific imaging method could also contribute to variability.
Compounding the drawback of significant variability are the issues of poor inter-rater and intra-rater reliability attributable to the nature of the measurements themselves. Unidimensional measurements such as pancreas diameter and length are likely to be more variable than pancreas area measurements, since the angle of the measurement can significantly affect the value obtained. This is important as pancreas diameters have been measured either strictly along the anteroposterior (AP) or craniocaudal (CC) axes, or in relation to the organ midline (either perpendicular or parallel to it). While perpendicular measurements have the benefit of accounting for the course of the organ, the freedom in the angle of the measurement can lead to poor inter-rater reliability. This contrasts with AP or CC diameters, where the angle of measurement is set at 90 degrees. The use of anatomical landmarks to define measurements is also significant as inter-rater reliability can differ between diameters based on reference anatomical landmarks and measurements of the greatest diameter in the region. The initiation points and axes deemed most appropriate by the raters to obtain the ‘greatest’ diameter could be more variable. The problem of selection of the initial point is further complicated in lobulated pancreata with variant courses. To date, only one study has compared inter-rater reliability between greatest diameters and diameters based on anatomical landmarks, but those measurements were limited to the head only (Cuntz et al., 2000). Future studies investigating inter-rater reliability in diameter measurements across all regions of the pancreas are required.
The second drawback is the lack of critical appraisal of published anatomical landmarks. The authors of primary studies did not justify their choice of particular anatomical landmarks rather than previously published landmarks. To date, no one has conducted a structured objective assessment of the different anatomical landmarks reported in the literature. The findings of such a study would provide a sound basis for guidelines recommending anatomical landmarks for future studies. In the interim, however, the following considerations could help in determining anatomical landmarks for diameter measurements (Table 4).
| Region | Landmarks identified in the present review | Recommended |
|---|---|---|
| Head | Confluence of the superior mesenteric and splenic veins | Yes |
| Hepatic portal vein | No | |
| Inferior vena cava | No | |
| Superior mesenteric vessels | No | |
| Body | Left border of a lumbar vertebral body | Yes |
| Superior mesenteric artery | No | |
| Tail | Internal border of the left kidney | Yes |
| Left border of a lumbar vertebral body | No |
The inferior vena cava, the confluence of the superior mesenteric and splenic veins, the superior mesenteric vessels, and the hepatic portal vein have been used as references for diameter measurements of the head. Despite the difficulty in visualizing the venous confluence (as compared to the other landmarks), this landmark yields a diameter that is more centered within the head than the alternatives. Thus, a greater proportion of the head's mass is likely to be covered. The midline of the superior mesenteric artery and the left lateral border of the lumbar vertebrae have been used as references for measurements of the body diameter. Given that the pancreas body is superior to the origin of the superior mesenteric artery, it is unlikely that the two structures will be visible together in an axial view, so it might not be a reliable landmark for cross-sectional imaging. In contrast, the left lateral border of a lumbar vertebral body would be a more reliable landmark for the body given that lumbar vertebrae span the posterior wall of the abdomen. The internal border of the left kidney and the left lateral border of the lumbar vertebrae have been used as references for diameter measurements of the tail. A perpendicular diameter across the tail in line with the internal border of the left kidney would cross a region that would certainly be considered as tail. However, using the left lateral border of a lumbar vertebral body, one could argue that the region covered is body rather than tail. Therefore, a more reliable anatomical landmark for the tail would be the internal border of the left kidney.
This study has also amalgamated quantitative data regarding alterations in pancreas size across a range of diseases. Pancreas size differed significantly between diseased individuals and controls. Insulin-dependent individuals with diabetes mellitus (those with T1DM and those with T2DM requiring exogenous insulin therapy) had a significantly smaller pancreas than controls, the extent of reduction being greater in individuals with T1DM than those with T2DM requiring exogenous insulin. Further, there were regional differences in the extent of parenchymal atrophy with regard to disease duration in both T1DM and T2DM. Overall, it appears that the tail is the first to atrophy and the head is the last. These findings can be explained by the ‘insulino-acinar hypothesis,’ which proposes that the growth and repair of the gland's exocrine tissue depends on local concentrations of insulin (a potent trophic hormone). Therefore, a reduction in β-cell insulin secretion and/or altered local insulin receptor activity would lead to parenchymal atrophy (Foulis and Stewart, 1984; Gilbeau et al., 1992). This could also explain the commonly-reported positive correlation between C-peptide and pancreas size. Further, islet density is reportedly greater in the body and tail (Rahier et al., 1983; Wang et al., 2013). Therefore, insulitis could have more profound effects on these regions in T1DM, resulting in greater atrophy. Future autopsy studies employing modern immunohistochemistry and imaging are required to test this prediction, as previous smaller autopsy studies have given inconsistent results.
In T1DM, parenchymal atrophy can be explained by stark insulinopenia secondary to autoimmune-based insulitis, a phenomenon evidenced biochemically by auto-antibodies against β-cells and insulin (Taplin and Barker, 2008) and by postmortem findings of lymphocyte infiltration of the islets (Foulis and Stewart, 1984). The intermediate pancreas size in T2DM is difficult to explain given the heterogeneous etiology of this condition, which involves components of fatty infiltration (Singh et al., 2017a, 2017b) and peripheral insulin resistance. Further, its pathophysiology in terms of alterations in pancreas size could depend on the time course of the disease, as evidenced by a negative correlation between total pancreas volume and disease duration (DeSouza et al., 2018). While prospective studies are required to prove this, the earlier stages of T2DM could be characterized by increases in pancreas size due to a combination of fatty infiltration and hyperinsulinemia secondary to peripheral insulin resistance. However, as the disease progresses and glycemic control worsens, parenchymal atrophy could ensue as a result of growing insulinopenia from β-cell dysfunction and subsequent failure. Therefore, the differences in findings among studies could in part be attributed to cohorts heterogeneous in terms of disease duration.
In most studies investigating acute pancreatitis, pancreas size was significantly greater than in normal individuals. Pancreas enlargement, both focal and diffuse, was the most common finding in this condition. This could be explained by interstitial edema due to extravasation as part of the inflammatory response to autodigestion of the gland (Wang et al., 2009). Focal enlargement of the pancreas head was commonly reported. Perhaps this could be due to regional differences in the extent of pancreas enlargement among different disease etiologies. For example, individuals with biliary acute pancreatitis could have a higher rate of and/or a greater extent of head enlargement owing to more extensive inflammation of tissues immediately surrounding the mechanical obstruction of intrapancreatic biliary structures such as the distal common bile duct and the hepatopancreatic ampulla. However, this regional difference in pancreas enlargement could have a time course and could diminish after decompression through natural breakdown, endoscopic retrieval, or surgical removal of the causative gallstone. In contrast, alcohol-induced acute pancreatitis can be characterized by diffuse enlargement of the gland associated with widespread inflammation in response to the systemic toxin being carried throughout the gland via its extensive vascular network. However, none of the studies reported pancreas size in relation to the etiology of acute pancreatitis. Future studies that stratify their acute pancreatitis cohorts by etiology are warranted to investigate this hypothesis.
The two studies of pancreas size in chronic pancreatitis were inconsistent: one reported that it was reduced (Bilgin et al., 2009) and the other that it was increased (Treiber et al., 2016). This discrepancy could partly be explained by differences in the disease durations of the study populations; only one of these studies reported the mean disease duration of their chronic pancreatitis cohort (Treiber et al., 2016). This is relevant as pancreas size could change through the time course of the disease. The pancreas could be enlarged by mechanisms similar to those in acute pancreatitis during acute exacerbations of early chronic pancreatitis. However, as the disease progresses with atrophy and fibrous replacement of parenchymal tissue, the pancreas could begin to shrink. These findings would be consistent with the pathogenesis of chronic pancreatitis, which involves feed-forward activation of pancreatic stellate cells by TGF-β released by activated macrophages, leading to the deposition of collagen and extracellular matrix proteins to replace parenchyma destroyed by auto-digestion (Lew et al., 2017). The ‘insulino-acinar hypothesis’ could also explain parenchymal atrophy in conjunction with the processes described above, as β-cell dysfunction secondary to chronic inflammation and ectopic fat accumulation could lead to subclinical insulinopenia in early CP resulting in atrophy of the exocrine tissue (Schrader et al., 2009). The diagnosis of early chronic pancreatitis is challenging, and quantification of parenchymal atrophy during periods of senescence via pancreas diameters, areas, and lengths in early CP could offer a new avenue for early diagnosis since traditional radiological findings (such as parenchymal and intraductal calcification, dilatation of the main pancreatic duct and side branches, and contour lobulation) are typically found only in late disease (Sarner and Cotton, 1984).
The main limitation of this review is that these quantitative measures of pancreas size were not amenable to meta-analysis. This is because of the marked methodological heterogeneity in the primary studies. There is now a need to establish guidelines based on modern imaging studies to allow anatomical landmarks to be standardized for future studies. Once this has been achieved, meta-analyses can be conducted. There is also a need for more population-based studies to re-define norms for pancreas size as stratified by age, BMI, ethnicity, and sex on the basis of established guidelines using modern imaging. While several studies using US and CT have reported pancreas size exclusively in normal individuals (Weill et al., 1977; de Graaff et al., 1978; Heuck et al., 1987; Ueda, 1989; Capaccioli and Carpi, 1993; Giandomenico et al., 1993; Nyren et al., 1996; Chen et al., 1997; Djuric-Stefanovic et al., 2012), most of such studies did not use modern imaging methods, which have significantly improved resolution.
In conclusion, the importance of quantifying pancreas size via noninvasive imaging is being increasingly recognized in the context of early diagnosis and management of diseases of the endocrine and exocrine pancreas. This systematic review has documented the methodologies of studies investigating pancreas size using diameters, areas, and lengths, and in particular it has documented the various anatomical landmarks used. Further, quantitative data regarding alterations in pancreas size across several diseases have been amalgamated in a manner easily understandable by clinicians. Pancreas diameters and areas were reduced in individuals with diabetes mellitus (more markedly in T1DM than T2DM) and pancreas diameters were increased in individuals with diseases of the exocrine pancreas (with the exception of chronic pancreatitis). Future prospective studies based on modern imaging and standardized protocols are now warranted to re-define norms of pancreas size, and to elucidate the effects of differences in disease duration and etiology on the endocrine and exocrine pancreas.
DECLARATION OF CONFLICT OF INTEREST
The authors declare no conflicts of interest.