Quantifying the rare: Baselines for the endangered Napoleon Wrasse, Cheilinus undulatus, and implications for conservation
Abstract
- The Napoleon wrasse, an endangered fish (Convention on International Trade in Endangered Species of Wild Fauna and Flora (CITES) Appendix II, 2004), is a valuable component of the Chinese live reef fish trade. Only Indonesia legally exports up to 2000 Napoleon fish annually, with each fish weighing between 1 and 3 kg.
- Information on natural abundance and fish sizes was required to determine sustainable export quotas. Hence, an underwater visual survey method, using GPS-based multi-kilometre transects, was tailored for this uncommon wide-ranging fish. Transects totalling 430 km were run between 2005 and 2016 at nine locations. Six locations were resurveyed between six and nine years later, which was long enough to allow for recruitment and maturation.
- Fish density and sizes across locations were inversely related to fishing intensity, and densities increased significantly between surveys. Low density (0.04-0.86 fish hectare-1) and few adult-sized fish were in heavily fished locations. Higher densities occurred (0.86-4.0 fish hectare-1) in lightly/unfished locations, where evidence of recruitment was also seen. Nowhere were many male-sized (>1 m long) fish present. At Karas Is., where fishing ceased between surveys, clear sign of recovery was seen after 9 years.
- Comparison of survey data from 11 Indo-Pacific countries indicated that in Indonesia adult densities were lower at comparable levels of fishing pressure than elsewhere. Densities of 5 fish hectare−1 or more are more typical of lightly fished or unfished areas across the Pacific, which is greater than the highest density of 4 fish hectare−1 noted in this study at Banda Islands. Low densities of the species, despite the presence of adult-sized fish, in Bunaken Marine Park probably reflects the continuance of fishing both within and adjacent to the park.
- Conservation options include improved implementation of CITES regulations by Indonesia, through tighter export controls and the tagging of legally exported fish, the activation of the National Plan of Action, a temporary moratorium to restore reproductive capacity, and more marine protected areas.
1 INTRODUCTION
The live reef fish trade (LRFT) is a highly lucrative international trade focused on Southeast Asia. It mainly involves fishes taken from the Coral Triangle region shipped to China as part of the luxury seafood market serving Chinese cuisine, with Hong Kong representing a major consumer and key trading hub. Starting in the 1980s the LRFT has now grown to at least 20 000 mt annually, with an estimated retail value exceeding US$1 billion (Sadovy de Mitcheson et al., 2017). The trade focuses on a limited suite of reef fishes, especially larger groupers of the genera Epinephelus and Plectropomus. Some of the traded species are particularly susceptible to overfishing and are threatened by the trade. These fisheries are largely unmanaged and the trade is poorly controlled, with much of it unmonitored, unreported, and with some of it being illegal (Sadovy et al., 2003; Wu & Sadovy de Mitcheson, 2016).
Several other fishes are important in this trade, most notably Cheilinus undulatus, the humphead wrasse or Napoleon fish. Although its global trade is estimated at less than a few hundred tonnes annually, its retail value is very high and the species is considered to be one of the most valuable in the LRFT (Sadovy et al., 2003). Retail prices are US$300–500 kg−1 in Hong Kong and may reach US$600 kg−1 in luxury hotels in Beijing (Sadovy de Mitcheson et al., 2017). Napoleon fish are all wild-caught as the species does not undergo full-cycle aquaculture (i.e. hatchery production) at commercial levels. Most Napoleon fish are caught while still juveniles, including as post-larvae, and then grown to market size in floating net cages over months to several years. In terms of preferred marketable sizes, the high demand for ‘plate-size’ individuals (500–1000 g, 25–45 cm in total length, TL), to serve families or for banquets, means that most Napoleon fish are also marketed prior to or soon after sexual maturation (35–45 cm TL; Kindsvater, Reynolds, Sadovy de Mitcheson, & Mangel, 2017), with this size range being the most valuable per unit weight. Fresh or chilled Napoleon fish are also occasionally sold, but prices are much lower than for live animals.
Napoleon fish occur from East Africa and the Red Sea across the Indian and west Pacific Oceans to French Polynesia, and from southern Japan in the north to New Caledonia in the south. Although recorded from 48 countries, the species is naturally uncommon. Many of these countries protect Napoleon fish from either capture or export (or both), a situation unusual for a reef fish (Sadovy et al., 2003), and the species is considered to be conservation dependent (Gillett, 2010). Other than live Napoleon fish caught for export, there are few fisheries that specifically target this species, although in some countries the species is, or once was, highly regarded for cultural or traditional reasons (Sadovy et al., 2003). The Napoleon fish is often speared but is difficult to capture alive. Consequently, live Napoleon fish are variously targeted by special trap (Solomon Islands) or by hook and line. In a common practice from parts of Indonesia and the Philippines, however, the species is most efficiently taken alive by divers using cyanide solution that stuns live fish, but the fish will survive if removed rapidly from the contaminated water (Sadovy et al., 2003).
The Napoleon fish is one of the largest of all coral reef fishes, with reported lengths and weights approaching 2 m TL and 200 kg, respectively, and is one of the iconic reef fishes that tourist divers most want to see (Sadovy et al., 2003). Today, as a result of declines in many areas, it is rarely recorded longer than about 1.5 m, and individuals of over 1 m are seldom seen except where the species is protected or not fished. The species is protogynous. Females become sexually mature at 4–6 years and about 35–45 cm TL (Choat, Davis, Ackerman, & Mapstone, 2006; Sadovy de Mitcheson, Liu, & Suharti, 2010), but do not exceed ~80–100 cm TL. Males do exceed 1 m TL, typically developing from females at about 8–9 years of age and around 80 cm TL. Both males and females can live longer than 30 years (Choat et al., 2006; Sadovy de Mitcheson et al., 2010). Adult Napoleon fish are most often encountered on steep outer reef slopes, reef drop-offs, channel slopes, and reef passes to a depth of at least 100 m (e.g. Allen & Swainston, 1992; Myers, 1999; Randall, Head, & Sanders, 1978; Sluka, 2000). Spawning occurs at specific sites, to which adults travel on a regular (daily) basis solely for mating (Colin, 2010). A given stretch of reef can have several such sites where a few to over 100 Napoleon fish can gather to spawn (Colin, 2010). Juveniles may be found in mangrove–algal areas, seagrass beds, and shallow coral habitat (Dorenbosch, Grol, Nagelkerken, & van der Velde, 2006; Tupper, 2007).
In 2004, as a result of declines from over-exploitation for the LRFT, the Napoleon fish was listed on Appendix II of the Convention on International Trade in Endangered Species of Flora and Fauna (CITES), the first coral reef food fish so listed, and was categorized as endangered on the International Union for Conservation of Nature (IUCN) Red List. CITES Appendix II mandates that exports of CITES-II listed species are not detrimental to the status of their wild populations. To fulfil this requirement, exporting countries must develop a ‘non-detriment finding’ (NDF) and any exports require permits that are also subject to verification by importing countries.
Indonesia (where the fish is referred to as Ikan Napoleon) is the major exporter of Napoleon fish, both legally (the annual CITES export quota is 2000 fish) and via illegal trade; illegal exports also occur from the Philippines and Malaysia (Sadovy de Mitcheson et al., 2017; Wu & Sadovy de Mitcheson, 2016). Although Hong Kong is the major importer and accounts for some consumption of the species, extensive, largely illegal, trans-shipments are made to mainland China, the major consumer, through long-established seafood trade networks (Wu & Sadovy de Mitcheson, 2016). This cross-border seafood trade is in part to avoid mainland import tariffs (about 17%) for luxury seafood. The illegal trade in Napoleon fish resulted in CITES Decisions at CITES conferences 15, 16, and 17 (https://www.cites.org/eng/dec/valid17/81871), calling for trading countries to find effective measures to address illegal trade.
Indonesia implemented the CITES listing in 2006 and developed an NDF for an export quota under CITES. To do so, the IUCN Groupers & Wrasses Specialist Group, the United Nations Food and Agriculture Organization, and the Oceanography unit of the Indonesian government (Lembaga Ilmu Pengetahuan Indonesia, or LIPI) worked together to develop a fishery management model specifically tailored to this species and its export trade (Oddone et al., 2010; Sadovy, Punt, Cheung, Vasconcellos, & Suharti, 2007).
To facilitate the development of the fishery management model and to enable the continuing assessment of the status of wild Napoleon fish, an underwater visual census survey method was developed to monitor the population abundance of Napoleon fish in the field. Because standard length (usually 25–150 m) line transects are impractical for assessing the abundance of this wide-ranging and uncommon species, the transect approach was modified to allow longer distances to be readily surveyed. Baseline surveys were conducted at nine locations and repeated 6–9 years later at six of the original nine locations. Hence, the objectives of the present study were to: (a) develop a practical method tailored for surveying Napoleon fish sizes and densities in the field; (b) survey Napoleon fish in locations across Indonesia subjected to low, medium, and high fishing pressure to establish baseline data within a year of Indonesia implementing CITES Appendix II (2006); (c) resurvey selected locations after a time interval appropriate to the life history of the Napoleon fish, 6–9 years later, to identify possible changes in sizes and densities over time after the CITES listing; and (d) based on the outcomes provide recommendations for the management and conservation of the species in Indonesia.
2 METHODS
2.1 Study locations and inter-survey intervals
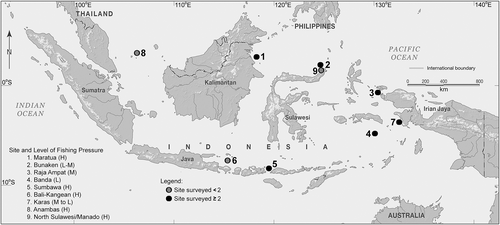
Nine locations were selected for baseline surveys, with six of these (two each with high, medium, and low fishing intensity) later resurveyed (Figure 1). As the study focus was on adults, adult habitat along reef slope transects was selected for underwater surveys; however, fish of all sizes were counted when encountered. Animals living at depths inaccessible to scuba or snorkel observers periodically ascend to reef-edge habitats to reproduce, as reproduction is only known to occur in shallow water near the surface, directly above the reef shelf break (Colin, 2010). Surveys were typically conducted along the edges of reef slopes or along a given depth contour at the margin of the outer reef slopes (Figures S1–S8). As Napoleon fish require 4–6 years to reach sexual maturity, baseline surveys were repeated 6–9 years later (Table 1), giving sufficient time for a new generation of fish to appear.
| Location (relevant figure) | Survey location notes (see note below) | Fishing intensity at initial survey, from 1 (low) to 5 (high) (see Figure 14) | Initial trip | Subsequent survey |
|---|---|---|---|---|
| Sumbawa/Flores (Nusa TenggaraTimur; central Indonesia; Figure 7) | Exploitation started early to mid-1990s and has been intensively exploited since then | High (5) | 6–11/04/2006 | 3–7/05/2014 |
| Maratua (central Indonesia; Figure 3) | Started to be exploited in the 1980s and intensively exploited since then | High (5) | 22–27/09/2006 | 23–36/09/2013 |
| Raja Ampat (western Indonesia; Figure 5) | Medium – exploitation started early to mid-1990s by a small number of traders; this persists | Medium (3) | 18–25/11/2005 | 7–10/03/2012 |
| Karas Islands (western Indonesia; Figure 8) | Medium (2007) to low (2016). The change in fishing intensity followed the cessation of fishing for Napoleon fish after 2007 after the sole trader in Napoleon fish stopped catching this species entirely in Indonesia. Exploitation in the area for live fish started early to mid-1990s | Medium (3) – as a result of the cessation of fishing after the first survey. Fishing intensity would be Medium-Low (M-L) or (2) by the second survey | 8–22/11/2007 | 3–5/04/2016 |
| Banda Islands (central Indonesia; Figure 6) | Not known to have active live trade, probably because of the remoteness and the small reef area. For many years there has been a local focus on conservation. Local population eats pelagic rather than reef fish | Low (1) | 3–8/10/2006 | 31/10/2012–3/11/2012 |
| Bunaken Marine Park (central Indonesia; Figures 2 and 4) | Marine park established in 1991 (van Beukering et al., 2007). Live fish exploitation started in the 1980s. The park consists of five islands, with only one, Bunaken Island, being effectively protected with a warden and frequent tourist diver presence. Shortly after the initial survey, in 2006, 207 (5–30 cm TL) confiscated juvenile Napoleon fish were released into the park (WWF, 2006) | Low initially (1), through protected status; however, continuing fishing means that the level is more realistically Low to Medium (L-M) (2) | 16–25/07/2005 | 12–5/10/2012 |
| Bali–Kangean (Figure 9) | Area has been fished for small Napoleon fish, for rearing to commercial size, for decades | High (5) | 21–28/06/2005 | No data |
| Northern Sulawesi/Manado (Figure 4) | Intensive exploitation of Napoleon fish started in the 1980s. Area is adjacent to Bunaken National Marine Park. Illegal fishing occurs (e.g. WWF, 2006) | High (5) | 16–25/07/2005 | No data |
| Anambas Islands (Figure 10) | Trade in Napoleon fish started before 1980. Area reported to have many large fish in early years, but none have been recorded in recent surveys | High (5) | 10–14/05/2013 | No data |
- Note that the exploitation information in column 2 included is based on the PhD thesis research of Miftah Chazanah, Indonesia.
The locations selected for surveys (Figures 1-10; Table 1) and designation of the level of fishing intensity were established based on discussions with Indonesian government scientists and fisheries staff with a knowledge of fishing activities for Napoleon fish in the country and from information from traders. One of three levels of fishing intensity (low or none, medium, or high) for Napoleon fish were assigned to each location using qualitative criteria. For example, protected locations were considered to be low or no fishing pressure, whereas at the other extreme areas long subjected to intense fishing for the species were considered to be locations of high fishing intensity. Less intensively targeted locations (i.e. fished for a shorter time and/or the focus of fewer traders or fishers) were considered medium intensity fishing areas. Quantitative data on catch rates and fishing intensity are not available for any location in Indonesia, and hence selections were made based on consensus and expert local knowledge.

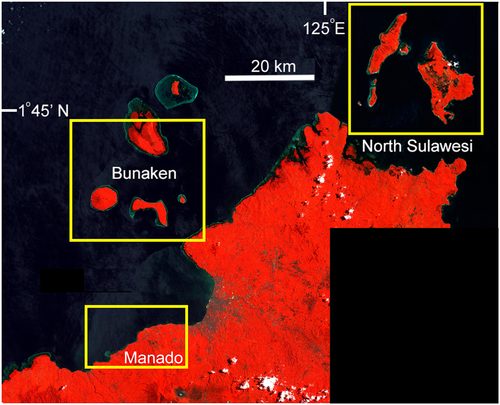
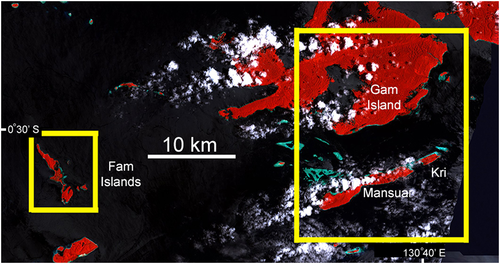
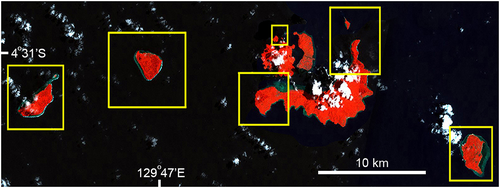
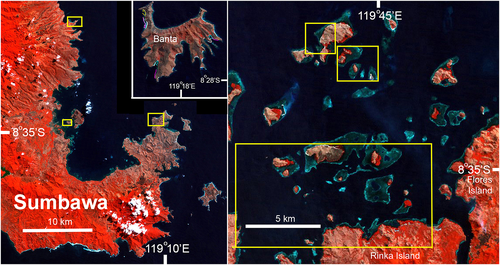
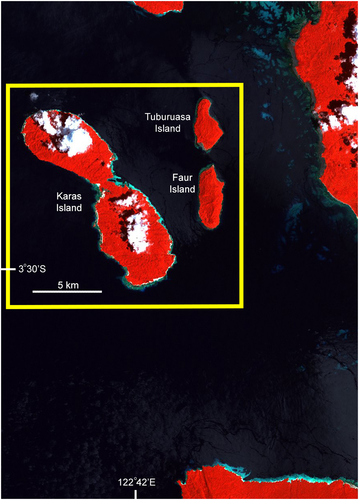
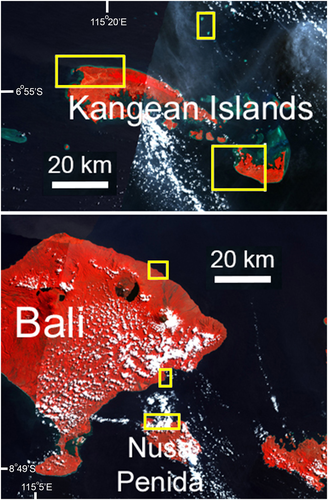
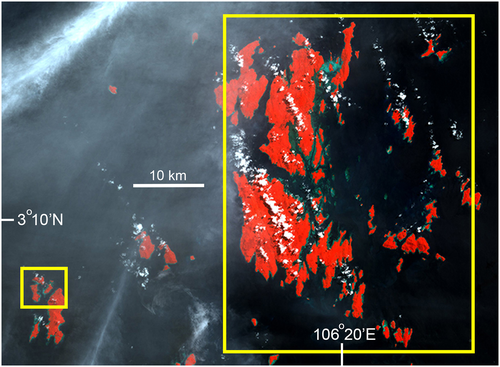
Designations of high, medium, and low fishing intensity for Napoleon fish were assigned to all nine locations, all of which had suitable habitat for adult and juvenile Napoleon fish. For the three locations surveyed only once (Bali–Kangean, Anambas, and North Sulawesi/Manado; Figures 4, 9, and 10), all have a long history of intensive exploitation for Napoleon fish. Two locations could not be resurveyed as a result of safety and logistical concerns, and the third (Anambas) was surveyed only recently and sufficient time has not yet elapsed for a resurvey.
Of the six locations surveyed twice, locations selected for high fishing pressure were Maratua (East Kalimantan) and Sumbawa (Nusa Tunggara), both in central Indonesia (Figures 3 and 7). Both locations have a long history, since the 1980s and mid-1990s, respectively, of being targeted by many fishers and multiple traders for Napoleon fish for the LRFT, with activity continuing between surveys. This conclusion was based on local on-site reports, communications with officials, and direct observations of fishing activity during surveys. Few other larger fishes, such as grouper or snappers, were observed during surveys and coral habitat was often found to be damaged from destructive fishing: both signs being indicative of intensive fishing in general at these locations. Both locations had a narrow outer shelf platform with adjacent shallow coral areas suitable as habitat for both adult and juvenile Napoleon fish.
Locations designated as medium fishing intensity were Raja Ampat and Karas, and surrounding islands, both in eastern Indonesia off West Papua (Figures 5 and 8). Raja Ampat has a long, and continuing, history (since the mid-1990s) of exploitation by one or two companies exporting live fish, including Napoleon fish. These companies operate over a large geographic area and the overall fishing intensity is not considered to be high in this region of low human population density. Karas Island only had a small number of live fish traders buying fish from the few villages present, starting in the late 1990s, and only one trader at the time of our initial survey. After the initial survey (2007), this single major live reef fish trader ceased to target and export Napoleon fish entirely because he became aware of the low numbers of Napoleon fish in the area as a result of joining our underwater surveys (previously he had only seen multiple Napoleon fish consolidated in cages, and had no idea how much fishing was needed to catch the fish); he subsequently also started to introduce sustainability measures in all of his 55 live fish consolidation areas across the country. Hence, by the time of the last survey (2016) the area had evidently not been fished for Napoleon fish for 9 years, providing an opportunity to examine data for possible recovery of the species. Both locations have large areas of suitable habitat for adult and juvenile Napoleon fish with low human populations. Fishing continued at Raja Ampat between surveys.
Survey locations designated as low fishing intensity were challenging to identify in Indonesia, as few areas exist where fishing pressure is low or absent. The Banda Islands in eastern Indonesia and Bunaken National Marine Park in north central Indonesia were considered the best two candidates (Figures 4 and 6). Neither location is fully protected from fishing; however, the Banda Islands gain protection from the LRFT through the remoteness and small size of the reef area, with no confirmation of targeting Napoleon fish. Moreover, the local population prefers pelagic over reef fish to eat. Although Bunaken Island is well known as a Marine Protected Area (MPA) with heavy dive tourism, the Bunaken National Marine Park, established in 1991, consists of five islands, 22 villages, and 30 000 people, and has problems with poor enforcement and destructive fishing (van Beukering, Scherl, Sultanian, Leisher, & Fry, 2007). Several other islands in the marine park and adjacent areas outside the park have a long history (since the 1980s) of the LRFT, including the take of Napoleon fish. Of the several islands in the marine park surveyed, only one, Bunaken Island, is likely to be effectively protected. Both locations have large areas of suitable habitat for adult and juvenile Napoleon fish.
2.2 Gathering field survey data
The surveys of Napoleon fish abundance were conducted using a method consisting of long underwater transects, measured using a Global Positioning System (GPS) to quantify their abundance and sizes, and to allow future reassessments of the same areas. Most underwater visual census (UVC) fish transects use survey distances of 25–150 m. With the apparent rarity of Napoleon fish (there can be fewer than 1 fish km−1 of transect survey), these lengths were deemed inappropriate (e.g. Irigoyen et al., 2018). Instead, the sampling strategy involved long snorkelling transects (several kilometres in length) along specific features of adult habitat, such as the reef shelf edge, that are identifiable in satellite or aerial images and easy to follow (Oddone et al., 2010). One positive characteristic for observers of Napoleon fish was that if the fish is present it is readily visible: larger juveniles and adults spend much of their time in the open, where they are easy to detect against the reef. This new survey method was an adaptation of a GPS-based density survey method (Colin, Donaldson, & Martin, 2005; IUCN–GWSG, 2006). Transects surveyed were quantified by floating position-logging GPS receivers carried by observers. The time that each fish was observed and its estimated length was recorded, and its exact location later determined from the time-relative position data. Reef condition was noted regarding habitat suitable to the Napoleon fish, damage from explosives, etc.
At each of the nine selected survey locations, multiple reef transects were conducted at different sites. These transects were initially chosen randomly across multiple sites, each with suitable habitat, across each location according to prevailing conditions and with safety considerations (for details of the transect sites for each location, see Figures S1–S8). Each transect had a minimum target length of 1 km, a distance that can be covered in 40–60 min swimming at 15–20 m min−1 (a steady pace). If conditions were suitable (currents and sea state), observers continued snorkelling along the reef feature for more than 1 km. The start location and type of habitat for each transect was usually chosen with consideration of the surveyor's ability to follow the feature selected (e.g. reef drop off); low visibility, however, might preclude this. In practice, shelf-edge features are usually easily followed underwater as the reef slopes away either gently or quickly to depth. Snorkelling along this break allowed observers to see 15–20 m down the slope into the depths as well as up to 10 m onto the shallow shelf. The shelf break was typically at a depth of about 10–15 m.
For the six locations resurveyed, observers followed as closely as possible the exact transects from the initial surveys. Sometimes this was not possible because of logistical or time constraints, or because of weather conditions; however, the initial survey tracks were used as a reference and, if not followed exactly, surveys in the same habitat type were completed nearby.
Generally, a small (safety) boat accompanied the surveyor(s), staying a short distance (30–50 m) away to avoid disturbing fish, but also quickly available in the event of the observer(s) having to exit the water suddenly, when switches in current direction required moving to another site or when an expanse of unsuitable habitat (such as sand flats or flattened coral rubble) was encountered. Typically, observers swam in pairs within visual range of each other and at a set distance apart, with counts classified as either from drop-off areas (‘outer’ surveyor) or from adjacent reef platform areas (‘inner’ surveyor). Observers working in pairs had a system to avoid double-counting a Napoleon fish that occurred between them. Observers working alone followed the outer drop-off area, which accounted for the great majority of transect distances where the majority of fish were seen.
This ‘GPS-distance method’ involved a GPS placed in a floating waterproof housing that was towed on the water surface by an observer (snorkelling or diving). The GPS recorded the observer's position every 30 seconds, an interval during which the observer usually moved 5–10 m. The observer wore a waterproof watch synchronized to the nearest second with the time displayed by the GPS receiver. Data were recorded on an underwater slate with the start and end times of the survey recorded. The surveyor swam along the chosen track looking for fish within a predetermined distance to either side. This left + right distance is the ‘swath’ width and can be up to 10 m either side of swim track (i.e. 20 m swath) in clear water. Lowered visibility reduced the swath width used, with a minimum of 4 m swath accepted. Initial training for swath distance determination was usually conducted underwater with a tape measure for reference.
When a target fish was sighted, the time and TL were recorded. The TL was estimated according to experience with objects of known size and/or with reference to a length scale in centimetres on the side of the recording slate. Such length estimates are thought to be accurate to within about 10–15% for an experienced observer (McCormick & Choat, 1987). For Napoleon fish, lengths were assigned in 5-cm increments for those from 10 to 60 cm, and for those (few) fish longer than 60 cm in 10-cm increments.
2.3 Limitations with the survey method
While most surveys were performed by experienced observers, various strategies were used to minimize likely sources of error, such as not seeing (i.e. missing) fish, double counting, species misidentification, and inter-observer differences. All surveys focused only on Napoleon fish to avoid distractions as the species can be wary (remaining far from observers, but not hiding) in areas where it is fished, and so needs focused searching. Counts were not conducted during early morning or late afternoon because lower light conditions made the fish harder to detect. Double counting was reduced by careful tracking of each fish once seen; this was not problematic because of the low numbers of fish present and their predictable behaviours. Some other labrids, particularly, Cheilinus chlorurus and Cheilinus trilobatus, can resemble small Napoleon fish and observers were trained to distinguish Napoleon fish with confidence. Inter-observer variation was checked by periodically having two surveyors swimming side by side and comparing counts; in such cases the counts matched closely, giving high confidence in the counts. Also, for many of the surveys the same observers participated and at least one of the authors was present during all surveys.
2.4 Processing field data and determining appropriate survey distances
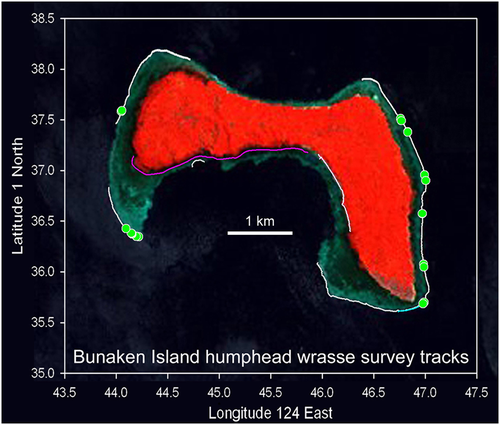
Track data were downloaded at the end of each field day using Garmin mapsource™ software (or other similar for other GPSs), producing a data spreadsheet of latitude, longitude, and time. Based on the start and end times of each transect, the data were edited to remove data for times when surveys were not being made. Thus, for each transect there was a continuous latitude/longitude track of the survey swim with times and, within the accuracy limits of the GPS, a permanent record of the line/area surveyed to allow for replication. The location on the track where any fish was observed can be closely (within a few metres) determined by the position data and time of observation. The track data provide the distance (and area depending on swath width) surveyed, and the number of fishes observed provides an abundance value (fish km−1 or per unit area). The survey track and positions of individual fish were graphically represented on habitat maps, satellite images, or other backgrounds (actual fish locations are not published in unprotected locations to avoid possible fishing risks). An example of transect plots and fish locations is shown on a satellite image of Bunaken Island, the best protected island within Bunaken National Marine Park, for illustration (Figure 2).
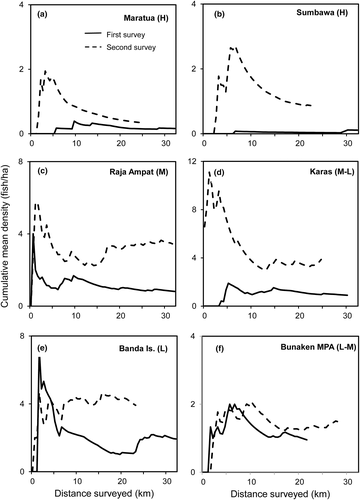
It was important to ensure that sufficient survey distances are covered to adequately quantify abundance: for wide-ranging fish such distances can sometimes be substantial. The mean cumulative density (fish hectare−1) over distance surveyed was allowed to stabilize to ensure a representative and sufficiently long distance had been sampled. As survey distance increased a running value for the overall cumulative mean density of fish on all transects completed was plotted. After an initial highly variable value of cumulative density, the overall density stabilized as the total survey distance increased, to between about 10 and 20 km, eventually arriving at a value that represents the typical density of fish in each survey location and time period. In most locations, surveys were continued for distances considerably beyond those where density values stabilized, adding confidence to the overall values obtained (Table 2).
| Location | Year | Distance, km | Napoleon fish | Mean total length, cm (SD) | Number of fish per km (distance) | Number of fish per hectare (area) |
|---|---|---|---|---|---|---|
| Sumbawa 1 | 2006 | 40.49 | 11 | 11.82 (4.62) | 0.27 | 0.16 |
| Sumbawa 2 | 2014 | 22.98 | 13 | 23.85 (13.87) | 0.57 | 0.86 |
| Maratua 1 | 2006 | 48.50 | 10 | 25.00 (8.50) | 0.21 | 0.22 |
| Maratua 2 | 2013 | 23.97 | 8 | 36.25 (6.94) | 0.33 | 0.34 |
| Raja Ampat 1 | 2005 | 30.33 | 52 | 41.83 (10.98) | 1.71 | 0.86 |
| Raja Ampat 2 | 2012 | 31.50 | 62 | 20.48 (5.78) | 1.97 | 3.44 |
| Karas 1 | 2007 | 30.00 | 19 | 44.74 (19.54) | 0.63 | 0.90 |
| Karas 2 | 2016 | 25.25 | 62 | 45.48 (12.50) | 2.46 | 3.82 |
| Banda Islands 1 | 2006 | 42.17 | 58 | 67.67 (25.65) | 1.38 | 1.78 |
| Banda Islands 2 | 2012 | 23.00 | 90 | 45.50 (17.06) | 3.91 | 4.00 |
| Bunaken 1 | 2005 | 21.50 | 41 | 76.28 (27.64) | 1.91 | 1.00 |
| Bunaken 2 | 2012 | 28.48 | 64 | 44.38 (17.87) | 2.25 | 1.47 |
| Bali–Kangean | 2005 | 35.1 | 3 | Two fish, 35–50; one fish, >50 | 0.09 | 0.04 |
| Northern Sulawesi/Manado | 2005 | 36.5 | 4 | All 35–50 | 0.11 | 0.05 |
| Anambas Islands | 2013 | 15 | 5 | 14 (3.74) | 0.33 | 0.48 |
| Totals | 429.52 | 502 |
Several assumptions were made during the study. First, that comparisons could be made among locations assuming fish densities at natural unfished sites were likely to be similar in suitable reef habitat across Indonesia. Second, that seasonal differences in density within and among sites were unlikely. There is nothing in the literature to suggest that such seasonal differences occur for Napoleon fish: for example, reproductive activity occurs in most months of the year and animals can retain home ranges for extensive periods (Colin, 2010; Weng, Pedersen, Del Raye, Caselle, & Gray, 2015). Third, the slow and methodical survey speeds used, with Napoleon fish as the sole focal species, ensured a high probability of observing all individuals on the reef within the predetermined survey sites. Fourth, inter-observer bias was minimal with the participation of a limited number of observers across most sites and time periods. Finally, the estimations of swath widths and fish lengths were reasonable representations of survey widths and fish sizes and showed no systematic bias.
3 RESULTS
3.1 Field surveys and fishing pressure
Fish abundances were assessed for nine locations during baseline surveys and reassessed 6–9 years later at six of these locations, giving a total of 15 surveys (Figures S1–S8; Table 1). Data from different locations were expressed as numbers of fish km−1 transect distance, and densities hectare−1 and body sizes were estimated (Figure 11; Tables 1 and 2). It was recognized that errors in the estimation of swath widths could result in errors in density values; however, density measures are more commonly used in underwater surveys and reported in the literature than numbers of fish per unit distance, and hence both measures were considered. To check for possible bias with swath width estimation, fish per unit distance travelled was plotted against estimated densities of the same transects for all surveys (n = 15); the relationship was significant and, despite some variability, no obvious source of systematic bias was indicated amongst observers in estimates of swath widths (r = 0.884; P < 0.01; n = 15) (Table 2). Density (fish hectare−1) was used in subsequent analyses because this is the most commonly used measure in fish abundance studies and therefore the most useful for comparisons among different studies.
To test whether designated fishing intensity correlated with fish densities, these were plotted from all nine initial surveys. The correlation was negative and significant (r = −0.895; P = 0.01; n = 9), indicating that the designations of fishing intensity were reflected in Napoleon fish densities during the initial surveys.
3.1.1 Three single-survey locations
Three of the five high fishing pressure locations were surveyed only once and all three had low densities and few fish (Table 2). At Bali/Kangean Island (21–28 June 2005) surveys covering 35.1 km encountered only three fish (0.09 fish km−1, 0.04 fish hectare−1; Figures 9 and S6). The survey conducted at the Anambas Islands (10–14 May 2013) covered 15 km and only five fish were seen (0.33 fish km−1, 0.48 fish hectare−1; Figures 10 and S7). In northern Sulawesi/Manado (16–25 July 2005), 36.5 km of surveys documented just four fish (0.11 fish km−1, 0.05 fish hectare−1; Figures 4 and S8).
3.1.2 Six repeat survey locations
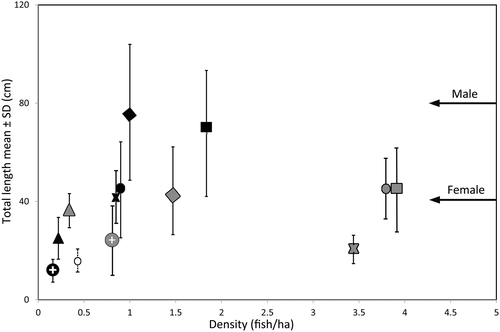
During the initial (first baseline) surveys the lowest densities for Napoleon fish (0.16–0.22 fish hectare−1) were found in heavily fished locations, with almost all fish observed being within the juvenile size range (Figures 11a, b and 12a, b; Table 2). The highest densities of fish (0.86–1.78 fish hectare−1) were found in medium to lightly Napoleon fished locations (Banda Islands, Raja Ampat, and Bunaken National Marine Park), with fish noted across a range of adult sizes, although with very few being larger than 100 cm TL (Figures 11 and 12). Locations with medium fishing pressure had size ranges between those found in the high- and low-intensity locations during initial surveys (Figure 12c, d).
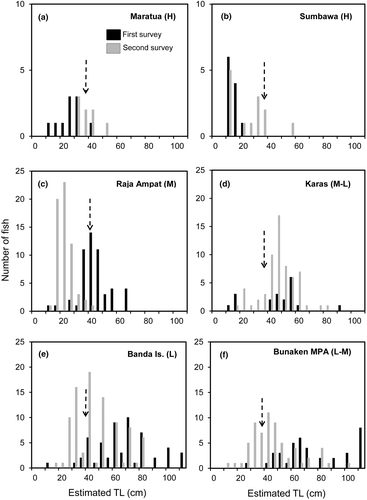
Follow-up (second) surveys were performed in six locations 6–9 years later (Tables 1 and 2). Both densities and size-frequency distributions varied within and among sites between survey periods, and according to fishing pressure (Figures 11 and 12). At sites of high fishing intensity, densities remained low at <1 fish hectare−1, and almost all fish surveyed were in the juvenile size range. At locations of medium fishing pressure, densities were 1.5–4.0 fish hectare−1. A significant increase in abundance was noted in the case of Karas Island, from 0.9 to 3.8 fish hectare−1. It was noteworthy that in Raja Ampat, Bunaken National Marine Park, and the Banda Islands, many smaller fish appeared during the second survey.
From a two-way analysis of variance (ANOVA) across locations and survey periods (spss statistics 25; IBM, Armonk, NY), the densities (fish hectare−1) of Napoleon fish were significantly different among locations according to fishing pressure (F = 6.759; P = 0.029; df = 2) and between visits (F = 10.927; P = 0.16; df = 1). A post-hoc Tukey's test showed significance between medium and high fishing pressure (P = 0.036), and marginal significance between low and high fishing pressure (P = 0.055). Napoleon fish densities were significantly higher in the second surveys (F = 10.111; P = 0.019; df = 1). Two-factor ANOVA without replication for size and abundance within locations (standardized to the shorter of the two survey transects in each location for consistency) showed that at Karas Island the abundance of Napoleon fish was significantly higher in 2016 (F = 6.966, p = 0.019; df = 1).
From a two-way ANOVA across locations and survey periods, the mean body sizes of Napoleon fish differed significantly according to fishing pressure (F = 13.724; P = 0.006; df = 2), but not between the first and second surveys. Post-hoc Tukey's tests showed that mean sizes differed significantly between low and high fishing pressures (P = 0.005) and low and medium fishing pressures (P = 0.049).
3.2 Determination of survey distances
A key aspect of each survey was to determine when sufficient distance had been covered to determine representative Napoleon fish densities. Figure 11 shows the patterns of mean cumulative densities over total survey distance for each of the six resurveyed locations in both the initial and the resurvey periods. At least 10 km of survey was needed, and sometimes much longer (>20 km), before the cumulative mean density estimate stabilizes and the sample was considered representative. Therefore, long distances are required to adequately sample this species for field abundance, and longer surveys are required where abundance is lower.
3.3 Use of scuba versus snorkel for surveying Napoleon fish
Ten comparative scuba and snorkel surveys were conducted at four of the six study locations, i.e. applying both scuba and snorkel surveys at the same locations and times, to assess the possible effect of survey method. There was a significant correlation between the two survey methods (R = 0.967; P < 0.001; n = 10), demonstrating that both scuba and snorkel surveys are appropriate for surveying adults and larger juveniles of this species in areas adjacent to reef drop-offs.
4 DISCUSSION
4.1 Survey outcomes: trends in densities and fish sizes
Overall, both size and density data should be considered when assessing Napoleon fish populations and their changes over time, whereas survey transects may need to be 10, 20, or more kilometres in total length to gain representative density data. Both sizes and densities vary with level of fishing pressure, and knowledge of fishing or other events at study locations between survey periods was also important for interpreting the results.
Density data for Napoleon fish from the six locations subjected to different levels of fishing pressure and resurveyed after 6–9 years showed varying changes over time, i.e. between surveys, and in fish numbers (fish hectare−1) and sizes. Across locations, Napoleon fish densities overall increased between surveys, and varied from less than 1 fish hectare−1 in locations with high fishing intensity to about 4 fish hectare−1 in locations with low fishing intensity, with fishing intensity inversely related to Napoleon fish densities and mean sizes. An increase in density between surveys was significant at Karas Island, probably as a result of the cessation of fishing. In effect, this changed from a medium to a low fishing pressure location.
A large proportion of the fish surveyed were in their juvenile phase (<45 cm TL) in one medium and both high fishing intensity locations, compared with locations of lower fishing intensity. However, nowhere were there many adults above 80 cm TL, i.e. in the large female and male size range. Given that the species can attain at least 1.5 m TL and that larger females are likely to be disproportionately more fecund, the relative scarcity of large fish suggests few males and small numbers of the larger more fecund females (e.g. Barneche, Robertson, White, & Marshall, 2018).
There was a noteworthy appearance of multiple juveniles at four locations between surveys – Raja Ampat, Banda Islands, Karas Island, and Bunaken Island (but see Bunaken note below) – strongly suggestive of recruitment in both medium- and low/non-fished areas (Figure 13). Our observations, considered along with location-specific details, suggest that recruitment may partly depend on the local presence of sufficient adults in an area and/or remoteness from fishing that targets Napoleon fish, but could also be recruited from distant sources. The longer inter-survey interval at Karas Island (9 years) would have allowed recruits to grow to a larger size than in the other three sites (with inter-survey intervals of 6–7 years), which appears to be reflected in the resurvey data (Figure 12). It is not known where young Napoleon fish recruits come from (i.e. locally or from distant areas), whether recruitment is typically sporadic, as the size frequencies suggest, or whether the action by a single major Napoleon fish trader to stop taking this fish for export across his 55 collection stations in 2006 may have influenced the results. However, recruits were particularly apparent at the three locations where multiple adults were present during the initial baseline surveys and at one location, Karas Is., where fishing ceased after the first survey, suggesting that the absence of high fishing pressure may be important. On the other hand, the remote Anambas Islands provide evidence for recruitment largely coming from distant reproduction events, as the islanders have a long history of grow-out operations based on the capture of large numbers of Napoleon fish post-larvae that occurs seasonally each year. Despite the continuing arrival of these post-larvae, no adults were noted in the survey of these islands (Figure 14), although anecdotal information suggests that adults were common in the area many years ago.
The Bunaken National Marine Park data were surprising for their low densities despite large adults being present. The marine park was established in 1991 (van Beukering et al., 2007) and consists of five islands. Only Bunaken Island is relatively well protected through diver and ranger presence. This could explain how a wide size range of adults persist at Bunaken Island despite low-density fishing, relative to other low/medium-fished locations, because among all of the islands surveyed in the marine park only Bunaken Island had large fish. The absence of large fish at the other islands could be explained by a long history of fishing for Napoleon fish elsewhere in the park (away from Bunaken Island itself) as well as in adjacent areas outside of the park, which included the low-density Manado/northern Sulawesi site (Figure 4). However, the release of several hundred confiscated juvenile Napoleon fish into the marine park in early 2006 shortly after the first survey (World Wide Fund for Nature (WWF), 2006) complicates any conclusions about the origin of recruits and natural changes in abundance. In Raja Ampat, with a long history of Napoleon fish exploitation, fishing continued between surveys and there was a relative loss of larger fish, probably as a result of the continued fishing. With the loss of adults, the fishery may depend on recruits from more distant areas in future and Napoleon fish in this location may need management in order to persist.
Overall, the possible importance of both local and distant sources of recruits suggested by results and circumstances at the study locations is consistent with a recent study showing weak population structuring globally for Napoleon fish, which included samples from Indonesian fish. Napoleon fish can be considered a metapopulation, the conservation status of which depends on the successful management of a sufficient but currently unknown number and distribution of populations that could cross national boundaries (Ma, Colin, Sadovy de Mitcheson & Dawson, 2019).
4.1.1 GPS survey method
The ‘GPS distance survey’ approach proved well suited to assessing adult and large juvenile Napoleon fish in Indonesian waters. The method was readily learned by observers with a wide range of field experience, is relatively inexpensive, and is suitable for both snorkel and scuba surveys. Limited training is needed to ensure correct species identification, to avoid double counting, and for the estimation of swath widths and fish sizes. Given that transects are latitude–longitude referenced they are repeatable. The method is readily adapted to different field conditions and has now been applied by government researchers at several locations in Indonesia (BPSPL, 2013; Edrus, Yusma, Ricky, Junaidi, & Seputro, 2013; LPSPL, 2012, 2013; LSPSPL, 2012, 2014).
There is an extensive literature documenting the numerous types of biases in UVC surveys and how those might affect results (e.g. Edgar, Barrett, & Morton, 2004); however, these biases are often ignored by researchers using the ‘standard’ protocol. The GPS distance survey method gathers data that can be formulated as ‘standard’ UVC transects, if desired, by dividing them up or leaving them as lengthy surveys that determine the density, i.e. number of fish per unit distance, and can be used to examine social aspects, such as clumping, not possible with short transects. For Napoleon fish, depending on the density of the fish, at least 10 km, and possibly >20 km in locations with high fishing intensity, of survey distance may be needed.
4.2 Comparison of numbers and sizes of fish and fishing intensity outside of Indonesia
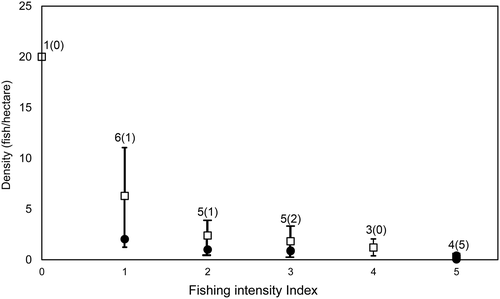
The Napoleon fish surveys in Indonesia were placed in a more global context by comparing them with densities of the species determined from 24 field sites from 11 countries across the Pacific and the Maldives. These data were collated as part of an earlier study from locations of differing fishing pressure (Figure 14). Although survey methods varied somewhat across these countries and designations of fishing pressure level are also likely to have varied, all studies were conducted in suitable Napoleon fish habitat (Sadovy et al., 2003). In the context of this wider dataset, Napoleon fish densities in Indonesia appear to be low compared with those in most other locations at comparable levels of fishing intensity. Given that Indonesia is centrally located in the overall range of the species, higher natural densities are expected in this country. The Indonesia data, therefore, should be of concern, especially because the country is the major exporter of Napoleon fish and includes about 20% of the global reef habitat of the species (Oddone et al., 2010). These results highlight the need for more effective management and conservation of Napoleon fish in Indonesia.
4.3 Implications for management and conservation
There is a clear need for the improved management of Napoleon fish in Indonesia, especially in locations of high fishing pressure, to allow for successful reproduction and population maintenance/recovery. In addition to reducing illegal international trade, which could be addressed by better controls of air and sea cargo exports, and by tagging legally exported fish (Lau & Sadovy de Mitcheson, in press) to improve enforcement operations, the management of large vulnerable reef fish like Napoleon fish calls for attention to: (i) controls to reduce fishing pressure to appropriate levels; (ii) ensuring sufficient juveniles mature and reproduce; and (iii) effective spatial protection to safeguard key habitat for spawning and nursery areas. With respect to safeguarding key habitats, we may also have to consider the possible impact of climate change on reef habitat in the future (Cheung, Watson, Morato, Pitcher, & Pauly, 2007; Graham et al., 2011; Kindsvater et al., 2017).
Indonesia has several regulations to manage or conserve Napoleon fish, including an export quota (currently 2000 fish annually), an allowable export slot size of 1–3 kg (Syam, Mujianto, & Putri, 2016), and several MPAs that contain the species. There is also a National Plan of Action (NPOA) (Sadili, Sarmintohadi, Ramli, Suharti, & Idrus, 2015) that has yet to be implemented, which is intended to address conservation measures to protect, conserve, and harness the potential of Napoleon fish in a sustainable manner to ensure its economic benefits for communities. During the inter-survey period the only new management measure to go into effect was the CITES Appendix II listing, put in place by Indonesia in 2006 and yet to be effectively implemented. There are no signs of recovery as yet in locations with high fishing intensity, and illegal exports continue, both of undersize fish (below 1 kg) and without CITES permits (Vincent, Sadovy de Mitcheson, Fowler, & Lieberman, 2013; Wu & Sadovy de Mitcheson, 2016). The indication of recovery at Karas Island is likely to have resulted from action taken by a single trader. Similar recommendations for management were made in an independent assessment of the status of the species in Indonesia, which highlighted that the management of the Napoleon fish fishery has not ensured its sustainability, and that if effective management action is not taken the species is likely to further decline, threatening the resource and the associated economic benefits to fishers (Edrus & Suman, 2015).
For large, wide-ranging, long-lived, relatively sedentary reef-associated fishes, like the Napoleon fish, the use of MPAs can be effective (Green et al., 2015) and can improve fisheries (Claudet et al., 2010; DiFranco et al., 2016; Hilborn et al., 2004). In tropical reef ecosystems, MPAs can potentially increase fish numbers inside the MPA and create spillover (from larvae and outgoing juveniles and adults) into adjacent non-fished areas (Bohnsack, Ault, & Causey, 2004; Harrison et al., 2012) while conserving the ‘iconic megafauna’ that is important to tourist divers (Friedlander et al., 2017). In some cases, however, high fishing intensity adjacent to protected areas and other issues, such as poor acceptance by fishing communities and inadequate enforcement, may preclude some of the potential benefits of protected areas (e.g. DiFranco et al., 2016; Lester et al., 2009). This appears to be the case for Bunaken National Marine Park, a protected location but where enforcement is poor and fishing for Napoleon fish in adjacent areas continues. Moreover, the most effective MPAs for both conservation and fisheries, at practical spatial scales, are most likely to be those that constitute a network of well-placed sites (Gaines, White, Carr, & Palumbi, 2010).
It is possible that the Napoleon fish could potentially be protected by relatively small MPAs, although more information is needed on movement patterns of the species and to determine whether there are minimum thresholds for mating group sizes to maintain viable populations. Although the species is known to spawn in small aggregations of tens to over 100 fish, observations of spawning by Napoleon fish in Palau since 2001 indicate that only a single male and female are needed for spawning to occur; individual males spawn pairwise and, when aggregated, mate successively with the available females (Colin, 2010). The minimum size of an MPA to ensure a viable population in Napoleon fish may be small if few adults are needed for population persistence. Information on this and on the catchment area of the species, which depends on the home range size, is needed. Weng et al. (2015) reported a maximum home range of 14 km, a minimum of 0.4 km, with most fish falling within 3–5 km, over about a year. Chateau and Wantiez (2006) found, from a single fish tracked for about a month, that the home range was about 5 hectares. Green et al. (2015) determined the Napoleon fish home range extent to be <10 km in a study of 210 reef fish species. Colin (2010) indicated, based on numbers of fish occurring at an aggregation site and the density of individuals outside of the aggregation period/area, that a daily migration maximum of 2–3 km was sufficient to assemble the numbers of fish seen in the aggregations surveyed, a distance easily traversed on a daily basis by adults. He noted several small aggregations along stretches of reef in Palau within 1 km of each other. In sum, and based on the limited available information on the species, areas with suitable adult (shelf edge) and juvenile (nursery areas) habitat of a few square kilometres might be sufficient to protect a small reproducing population, but these may not be effective if there is heavy adjacent fishing.
In Indonesia, as the Bunaken National Marine Park, Banda Islands, and Karas Island data indicate, the species can only withstand low levels of fishing pressure and may be compromised by fishing in adjacent unprotected areas. These data also suggest that the species can persist even in quite small areas (Colin, 2010), but that these would have to be well enforced or too remote for fishing to be effective. As a more precautionary approach, in the absence of more detailed information on the Napoleon fish, a ‘rule of thumb’ for an MPA size of twice its home range could be used (Green et al., 2015), suggesting that a larger area of 20–28 km2 of reef should be protected, or that a network of well-connected sites where reproduction occurs could be designed (Gaines et al., 2010). Clearly, movement information on the species is needed in Indonesia, and an understanding of the areas where it reproduces and minimum viable population sizes, in order to effectively site MPAs where both adult and juvenile habitat types are protected from fishing.
5 CONCLUSION
The results indicate that in Indonesia the current levels of exploitation, exacerbated by illegal trade, are precluding recovery in heavily exploited areas, with actual and potential loss of benefits to fishers and ecotourism (divers particularly like to see large Napoleon fish), and that management is needed. Only in medium- to low-intensity fishing locations, and where adults are present, is there some evidence of recovery, and management is called for particularly in areas with high fishing pressure.
Effective management actions are needed to increase density levels to closer to the 5 fish hectare−1 suggested to be the natural level, as assessed across multiple countries, and to ensure the presence of a wide size range of adults. Options for management and conservation include a temporary moratorium (decade) on the trade of wild-caught Napoleon fish, implementation of the 2016–20 National Plan of Action (Sadili et al., 2015), full implementation of the CITES Appendix II listing, which should include the tagging of exported wild-caught fish to identify those legally in trade, and adequately located and sized MPAs placed where adults are present and protected entirely from fishing. The moratorium would provide an opportunity to improve the status of the species to allow these measures to be put in place. In his assessment of the monitoring and management of this species, Gillett (2010) concluded: ‘Given that the fish is naturally rare, cannot sustain much fishing pressure and is mostly caught in fisheries that are notoriously difficult to regulate, the logical solution in many range countries would be to simply ban the export of humphead wrasse’. The results of this study are consistent with his conclusions.
ACKNOWLEDGEMENTS
The authors are grateful to Isa Nagib Edrus, Onny Nurrahman Marwayana, Heru Purnomo, Indra S. Hermana, Stanley Shea, Miftah Chazanah, and Allen To for field and technical support and for additional Napoleon fish information. Rachel Wong assisted with data and the preparation of figures. We thank Loby Hau and Gomen See for assistance with analyses. A variety of vessels and tourist accommodation provided assistance with the fieldwork. Research was funded by the CITES Secretariat, the United States National Marine Fisheries Service, the University of Hong Kong, and the Indonesia Institute of Sciences (LIPI).


