Influence of dielectric properties of polybutylene terephthalate and respective foam beads on process behavior in radio-frequency welding
Abstract
Radio-frequency welding shows great potential for a more sustainable manufacturing of lightweight bead foam products based on local dielectric heating of the part. This study provides the first insight into the material-process interactions required to enable interdiffusion between foam particles and thus adhesion. The complex relative permittivity is analyzed by impedance spectroscopy of the bulk polymer and foam beads using specially designed measurement cells. Due to the increased flexibility of the polymer chains at elevated temperatures, the relaxation mechanisms are promoted, resulting in a shift of the curves to higher frequencies. At a fixed frequency, a peak in the imaginary part is observed above temperature, revealing the superposition of these two parameters. The foamed beads show similar trends with an attenuated signal due to the high volumetric fraction of air within the multiphase system. The linear dependence between and volumetric power as direct process feedback due to dielectric heating was observed during welding. Compared to the delayed signals from the shielded temperature sensors, the analysis of power consumption allows for higher quality real-time monitoring throughout the process cycle. The correlation also allows prediction of power levels at defined temperatures.
1 INTRODUCTION
From packaging to sports equipment to house insulation, a variety of products in our daily lives are based on bead foams. Such materials consist of small particles of a cellular structure from polymer and encapsulated air.1 Since their discovery in 1949, the world of bead foams has been expanding with the latest developments moving towards temperature-resistant and bio-based products.2 These new materials will eventually contribute to a new era of sustainable consumer goods and lightweight parts in the transportation sector. Bead foams made from polylactide acid (PLA) are one of the most promising materials to replace current petro-based polystyrene (PS) in the packaging industry.3 The production of parts from these bio-based and bio-degradable particles can be limited by their susceptibility to hydrolysis both during the autoclave foaming and the welding process by conventional steam chest molding.4-6 In addition, polymers with higher service temperatures such as polyethersulfone (PESU), polyamides (PA), or polyesters (PET and PBT) recently shift into the focus of research and industry.2, 7-9 Bead foams made from these engineering polymers can be used in more demanding applications in terms of mechanical and thermal properties. However, this is accompanied by higher temperatures required in the welding process to bond the individual particles into a solid part. In conventional steam chest molding, as state-of-the-art manufacturing technology, the temperature is closely related to steam pressure via the vapor pressure curve. Since normal equipment is limited to 5 bar (160°C), high-temperature materials with processing windows around or above 200°C can only be welded in specialized high-pressure machines using up to 25 bar (230°C) or superheated steam.7, 10 To circumvent these limitations, new technologies have emerged in the field of bead foam welding in recent years, differing mainly in the type of heat source. For example, a dynamic variothermal mold setup can be used, in which the foam beads are heated by conductivity of the walls combined with IR radiation, which is therefore limited in part thickness.11 Probably the most relevant new technology towards sustainability was patented in 2017 by Victor Romanov at Kurtz GmbH & Co. KG.12
At the beginning of the process, the particles are filled in the mold with defined compression, where an oscillating voltage with a frequency of 27.12 MHz is applied to the active electrode.13 The resulting electromagnetic field between the electrodes can interact with the materials inside and generate molecular vibrations.14-16 Similar to a microwave oven at home, this generates intermolecular friction that leads to local heating of the material, which saves energy by minimizing losses in the mold and its surroundings. This process therefore has a high potential to significantly reduce the carbon footprint of the entire polymer bead foam sector.
Depending on the frequency, different types of polarization mechanisms such as electronic, atomic, hopping or space charges can occur in materials, but orientational/dipole polarization is present in the process-relevant region of radio-frequency (RF welding).17, 18 In polymers or other macromolecules, the necessary dipole arises from different electronegativities of the atoms within the structure. Polyesters possess a dominant dipole within the ester group due to significant differences in electronegativity of the carbon and the two oxygen-atoms (Figure 1).19-21

Furthermore, the location of the partial charge difference is important in order to understand its behavior within an oscillating electromagnetic field. For long chain molecules like polymers, the dipole vector can be positioned in relation to the backbone structure fixed parallel (A), rigidly attached on a short side group (B) or more flexibly connected within a longer side chain (C).22, 23 This defines its type to A, B, or C, respectively. Since within the ester group dipole moments occur both in direction of the backbone as well as perpendicular in the carbonyl group, a mixture of type A and B can be assumed.
The location of the dipole within the chain significantly influences its flexibility and interference with neighboring chains. This mobility will set the ability to reorientate at changing fields, hence the relaxation. For most polymers, depending on temperature and frequency, three types of relaxation processes α, β and normal mode can be present.22, 24, 25 However, normal mode relaxation is only visible in type A polymers at high temperatures, which is related to fluctuations of the end-to-end dipole vector and increases with molecular weight.26, 27 α and β on the other hand, denoted as principal relaxation types, exist in both amorphous and semicrystalline polymeric macromolecules. Towards low frequencies and/or high temperatures, α-relaxation processes emerge, which can be referred to as dynamic glass transition.28, 29 The second principal β-relaxation originates mainly in localized rotational fluctuations via side groups.30 This process can be seen a generic feature of every glass-forming molecule, which was described by Goidstein and Johari.31, 32 In comparison to the α type, this relaxation occurs at high frequencies and/or low temperatures and its temperature dependency can be described by an Arrhenius law with defined activation energy.22, 33 Towards higher temperatures both principal relaxation types can merge together, forming the αβ process. This phenomena is only visible at temperatures above the splitting region, which depends on the molecular structure and frequency.34 Dielectric properties and their change with temperature therefore depend significantly on the type of relaxation.
To understand the properties of cellular structures, the matrix is only one component. In addition, the inclusion, normal air, must be considered as well as their interactions. In the presence of a second phase within the analyzed volume, more complex phenomena occur due to different interactions of the materials with the electromagnetic field. Therefore Bruggeman developed the effective medium approach in order to describe a mixture of multiple phases.35, 36 This theory is mainly influenced by the relative permittivity of the phases, shape, and distribution of the inclusions and volumetric ratio.37, 38 In summary, the dielectric property of a multiphase system is way more complex than a linear volumetric dependency and hard to accurately describe by formulas.39 Existing mathematical approaches are continuously optimized for conductive inclusions and/or low ratio of fillers. For polymer foams, the inclusion consists of isolating air and normal densities are between 20–400 kg/m3, so the inclusion is the predominant fraction. Thus, no mathematical models for polymer foams are present in literature.
Similar to dynamic mechanical analysis, the real part of relative permittivity is a measure for reversibly stored energy in the system by orientation of dipoles per period. The imaginary part therefore reflects the energy loss inside the material due to molecular friction during continuous reorientation. With increasing frequency, at a certain point, the flexibility of the dipoles is limited, and complete orientation cannot be achieved within the oscillation cycle. Thus, the proportion corresponding to respective relaxation mechanisms is no longer contributing to the overall real part .40 In this transition phase, the dipoles lag behind in orientation to the external electromagnetic field so maximum field strength is simultaneously present with considerable lever to introduce maximum torque into the dipoles. This phenomena results in a peak in imaginary part of the relative permittivity .41 Above a certain frequency, dipoles can barely orientate within the fast changing electromagnetic field, so movement and therefore friction is absent.22, 42 Hence, the complex relative permittivity is an important value in the investigation of dielectric heating.
is the permittivity of vacuum, the root mean square (RMS) value of the field strength, and the frequency of the system. At a defined frequency, fixed by the setup, the heat input is dependent on the imaginary part of relative permittivity to the first power and on the electromagnetic field strength to the second power. A change in permittivity by increased temperature can therefore result in a direct change in heating power by the imaginary part and additionally indirect by variation of field strength due to previously listed phenomena. For bead foams based on unpolar polymers like expanded polypropylene (EPP) additional polar substances need to be added within the polymer matrix as fillers or coated on the surface of the particles to induce heating and subsequent welding.44 Carbon nanotubes, for instance, have been studied as conductive filler for polymers in fibers and for additive manufacturing to induce noncontact heating by electromagnetic waves.45, 46
This research focused on a first investigation of material-process interactions during the novel manufacturing technology of radiofrequency welding of bead foams. This required a detailed analysis of the dielectric properties of polybutylene terephthalate (PBT) as bulk polymer and in the form of foam beads by specialized measuring cells. These characteristics were later correlated with direct process feedback from the welding unit in terms of power consumption and temperature curves. The research revealed direct relationships, allowing real time monitoring of the process and accurate predictions of output values.
2 MATERIALS AND METHODS
2.1 Materials
In this study, the PBT grade Pocan 1400 from Lanxess AG (Cologne, Germany) was used. Properties of the raw polymer are listed in Table 1. The granulate was processed, as described in a previous study, by a tandem foam extrusion line from COLLIN Lab & Pilot Solutions GmbH (Maitenbeth, Germany) with supercritical CO2 as physical blowing agent coupled with an under-water granulator Gala LPU by Maag Germany GmbH (Grossostheim, Germany).10 The resulting expanded PBT beads (EPBT) had a density of 319.64 ± 5.88 kg/m3 (cross-section can be seen in Figure S1). This material was used to identify direct correlations between polymer and beads. With commercial bead foams, processing additives like nucleation agents or chemical modifiers are often used during foam production.
| Material | PBT Pocan 1400 |
|---|---|
| Number average molecular weight [] | 29,500 |
| Weight average molecular weight [] | 67,900 |
| Polydispersity index (PDI) [] | 2.3 |
2.2 Impedance spectroscopy
Depending on the investigated frequency, the evaluation of dielectric properties can be carried out by different types of measurement methods.22 Due to the operating frequency of 27.12 MHz in RF welding, the RF I-V method was used to determine the complex relative permittivity of the samples. The total setup consisted of the E4991A RF impedance analyzer from Keysight Technologies, Inc. (Santa Rose, USA), an UF55plus universal oven with entry port by Memmert GmbH + Co. KG (Schwabach, Germany), and two special cells for the measurement of bulk polymers and their respective foamed beads under defined compression. The connection between the analyzer and cells was realized by the coaxial cable Aircell 5 (SSB-Electronic, Lippstadt, Germany) split into two temperature-resistant 311-KAP50S-RAD Kapton cables (Allectra GmbH, Berlin, Germany) before entering the oven towards the two electrodes of the cells. These low-loss cables ensure high-measurement accuracy at minimized resonances within the LC circuit consisting of cables and electrodes. With this setup, an upper frequency limit of around 50 MHz was realized with a lower limit of 1 MHz defined by the impedance analyzer. The two self-designed and self-manufactured cells consisting of aluminum electrodes and isolation layers of polytetrafluoroethylene (PTFE) can be seen in Figure 2 and were inspired by an earlier study of Bifano et al.47, 48
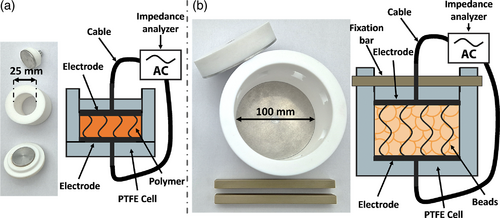
The small cell, designed with an internal diameter of 25 mm, can be used to analyze solid samples up to 10 mm in thickness. For this study, plates with 1 mm thickness were prepared by hot pressing. Foamed beads were analyzed by using a bigger cell with a diameter of 100 mm. The lower part of the cell and the walls are manufactured using a single piece of PTFE. In combination with two polyether ether ketone (PEEK) bars and adapted mounting holes, the foamed beads can be compressed prior to the measurement in an external press. Therefore, the electrodes are set to a specific height and locked in place. This ensures both a constant electrode distance and a defined volumetric filling of the cell with polymer and air. To eliminate the influence of crystallinity due to different thermal histories, the plates and the foam beads were examined by differential scanning calorimetry (DSC). The crystallinity of both plates (32.9 ± 0.1%) and foamed beads (31.6 ± 0.8%) were on a similar level, thus can be excluded as an influencing factor. Similarly, the moisture content was a constant level of 200 ppm for both. In order to achieve accurate results, open/short/load compensation was performed. As load, PTFE plates with similar geometries to the tested materials and temperature-consistent dielectric properties () were used.49 Three samples per parameter and 10 repetitions per sample were measured. Since the uncertainty within one sample is insignificant, only the standard deviation between the three distinct samples are shown for each measurement.
2.3 Radio-frequency welding
Welding trials were carried out on the RF system Wave Foamer C from Kurtz GmbH & Co. KG (Kreuzwertheim, Germany) located at Neue Materialien Bayreuth GmbH (Bayreuth, Germany). The machine was equipped with a plate mold of PTFE with an area of 200 × 100 mm2 and 25 mm height resulting in a total part volume of 500 cm3 (Figure 3).
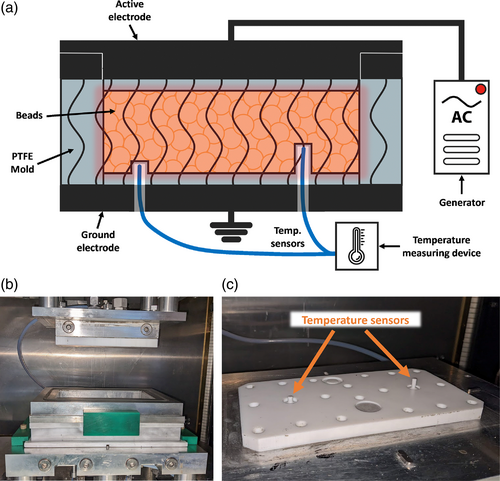
To avoid electric breakdowns, isolation layers are required above and below the part towards the electrodes. These plates had a thickness of 16 and 11 mm and consisted of PTFE as well. In the lower plate, two protective sleeves from PTFE were incorporated, which housed the fiberoptic temperature sensors. Since metals would interact with the electromagnetic field, only these types of sensors can be used inside the electromagnetic field. The right sensor penetrated the sample for 10 mm to show the temperature development on the inside of the plate while the second one placed more in the surface at a depth of 5 mm. Due to the shielding of the sensors, measured temperature curves showed noticeable lag and attenuation of the signal.
Foamed beads were kept at around 25°C (temperature of the technical laboratory) before welding, and the mold was slightly pre-heated from previous runs. After manual filling of the foam beads, the mold was closed and an oscillating voltage with a RMS value of 7.0 kV was applied to the upper active electrode. A short ramp-up of 1 s was set to avoid electrical breakthrough. The RMS value is used since a normal average of a sinusoidal curve oscillating around zero would cancel each other out. The actual peak voltage present at the electrode is ±9.8 kV at a frequency of 27.12 MHz. For the trials, the desired volume ratio of polymer inside the mold of 20 vol% was calculated by the volume of the mold and density of the base polymer (1.311 g/cm3). After heating, the mold was kept close for 240 s to cool the part down and ensure stabilization before demolding.
3 RESULTS AND DISCUSSION
3.1 Dielectric properties of the polymers
The complex relative permittivity of the bulk material is a specific dielectric property of the polymer, thus based on its structure and molecular interactions. The results by impedance spectroscopy can be divided into real and imaginary part, which is shown for the bulk PBT in Figure 4 as a function of frequency. Varying temperatures in 20 K increments are indicated by color.
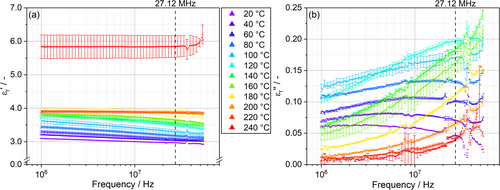
At 20°C, the real part is at around 3.0 with a slight decrease towards higher frequencies. If the temperature is increased up to 220°C, the shape of the curve changes throughout, while apparently the overall level of rises to just below 4.0. This behavior can be described by two phenomena. First, at higher temperatures, chain mobility within the polymer system is enhanced. Thus, free volume between the molecules increases, leading to reduced intermolecular interactions.50, 51 As a result, dipoles are less restricted and can rotate more freely, enhancing polarization within the external field. Contrary, increased motion of dipoles leads to less perfect orientation due to higher temperature-induced fluctuations, reducing the average alignment and therefore .52 Evaluating the impact of these counteracting phenomena is hardly possible, but the overall rise indicates a predominant effect of the chain mobility. Second, at frequencies around relaxation time τ, the corresponding relaxation process starts to lag behind the electromagnetic field, so average polarization declines.18 This results in a stepwise decrease in real part with frequency, which in Figure 4a is only partially visible per temperature due to the constrained measurable frequency range in the setup. With increased mobility of the dipoles to align, relaxation time τ is reduced at higher temperatures, resulting in a shift of the curves towards higher frequencies.41 This shift is responsible for the change in shape between 20 and 220°C as for the overall increase. Difference in permittivity over this step indicates the dielectric strength of the responsible relaxation process.21 The melting point of this material, according to DSC at 10 K/min heating rate, is at 224 ± 0.2°C with an onset at 216 ± 0.1°C. This breakdown of rigid crystalline domains allows more dipoles to fluctuate and therefore interact with the electromagnetic field.53, 54 Thus, enhancing overall polarizability of the material at 240°C and therefore the real part from 3.9 to 5.8. With a value of a non-polar material at 1.0 in mind, this results in a difference of 39%, being slightly higher yet close to crystallinity calculated earlier by DSC at 32.9 ± 0.1%. Additionally, amorphous sections in close proximity to crystal boarders are regions of constrained movement and thus defined as ridged amorphous phase.54, 55 Both, overall enhanced mobility of dipoles and influence of rigid amorphous phases can contribute to this deviation.22 Due to the softening of the specimen, electrode distance and alignment can be influenced slightly, resulting in an increased standard deviation.
The imaginary part (Figure 4b) shows more significant changes throughout the temperatures. With literature in conjunction, sections of a peak are visible within the analyzed frequency.56 Similar to the real part , a shift of the -curve to higher frequencies is perceived if temperature rises, due to previously described changes in relaxation phenomena. In addition, the amplitude of the peak seems to increase with temperature, resulting in overall higher levels of up to 120°C despite the shift of the maximum frequencies above the observable spectrum.57 Again, enhanced polarizability is observed due to the facilitated mobility of the dipoles.
By plotting both parts of the complex relative permittivity over temperature at different frequencies, similar trends are evident through superposition of temperature- and frequency-dependency (Figure 5).
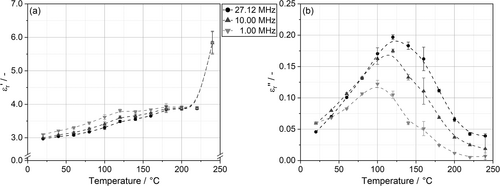
In real part , an upwards step is observed towards increased temperatures. This step shifts to higher temperatures if the frequency is increased from 1.00 MHz up to 27.12 MHz, where the RF process is operated. The lower limit of 1.00 MHz is defined by the impedance analyzer. On both sides of the upwards step, values for all frequencies converge. The results indicate that the dielectric strength, expressed by difference in permittivity over the step, is constant and independent of frequency.58 The steep increase in real part from 220 to 240°C, due to melting of crystalline domains, is clearly visible, which shows no dependency on frequency. For PBT, calorimetric glass transition occurs at around 50°C.59 The peak in imaginary part is fully developed for all frequencies and is related to the α-relaxation (Figure 5b). This process is linked to segmental motion of the chain by micro-Brownian movement, therefore denoted as dynamic glass transition temperature, which is always shifted to higher temperatures than the calorimetric one.21 The dependency shifts the peak towards higher temperatures if frequency is increased. Due to enhanced flexibility of dipoles and therefore alignment with the electromagnetic field, peak height also increases at higher frequencies. Compared to β-relaxation, the α process results in a broader and asymmetric peak, since it is more an intrinsic feature of the chain dynamics than a distribution of relaxation times caused by spatial inhomogeneities.22
By looking closer on the comparison of the results plotted over frequency (Figure 4) and temperature (Figure 5), superposition of the two parameters can be observed. For low temperatures or high frequencies, the flexibility of the dipoles is not sufficient to align with the oscillating field. When either temperature increases, leading to more flexibility within the structure, or frequency is reduced, the corresponding relaxation process start to contribute to the overall polarization. This phenomena leads to an increasing real part until a limit is reached and full dielectric strength is present. With respect to the RF process, which operates at a constant frequency of 27.12 MHz, the change in dielectric properties from room temperature up to the processing range is critical to understand complex interactions during bead foam welding.
3.2 Dielectric properties of foamed beads
As shown previously, the complex relative permittivity of the bulk polymer as a single phase is influenced by multiple parameters, which have to be considered to evaluate the behavior within an external electromagnetic field. In bead foams with cells filled with air, a second phase is introduced. Therefore, the three temperatures (20, 60 and 100°C) were selected to analyze the influence of air inside the cellular structure on the dielectric properties, which can be seen in Figure 6.
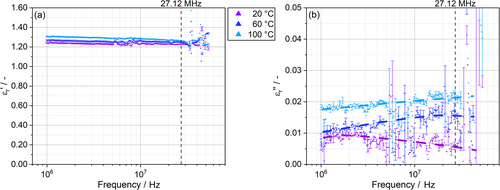
For these experiments, the EPBT beads were compressed to a volumetric ratio of 20% PBT and 80% air inside the analyzed volume between the electrodes. Since air has a complex relative permittivity of and occupies 80% of the volume, the measured values are significantly lower compared to bulk PBT. The real part at 20°C is at a constant level of 1.23, increasing for higher temperatures. Similar to the results of bulk PBT, the shape of the curve shows a slight drop over the frequency at 100°C. Due to the high amount of air, these effects are considerably more attenuated. This is even more visible in Figure 6 on the right side where the imaginary part is plotted over the frequency. At these low values, disturbing effects from the measurement setup and internal resonances are more significant, resulting in relatively high standard deviations. These resonances are caused by the internal LC resonant circuit consisting of capacitors and inductors within the cables, connectors and electrodes. This restricts the usable frequency range to up to 30 MHz. Despite that, overall trends of the curves are still visible. Again, based on the results from bulk measurements, the peak seems to shift to higher frequencies if the temperature is increased. In addition, an overall raised level of imaginary part is caused by the enhanced flexibility of the dipoles.
With the RF process in mind, real and imaginary part of the relative permittivity at 27.12 MHz of bulk material and foams are plotted in Figure 7 for comparison.
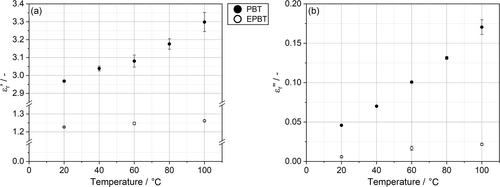
As expected, the real part of relative permittivity increases in a similar manner than the bulk material. If of EPBT at 20°C is predicted by applying a linear mixing rule from PBT (2.97) and air (1.00), a value of 1.39 results. This overestimation compared to the measured value is consistent with literature, where all mixing rules for multiphase systems indicate the dielectric properties of an effective volume below the linear approximation based on volumetric ratios.35, 60 Main factor resulting in a non-linear dependency is the disturbed electromagnetic field inside the mixture, leading to an excess in field-strength within the more polar phase.17, 61 Besides the distortion, polarization inside the phases induces opposing electromagnetic fields due to the dipole orientation, which overlay with the external field to an effective field.22 In addition, on every interface, due to fillers or air pockets, chain mobility can be restricted by constrained regions within the polymer or charges can build up, resulting in an locally changed polarizability at specific frequencies.55, 62
The imaginary part on the right side of Figure 7 shows a similar dependency between PBT and the foamed state of EPBT. In both cases, increases almost linearly with temperature. Comparing 20 to 100°C, a significant increase of approximately 270% emerges, leading to a drastically higher power input. Again, a linear volumetric estimation is overestimating the experimental values for EPBT at all temperatures, confirming the insufficient suitability of this mixing rule. Due to previously described reasons, no mixing rule is introduced in literature to precisely describe the dielectric properties of bead foams with polymer matrix and air as inclusion. The experimental results observed here will support the deduction of theoretical predictions by new mixing rules in later studies.
3.3 Influence of dielectric properties on the radio-frequency heating process
The main objective of this study is to evaluate the temperature-dependent dielectric properties and their influence on process behavior in radio-frequency welding of bead foams to a three-dimensional part. To induce welding between the particle surfaces, the material needs to be heated. This enhances flexibility of polymer chains, allowing interdiffusion processes to form a sufficient bond between the beads. For this grade of EPBT, a comprehensive study by Kuhnigk et al. evaluated the fusion temperature range around 190 to 205°C.7 For process analysis, the EPBT beads were placed in the mold and compressed to a volumetric ratio of 20%, similar to the dielectric measurement before. The temperatures during the process are recorded by the two sensors close to the mold surface (5 mm) and towards the middle of the part (10 mm) with derived heating rates from the first deviation (Figure 8).

First of all, both sensors show a similar trend in the temperature development during the process time of 200 s at an electrode voltage of 7 kV. The sensor close to the mold surface starts approximately 5 K higher at 37°C. This initial temperature is related to a slight heat-up of the mold by pre-trials. Since the mold consists of PTFE without an active cooling system, the time to cool down to ambient temperature of around 25°C is relatively long. After filling the mold with beads, temperature distributes slowly by conductivity throughout the part, resulting in an increased start temperature also in the middle of the part of 31°C. In addition, a measurable heating rate at the beginning is observed, which is higher for the sensor closer to the mold surface. Within the first 40 s, only a minor temperature increase is detected. Subsequently, the heating rate increases consistently up to a maximum of 1.7 K/s in the center of the sample and 1.2 K/s closer to the mold at around 80 s. The sensor close to the mold has a maximum of 165°C, whereas the second one in the middle reaches the limit of the fiberoptic sensor at 187°C after 175 s. The second effect, both visible in temperature as well as heating rate, is thermal inertia of the sensor with the protective shielding made of a PTFE tube. This results in a delayed signal of around 10 s in the beginning and is assumed to attenuate the overall measured temperature throughout the process. With these two effects in mind, the actual temperature peak in the middle of the part is assumed to be likely over 190°C, thus enabling the beads to fuse together. The produced part can be seen in Figure 9, which shows only moderate interbead adhesion in the middle.
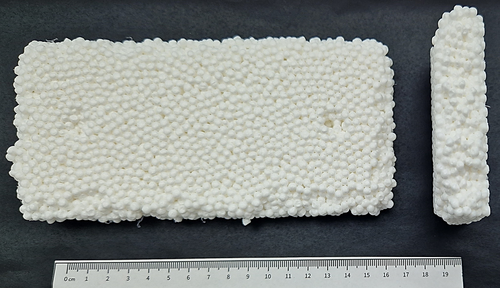
Due to the cooling effect of the mold by thermal conductivity near the surface, temperatures are not sufficient for good welding between the beads. This can be observed by loose beads on the surface of the part. Despite the volumetric heat input by the nature of the RF process, this results in the emergence of an increasing temperature gradient over the part thickness with process time.
The RF process provides continuous data that allows tracking the status of the real-time power output derived from the electrode current. Material and process parameters are directly linked to this power output by Equation (2), which is observed over the process time together with the imaginary part of PBT over temperature at 27.12 MHz (Figure 10).
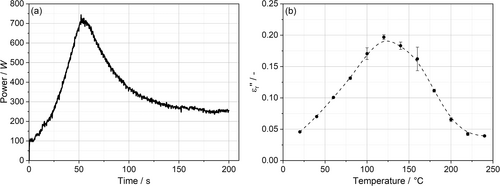
For this trial, the process parameter of electromagnetic field strength , defined by electrode voltage was kept constant over the process cycle. Thus, the resulting power output is linearly related to the imaginary part of the material within the electromagnetic field. This direct correlation is clearly visible in Figure 10 with similar curve shapes. Initially, low power input is observed when beads are at around 30 to 40°C, caused by the low imaginary part . Subsequently, the material heats up by the power input, resulting in a maximum in power of around 700 W shortly after 50 s. The peak can be directly linked to the maximum in of PBT at 120°C, thus allowing an indirect analysis of the temperatures inside the bead foam part without any delays by sensor structures. A difference in comparing the time at maximum heating rate in Figure 8 with the maximum power in Figure 10a is observed, which in theory should line up. In reality, the signal gathered by the fiber optical sensor shows a significant shift of 30 s, thus underestimating the actual temperature inside the part throughout the process. After the peak is exceeded, power starts to decline and converges towards a plateau at around 250 W. This overall trend is in conformity with the imaginary part . However, the initial power level is lower compared to at the end of the process, while shows a similar level on both ends of the temperature range. This difference arises due to the temperature gradient in the plate increasing with over the process cycle. The otherwise homogeneous volumetric heating of the beads by the electromagnetic field is disturbed by conductive losses into the cold PTFE mold. Thus, resulting in a mixture of beads at different temperatures and therefore varying dielectric properties, increasing the power input at the end of the process. As Campos discussed in his study, the dependency of on temperature is crucial for a homogenous heating.41 If the material shows an upwards trend in , local hotspots due to material variations or disturbed fields absorb even more energy amplifying the inhomogeneity. In contrast, a downwards trend helps to counteract this phenomenon. This behavior is of a great importance in the welding of bead foams, since a certain temperature range limits the process for good fusion.
In addition, the power is predictable vice versa by the dielectric properties if all process parameters and geometries are known at defined temperatures. The electromagnetic field strength has to be calculated by estimation of three capacitors in series (PTFE mold—bead foam part—PTFE mold). Here, the complex relative permittivity of the bead foams as effective volume has to be considered and interpolated to the respective temperature. At 35°C as average starting temperature, the field strength is approximately , which in theory results in a power of 199 W. This is slightly higher than the measured power at the beginning. Towards the maximum of at 120°C, the field strength is calculated to be around leading to a power of 606 W, close to the measured maximum of approx. 700 W. In summary, the approach is an important tool for understanding material-process interactions, within the RF molding of bead foams. Two variables must be considered for accurate predictions. First, a homogeneous temperature is necessary to calculate the dielectric properties, which can be accurately defined only at the beginning of the heating process. Second, the foam structure inside the beads interferes with the local field, which can lead to an underestimation inside the polymer cell walls. Since this effect is hardly predictable, the field with respect to the effective volume approach is the best available approximation.
4 CONCLUSION
This study provides the first scientific analysis of the novel technology of radio-frequency based welding of polymer bead foams. The dielectric properties of polymers are determined by permanent dipoles in their molecular structure and resulting relaxation mechanisms. For PBT, the α-relaxation process was observed within the analyzed temperature and frequency range. When the temperature is increased, the decrease of as well as the peak of shifts towards higher frequencies, which is due to the increased flexibility of the dipoles aligning with the oscillating electromagnetic field. At 240°C, the crystalline domains melt, increasing the number of flexible chains, leading to a steep increase in . At fixed frequencies, the peak of , corresponding to the dynamic glass transition, shifts to higher temperatures as the frequency is increased.
The analysis of the foam beads at a defined compression to 20 vol% shows similar trends compared to the base polymers. Because of the high air content within the volume, the overall values are significantly damped, leading to increased deviations. Nevertheless, both parts of the complex relative permittivity tend to increase at higher temperatures.
During the RF welding process, constant real-time feedback from the machine is returned in the form of power. Since the volumetric heat input scales linearly with the imaginary part , the temperature can be estimated. A comparison between the heating rate and the power input shows a significant lag in the sensor values due to the thermal isolation provided by the protective sheathing. Therefore, this relationship can be used to estimate the temperatures of the material more accurately and also predict the power at different temperatures.
For future research, multiphysics simulation tools are of great interest to gain detailed and local insight into the developments over process time. However, these simulations require accurate material and process models, which can be derived from this study.
AUTHOR CONTRIBUTIONS
Marcel Dippold: Conceptualization (equal); data curation (equal); formal analysis (equal); investigation (equal); validation (equal); visualization (equal); writing – original draft (equal). Christian Töpfer: Conceptualization (equal); data curation (equal); formal analysis (equal); investigation (equal); methodology (equal); validation (equal); visualization (equal); writing – original draft (equal). Holger Ruckdäschel: Funding acquisition (lead); project administration (lead); supervision (lead); writing – review and editing (lead).
ACKNOWLEDGMENTS
The authors would like to acknowledge the Neue Materialien Bayreuth GmbH and especially Thomas Frank (M.Sc.) for providing access to the Wave Foamer C from Kurtz GmbH & Co. KG and supporting with the trials and analysis. Additionally, the Bavarian Polymer Institute (BPI) must be acknowledged for providing access to different analysis methods. Open Access funding enabled and organized by Projekt DEAL.
FUNDING INFORMATION
This research was funded by the “Bavarian Ministry of Economic Affairs, Regional Development and Energy” within the funding program “Verbundforschungsprogramm Förderlinie Materialien und Werkstoffe” (grant number MW-2104-0005).
CONFLICT OF INTEREST STATEMENT
The authors declare no conflicts of interest.
Open Research
DATA AVAILABILITY STATEMENT
The data that support the findings of this study are available from the corresponding author upon reasonable request.


