Long-Term and Continuous Plasmonic Oligonucleotide Monitoring Enabled by Regeneration Approach
Graphical Abstract
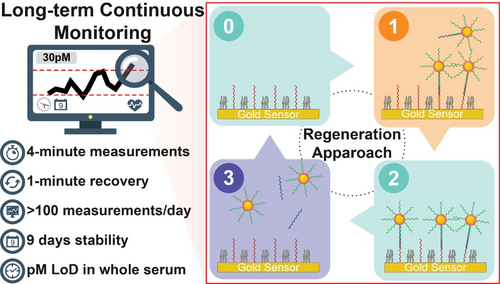
This study presents a method for long-term, continuous plasmonic biosensing of oligonucleotides with 5-minute temporal resolution by using regeneration-based reversibility approach. A picomolar limit of detection (LoD) in both buffered and serum complexes is achieved, and reliable performance for over 100 measurements per day and stability over 9 days were demonstrated.
Abstract
The demand for continuous monitoring of biochemical markers for diagnostic purposes is increasing as it overcomes the limitations of traditional intermittent measurements. This study introduces a method for long-term, continuous plasmonic biosensing of oligonucleotides with high temporal resolution. Our method is based on a regeneration-based reversibility approach that ensures rapid reversibility in less than 1 minute, allowing the sensor to fully reset after each measurement. We investigated label-free and AuNP enhancements for different dynamic ranges and sensitivities, achieving a limit of detection down to pM levels. We developed a regeneration-based reversibility approach for continuous biosensing, optimizing buffer conditions using the Taguchi method to achieve rapid, consistent reversibility, ensuring reliable performance for long-term monitoring. We detected oligonucleotides in buffered and complex solutions, including undiluted and unfiltered human serum, for up to 100 sampling cycles in a day. Moreover, we showed the long-term stability of the sensor for monitoring capabilities in buffered solutions and human serum, with minimal signal value drift and excellent sensor reversibility for up to 9 days. Our method opens the door to new prospects in continuous biosensing by providing insights beyond intermittent measurements for numerous analytical and diagnostic applications.
Introduction
Continuous biosensing technologies provide an uninterrupted window into dynamic biological processes, particularly important in demanding applications such as healthcare, environmental and food monitoring, and the pharmaceutical industry.1-3 For instance, in the pharmaceutical sector, continuous biosensing systems integrated into production lines would enable precise monitoring of key biomarkers, ensuring product quality and safety while minimizing waste and reducing production costs. Similarly, in-line water monitoring of contaminants can improve safety by providing real-time detection and response to hazardous substances, thereby protecting public health and preventing environmental damage.4
In healthcare applications, continuous biosensing promises to transform patient care by enabling early detection of critical biomarkers, facilitating prompt interventions, and improving outcomes. In intensive care and post-surgical recovery, continuous biosensing can allow medical professionals to detect early signs of complications and respond promptly, ultimately improving patient outcomes and reducing the burden on healthcare resources.2, 5-10 The advancement in healthcare, exemplified by continuous glucose sensors (CGMs)11-13 with sample measurement intervals of 5–10 minutes and long-term functionality of 7–10 days, stands as a demonstration of the potential of continuous biosensing in healthcare.14, 15 Extending this technology to monitor a broader array of biomarkers (oligonucleotides, antibodies, and proteins) opens up a multitude of possibilities, from early detection of complications to personalized treatment strategies.
Currently, quantification of important disease biomarkers like oligonucleotide and protein relies on laboratory-based techniques, such as quantitative polymerase chain reaction (qPCR) and next-generation sequencing (NGS) for oligonucleotides,16, 17 and enzyme-linked immunosorbent assays (ELISA) and western blotting for proteins.18, 19 However, qPCR requires complex sample preparation, and NGS involves intricate library preparation and lengthy data analysis. Similarly, immunoassays and western blotting necessitate substantial sample handling and preparation, leading to turnaround times of hours to days. As a result, they provide isolated data points, leading to intermittent monitoring. Such intermittent measurements may fail to capture the instances over time when the target analyte concentration surpasses critical levels that could pose a risk, as illustrated in Figure 1A. In contrast, continuous monitoring offers insight into the target's fluctuations, allowing timely intervention. To achieve continuous monitoring, the measurement time for each sample should be shorter than the fluctuation time of the target so that the dynamic changes in its concentration can be accurately recorded. This ensures high temporal resolution and trend analysis, offering insights into biomarker fluctuations and capturing intact target molecules before degradation, which current technologies struggle to track. In addition, after each measurement, the sensor must efficiently reset to the initial state and recover its capacity so that the concentration of the next sample can be accurately measured. Furthermore, the device should maintain long-term functionality so that it can undergo many measurement cycles and provide consistent results for long-term monitoring.
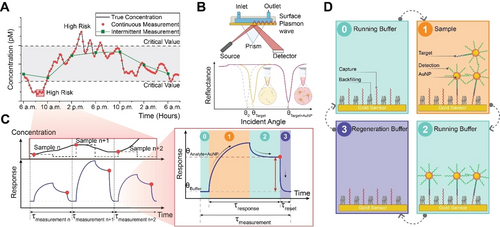
Illustration of the plasmonic continuous biosensing approach. (A) Continuous monitoring of target fluctuations allows the capture of dynamic changes in contrast to conventional biosensing, which relies on intermittent time-point measurements. (B) Detection of label-free plasmonic signal (yellow) and its amplification (red) by premixing the targets with gold nanoparticles (AuNPs). (C) Zooming on three representative sequential sampling points from panel A. For four injection stages, the corresponding time responses are shown on the right for one sampling. (D) In stage 0, the running buffer flows over the sensor surface to establish a stable baseline signal. Subsequently, during stage 1, the AuNP premixed target sample is injected. The binding of the targets to the immobilized capture leads to real-time signal changes. In stage 2, the running buffer is reintroduced to remove weak and nonspecific bindings. Finally, in stage 3, the regeneration buffer is injected to remove all of the bound targets and make the sensor ready with a fast reset time to measure the subsequent sample reliably.
In recent years, there has been a surge of innovative approaches in the domain of continuous monitoring technologies,20-24 particularly emphasizing electrochemical25-28 and optical methods.29-35 One key approach involves affinity-based dissociation assays with low-affinity capture molecules to reduce the dissociation time between the biomarkers and the capturing molecules. In contrast to high-affinity capture molecules that provide strong and long-term analyte binding in conventional bioassays, such rapid dissociation releases the captured biomarkers, making capture molecules available for newly incoming target analytes. Affinity-based dissociation bioassays have been predominantly implemented by electrochemical methods, primarily utilizing aptamers to induce structural alterations upon rapid binding and unbinding with the specific biomarker. Effective detection has been demonstrated in small molecules (e.g., drugs) and proteins within a detection range spanning from nanomolar (nM) to micromolar (μM) concentrations.25-28 In oligonucleotide-based detections, the approaches involve a reduction in the number of matching base pairs between the capture molecules and the biomarkers to lower the affinity and the bound-state lifetime. Picomolar (pM) detection ranges for oligonucleotides have been demonstrated by the Prins group through continuous monitoring of microparticle mobility under an optical microscope.31, 33, 36 For proteins, engineered antibodies with tailored single-chain variable antibody fragments, specifically designed for anti-epidermal growth factor receptor,37 were employed by Fercher. Real-time continuous biosensing in the nM range for over 11 hours was demonstrated through a Surface Plasmon Resonance (SPR).37
Despite these progresses, one of the main challenges of affinity-based dissociation bioassays is the dependence on capture molecules that should provide a delicate balance between the low-affinity for fast unbinding while maintaining a high specificity. In practice, this condition requires time-demanding and expensive capture molecule development for each target analyte. Furthermore, affinity-based dissociation bioassays in the pM to nM range often struggle to fully reset after each measurement and therefore the partial occupation of the capture molecules becomes a variable depending on previous concentrations of target, leading to inaccurate responses for subsequent measurements. Considering these challenges, it becomes beneficial to employ an approach that allows ongoing monitoring regardless of affinity, providing a more adaptable and resilient approach to biosensor applications. Overall, continuous biosensors must improve several key aspects, including (i) full reversibility after each sampling to ensure consistent measurement of target analyte concentrations, (ii) rapid sensor response time and/or reversibility time to facilitate high-frequency sampling, (iii) extended long-term operation characterized by a high number of recoveries, (iv) improved sensitivity to detect targets at low concentrations, and (iv) operation in complex matrices without dependence on high dilutions or filtered complex matrices.31
In this work, we introduce a continuous optical biosensor capable of long-term oligonucleotide monitoring over a day within a 5-minute measurement time interval and at high consistency (CV<4 %). This is enabled by our developed bioassay based on a regeneration strategy, which provides a rapid reset time of less than 1 minute and maintains full sensor capacity after each measurement. Our assay provided consistent results from 100 measurement cycles spanning a day and its stability was demonstrated over nine consecutive days. We utilized the SPR method to showcase its potential both in label-free and nanoparticle-enhanced assays, enabling low picomolar range detection of oligonucleotides. We studied regeneration conditions with quantitative metrics and a Design of Experiments (DOE) approach. Further, we investigated bioassay parameters, including limit of detection (LoD), specific-to-blank signal ratio, and dynamic range. Our approach is shown to be effective in complex environments such as undiluted and unfiltered human serum, thus providing prospects for long-term continuous monitoring of dynamic target fluctuations in clinical samples and fundamental studies.
Results and Discussion
Continuous Plasmonic Monitoring Principle
We utilized SPR to develop our continuous bioassay for long-term monitoring of oligonucleotide targets on a gold substrate. SPR measures molecular interactions by detecting changes in the refractive index near a thin metal film, typically gold, on a sensor chip. A laser excites surface plasmons at a specific angle, leading to a reduction in reflected light intensity, which changes when molecules bind to the surface. This shift in resonant angle is recorded in real-time, providing data on binding kinetics and interaction affinities, Figure 1B. For higher sensitivity, AuNPs are used to enhance the plasmonic response of the SPR (Figure 1B).
To demonstrate continuous monitoring by regeneration both for label-free and AuNP enhancement, we used a single functionalized SPR sensor connected to a flow cell (check Supporting Figure S1) that measures the varying concentration levels of the target over an extended duration with a resolution denoted as measurement time, τmeasurement, depicted in Figure 1C. This time interval includes the response time, τresponse, reset time, τreset, and idle periods for running buffer flow denoted as pre- and post-wait times (see Supporting Figure S2).
Prior to our measurements, we functionalized a bare gold sensor chip by conjugating thiolated capture molecules to it over a period of 2 hours. We then used thiolated PEG molecules as a backfilling agent to reduce nonspecific interactions. For our measurements with AuNP enhancement, we modified commercially available citrate-capped AuNPs by attaching thiolated detection molecules using a modified freeze-thaw method and backfilled them with thiolated PEGs. Detailed protocols and materials used for these procedures can be found in the experimental procedures section of the Supporting Information.
Figure 1D depicts molecular interactions in each injection stage occurring during τmeasurement. First, the system is stabilized by a running buffer in the pre-sample injection time (stage 0). After obtaining a stabilized response, the sample is introduced to the flow cell, resulting in a binding response signal at a value contingent on the target concentration (stage 1). As the sample injection stage concludes, the running buffer flows, removing weak and nonspecific binding interactions and reaching a stable value (stage 2). The sample concentration is recorded at this point for the given measurement cycle. This approach guarantees a consistent measurement environment, irrespective of the sample composition, which proves to be advantageous, especially in complex matrices like serum. Finally, the running buffer switches to the regeneration buffer that facilitates the complete dissociation of all targets while keeping the capture molecules intact. In this way, the sensor gets reset to its initial state with fast reversibility in one minute (stage 3) and is ready for the subsequent measurements for a consistent response.
Binding Analysis
We examined our continuous bioassay in label-free and AuNP-enhanced approaches to encompass concentration ranges spanning from nM to pM. The incorporation of AuNP enhancement significantly amplifies the plasmonic signal response and enables us to quantify pM amounts of oligonucleotide targets, which is often challenging with label-free. To explore the impact of AuNPs size on signal enhancement, dynamic range, and specific-to-blank binding ratio (SBR), we premixed AuNPs of different sizes functionalized with detection molecule: 20 nm, 30 nm, and 40 nm—each with an identical optical density (OD) of 0.5. Utilizing OD ensures consistency and reproducibility, as it is straightforward to measure using UV/Vis, unlike molarity and total surface area, which rely on assumptions about particle shape and aggregation. The target molecule with 15 base pair (bp) complementarity to the capture and detection molecules (15-bp) was used to ensure high-affinity binding both on the AuNP and sensor surface. Details of all the used capture, detection, and target molecules are provided in Table S1 and Supporting Figure S3. The sensor responses and the corresponding calibration curves for both the AuNP-enhanced and the label-free SPR bioassays carried out in buffer solution are shown in Figures 2A and 2B, respectively. The insets within the sensograms provide the responses at lower concentrations.
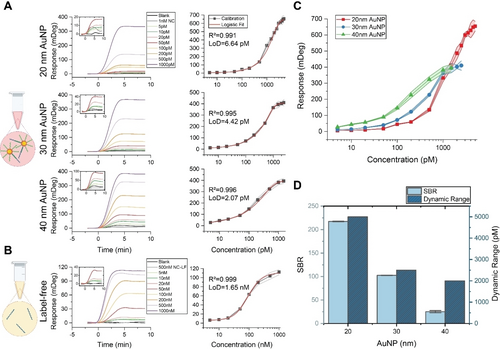
Comparative analysis of bioassays employing varying sizes of gold nanoparticles (AuNPs) and their influence on the sensitivity and dynamic range. (A) Sensograms (on the left) and calibration curves (on the right) for AuNP-enhanced bioassays employing AuNPs of 20 nm, 30 nm, and 40 nm sizes. Sensograms include blank, negative control (NC), and varying concentrations of the 15-bp target. Calibration curves are plotted using three replicates for each concentration of the 15-bp target, and a five-point logistic fit function is applied to these curves to determine the fit, with the corresponding R2 calculated for each. Additionally, the limit of detection (LoD) for each bioassay is determined. (B) Sensograms and calibration curves for label-free bioassay. Sensograms include blank, negative control for label-free bioassay (NC-LF), and varying concentrations of the 15-bp-LF target. (C) The sensor responses showcase the effect of AuNP size on the biosensor's performance. The shaded area denotes the standard deviations of the sensor responses obtained from three independent measurements. (D) Comparison of the specific-to-blank (SBR) binding levels and dynamic range using different AuNP sizes. SBR is calculated as the ratio of the signal obtained at 1000 pM to the blank signal (which includes all assay components except the target molecule) for each bioassay with varying AuNP sizes. Each SBR value is calculated using three measurements, and deviations are indicated with error bars. A higher SBR indicates a better specific signal.
For all of the studied particle sizes, injected samples containing target yielded robust responses across the spectrum of target molecule concentrations. The data also highlight a notably diminished sensor response for blank (samples without the target) and negative controls (samples with an irrelevant target) in contrast to those containing the target oligonucleotides. In stage 2 for all tested bioassays, no target dissociation was observed, indicating the strong affinity of our 15-bp targets to the capture molecules on the sensor surface.
To determine the LoD, we followed the IUPAC definition, which involves calculating three times the standard deviation of blank samples (SDblank) divided by the slope of the calibration curve within the linear range of sensor responses. The calculated standard deviations for the 20 nm, 30 nm, and 40 nm sized AuNPs were 0.88, 0.92, and 0.82mDeg, respectively. In these cases, the LoD for the AuNP-enhanced bioassays were established at 6.64 pM, 4.42 pM, and 2.07 pM, respectively. The LoD for the label-free test (1.65 nM) was around three orders of magnitude higher than that of the AuNP-enhanced studies. A detailed deviation analysis in each bioassay is depicted in Supporting Figure S4A.
To facilitate a comparative analysis of bioassays employing varying sizes of AuNPs, calibration curves are presented in a single plot in Figure 2C. Our findings demonstrate that while larger AuNP sizes exhibited a marginal improvement in both sensitivity and LoD, a notable expansion of the bioassay's dynamic range was observed with decreasing AuNP size.
Figure 2D compares SBR and dynamic range of utilized AuNP-enhanced bioassays. Across different AuNP sizes we observed similar specific responses at 1000 pM concentration (Figure 2C) with minimized blank signal. Therefore, this concentration is used for analysis in Figure 2D to facilitate comparison. Larger AuNPs exhibited a lower SBR ratio at the same OD due to higher blank signals—5.41 mDeg for 40 nm particles compared to 1.53 mDeg for 20 nm particles. In comparison to OD, maintaining metrics like molarity or total surface area consistent over different AuNP sizes would require higher OD values in larger AuNPs (see Supporting Table S2), which increases the blank signal, reducing sensitivity. Dynamic range comparison in Figure 2D shows that 20 nm AuNPs provided an extended dynamic range encompassing concentrations of up to 5000 pM, while 40 nm AuNPs resulted in saturation at 1500 pM. Therefore, in the remaining sections of this study, we used 20 nm AuNPs, as they provide a balance of dynamic range and minimal blank signal while maintaining an optimal specific-to-blank signal ratio.
Clinically important disease biomarkers include microRNA (miRNA) targets, which are short single-stranded oligonucleotides, typically 21–25 nucleotides long, that can hybridize with complementary binder probes.38-40 Numerous miRNA targets have been identified as biomarkers for conditions such as inflammation,41, 42 cardiovascular diseases,43 and cancer.44 While miRNA concentrations in certain cancers can reach nM levels,45 continuous monitoring is more relevant for rapidly developing conditions like inflammation, where miRNA levels fluctuate at fM to pM concentrations in serum.46 Given that miRNAs are found at several-fold higher concentrations in blood compared to serum, our LoD levels in AuNP-enhanced could suit the continuous detection of certain miRNAs; however, further improvements would be needed to cover physiologically significant levels.
Biosensor Reversibility for Continuous Monitoring
We investigated our regeneration-based reversibility approach to dissociate bound target molecules without compromising the integrity of the capture molecule or backfilling layer. We used the DOE methodology, specifically the Taguchi method, to design experiments to optimize our regeneration buffer.47 By systematically varying the buffer components and conditions, we identified the optimal combination that enhances regeneration efficiency. The Taguchi approach allowed us to evaluate the impact of four factors: buffer type (basic or acidic), buffer concentration, salt type, and salt concentration. These factors were tested at three different levels, and the experiments were conducted with five replicates. To evaluate the results of each experiment, we defined a regeneration impact (RI) by multiplying three parameters: baseline reversibility, analyte response consistency, and regeneration cycle stability (see Supporting Evaluation of Regeneration section). This method ensures that all parameters must perform well, as a low value in any one parameter will substantially lower the overall RI.
Figure 3A provided insights into how each factor influenced the response independently. We observed that the type and concentration of the buffer significantly affect regeneration. Specifically, the means values varied notably across different buffers: 0.7 for NaOH, 0.38 for HCl, and 0.37 for glycine. Additionally, increasing the buffer concentration decreased the means value from 0.63 to 0.305. Therefore, we chose NaOH, with its optimal concentration shifting from 10 mM in the label-free bioassay to 50 mM in the AuNP-enhanced bioassay. This shift indicates the need for a stronger regeneration buffer in AuNP-enhanced bioassays due to increased avidity (overall affinity) from multivalent interactions between the target and capture molecules (Supporting Figure S5).
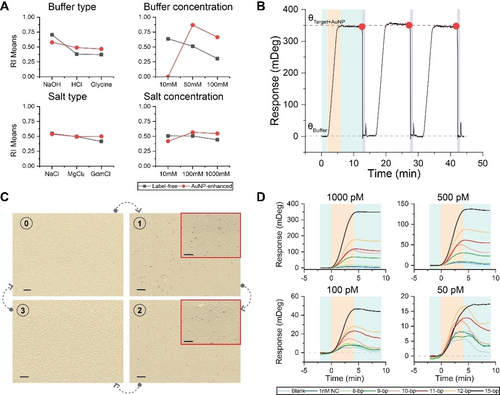
Biosensor reversibility approaches for target dissociation using regeneration and affinity-based dissociation. (A) Main effect plots, determined by the Taguchi method, for buffer type (basic or acidic), buffer concentration, salt type, and salt concentration, each evaluated at three levels, showing their influence on the regeneration. (B) A sensogram depicting the application of regeneration at 1-minute τreset during consecutive 4-minute injections of the target at a fixed concentration of 1000 pM followed by 6 minutes of buffer injection showcases the efficacy of regeneration in sustaining biosensor performance over multiple cycles. (C) Colored scanning electron microscope photographs, captured at a 54-degree tilt, for every stage. 40 nm AuNPs are used for better visibility. The scale bar for the main images is 1 micrometer, and 200 nm for the insets. (D) Sensograms of target-capture molecule interactions across varying target concentrations (50, 100, 500, and 1000 pM) with distinct complementarity profiles.
Further, different types of salts resulted in similar responses: NaCl, MgCl2, and GdmCl, each around 0.5. However, the interaction plot in Supporting Figure S6 revealed the impact of the salt combination on the regeneration. Notably, NaCl consistently yielded a higher influence when combined with NaOH. Using this insight from the interaction plot, we prioritized NaOH combined with NaCl for our optimization. We then fine-tuned the concentrations of both NaOH and NaCl in smaller increments to determine the minimal effective concentrations for both the label-free and AuNP-enhanced bioassays.
Figure 3B shows the performance of our regeneration-based reversibility approach that involves using a 1-minute regeneration step between each sample measurement. As can be seen, three repeated 4-minute injections of the same high-affinity 15-bp target at a concentration of 1000 pM resulted in consistent responses, and shortly after the initiation of the resetting stage, the signal dropped to the baseline with minimal drift. These results indicate that our approach provides full biosensor reversibility within a fixed 1-minute timeframe without compromising the functionality of capture molecules. Scanning electron microscope (SEM) analysis confirmed this success by showing clear binding events and complete regeneration of the sensor surface, as seen in Figure 3C. We illustrated the feasibility of our regeneration approach on clinically relevant oligonucleotide targets by investigating human miR-155, a biomarker associated with inflammation and cardiovascular diseases.48-51 Sensograms in Supporting Figure S7 support the suitability of our bioassay and regeneration approach at pM concentration levels of miR-155.
To compare with other continuous biosensing approaches, we studied affinity-based dissociation. This approach works well in micromolar affinities where dissociation occurs quickly, allowing the sensor to reset rapidly. However, since most biomarkers exist in significantly lower concentrations under normal physiological conditions, lower concentrations cannot be detected with these capture molecules. To our knowledge, for affinities in the picomolar to nanomolar range (pM-nM), there are no commercially available biomolecules with a dissociation rate constant, koff, of approximately 1.15E-1s−1, which is necessary for 1-minute reversibility of the sensor (see Supporting Figure S8A).
We used a variety of targets with reduced complementarity ranging from 8 to 15 base pairs to increase the dissociation rate of the target oligonucleotides from capture molecules on the sensor surface. We aimed to achieve continuous biosensing by adjusting the dissociation of targets based on their affinity for capture molecules, having dissociation times from seconds to minutes, a timeframe reported for such short oligonucleotides.52, 53 Figure 3D presents the results of varying base pairs injected over 4 minutes at four different target concentrations: 1000, 500, 100, and 50 pM.
At 1000 pM, the 15-bp sequence yielded the strongest response, with response values declining as complementarity decreased. This trend is consistent across other concentrations, indicating a reduction in plasmonic response with decreasing target complementarity for equivalent concentrations. Thereby, enhancing complementarity enhances the biosensor's capacity to detect low-pM concentrations and reduces its LoD. For all 15-bp oligonucleotide targets, there is no observable dissociation, as indicated by the nearly flat response, indicating high-affinity binding. Conversely, targets with fewer than 15-bp exhibited partial dissociation, which was more pronounced at lower concentrations, accompanied by a decrease in signal intensity. This response is mainly attributed to the shorter complementarity, which, despite increasing the dissociation rate, negatively impacts association rates, making lower concentrations indiscernible. Notably, sensor reversibility in 1 minute failed as the signal did not return to baseline, suggesting the presence of residual target molecules in a bound state after the same 5-minute buffer injection duration in our regeneration experiments. Sensograms of targets with reduced complementarities at pM concentrations are depicted in Supporting Figure S9.
Considering these residual bound molecules in the affinity-based dissociation approach, even at 8 and 9-bp targets, we conducted simulations using integrated rate equations for one-to-one interactions to check the possibility of long-term continuous monitoring using affinity-based dissociation approach without a complete reset. In our numerical analysis, we sequentially injected an identical concentration three times. The response to each injection varied depending on the previous injections (see Supporting Figure S8B). This indicates that the biosensor reading is inaccurate if the sensor does not fully return to its baseline and reset to its initial state between injections. Although this approach can track the general trend of target changes across various concentrations, its accuracy diminishes over the long-term (refer to Supporting Figure S10). Therefore, the affinity-based dissociation approach does not achieve full biosensor reversibility for pM-nM affinities within the short timeframe necessary for continuous monitoring of interactions over multiple injections.
The advantages of the regeneration approach include its ability to achieve full biosensor reversibility within a short, fixed timeframe and its reliability in removing all bound targets (regardless of affinity), thus ensuring the biosensor is ready for subsequent measurements. This method maintains the functionality of the capture molecules, enabling continuous and robust monitoring.
Temporal Resolution Control with Flow Rate
To investigate the temporal resolution of our continuous measurements, we assessed the flow rate effect on the sensor response performance and the binding time (τbind) by measuring the plasmonic signal at four different flow rates for three selected concentrations of 100 pM, 500 pM, and 1000 pM. We maintained a fixed sample volume of 200 μL while using flow rates of 50, 66.6, 100, and 200 μL/min to achieve τbind of 4, 3, 2, and 1 minute, respectively. The regeneration step was fixed at 1 minute. As presented in Figure 4, the sensograms of injections at these four flow rates indicate that increasing the flow rate reduces the τbind, thus the total measurement time. In this instance, while the τbind decreased from 4 minutes at a flow rate of 50 μL/min to 1 minute at a flow rate of 200 μL/min, it is evident that the signal intensity also decreased up to 63 %.
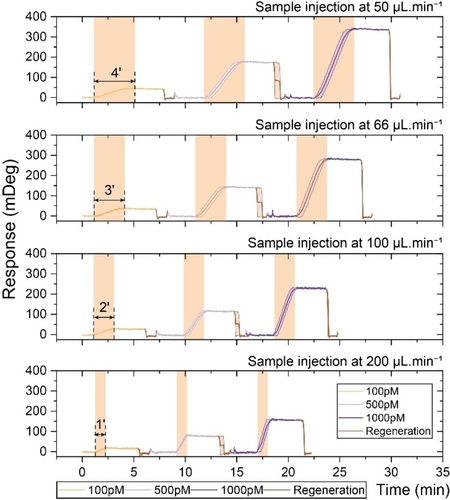
Sensogram profiles illustrate the effect of increasing flow rates on the sensor response time and signal level.
The signal exhibits a linear decrease as the flow rate increases, indicating that lower concentrations become more challenging to detect. This suggests that the sensor's detection range shifts toward higher concentrations. Moreover, if faster measurements are required, a trade-off between the flow rate and the reaction kinetics reduces the plasmonic signal intensity. For a comparison of the impact of flow rate on signal intensity across different concentrations, as well as a detailed deviation analysis at each flow rate, refer to Supporting Figure S4B.
Overall, we established all our calibration curves based on 4-minute τbind and 1-minute τreset, chosen for their short duration. However, the regeneration approach is flexible in adjusting the τbind by adjusting the flow rate to expedite the measurements for more frequent monitoring (e.g., every 2 minutes), or the waiting times can be extended for sparser monitor (e.g., every 15 minutes) without modifying calibration curves. In contrast, for affinity-based dissociation bioassays using low-affinity capture molecules, adjustment of monitoring time is limited because of the intrinsic affinity parameters of biomolecules.31, 36, 54
Long-Term Continuous Monitoring in Buffer
To assess the long-term monitoring capabilities of our approach, we subjected a sensor to a cyclic testing regimen involving the injection of five distinct target concentrations throughout a single day. We performed 100 injections, with each concentration injected 20 times. We employed a 4-minute τbind for all concentrations, followed by a 2.5-minute post-wait interval, amounting to a total τresponse of 6.5 minutes. Subsequently, the sensor was consistently restored to its initial state in a τreset of 1 minute. This ensured the minimization of fractional occupancy and enabled the detection of subsequent samples reliably and robustly after multiple injections. As illustrated in Figure 5, the sensor's response remained consistent throughout the day-long experiment. This finding emphasizes the robustness of our bioassay, which is capable of withstanding numerous regeneration cycles over an extended period without significant degradation for continuous oligonucleotide biosensing applications.
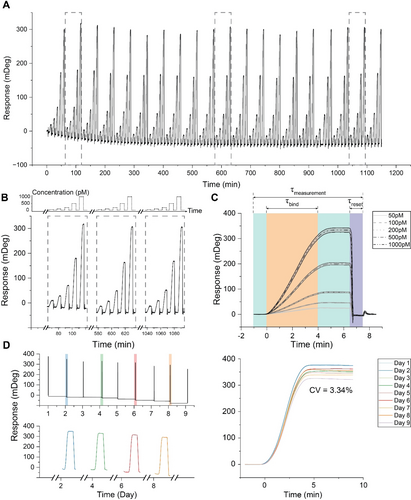
Evaluation for long-term continuous monitoring in the buffer. (A) Long-term performance is assessed by subjecting a sensor to a cyclic testing regimen in which five distinct target concentrations (50, 100, 200, 500, and 1000 pM) were injected into a buffer over the course of a single day. A total of 100 injections were performed, with each concentration being injected 20 times with a 4-minute τresponse for all concentrations, followed by a 2.5-minute post-wait interval, amounting to a total τmeasurement of 6.5 minutes. Subsequently, the sensor was consistently restored to its initial state in a τreset of only 1 minute. (B) Three distinct cycles were selected from the complete sensogram shown in panel A (highlighted in a gray dashed box) to visualize better the nearly identical responses at the same target concentrations. The top panel is a schematic representation of the injected concentrations. (C) Sensor response variability analysis, using the same-concentration injections’ averaged response and corresponding standard deviations, represented as a grey-shaded area. (D) Sensogram illustrating the daily injections of samples with a concentration of 1000 pM over a 9-day, showcasing our biosensor's high stability. The upper-left panel displays the comprehensive sensogram, whereas the lower-left panel depicts the sensogram for four selected injections (on days 2, 4, 6, and 8), excluding the intervals of inactivity between the injections. The right panel overlays the sensograms of the sensor response from the nine consecutive day measurements for easier comparison. The calculated within-day coefficient of variation (CV%) is 3.34 %.
For enhanced visualization and comparison of different cycles of target concentration sweeps, we chose three distinct cycles from the complete sensogram (Figure 5B) along with the schematic of the target concentrations (top panel in dashed lines). The sensor response for the same concentrations is almost identical, maintaining a steady baseline over a day-long measurement.
To provide a statistical comparison of all target injections, we averaged between responses of all same-concentration injections and plotted them with the corresponding standard deviation of each, as shown in Figure 5C. With increasing target concentration, we observed a higher standard deviation between each same-concentration injection; for instance, the standard deviation for 50 pM injections was 0.9 mDeg, while it was 9 mDeg for 1000 pM injections. In assessing the variability across sensor responses to different concentrations, we also checked for the CV, which showed an inverse trend compared to SD. As concentration increased, target injections showed less CV than smaller concentrations; for instance, the CV for 50 pM injections was 4 %, while it was 2 % for higher concentrations. Notably, our results align with the FDA's accepted criteria of a 20 % variation in the sensor response, indicating that the regeneration approach yielded highly consistent outcomes and it did not adversely affect the responses over a day.
We have also shown the durability and reliability of our biosensor for continuous monitoring purposes. This aspect is rather overlooked31-33, 36, 54 or discussed within a narrow temporal range, such as hours, without addressing longer durations.55, 56 To assess the stability of our biosensor, we introduced samples at a concentration of 1000 pM over 9 days while injecting a running buffer during the idle time between each injection. Figure 5D presents the sensogram encompassing all injections conducted daily. Although the baseline drifts over 9 days, the total signal values are consistent with our previously established calibration curve, manifesting an overall CV of 3.34 % within days. The analysis in Figure S4C illustrates deviations observed during continuous long-term measurements, as well as fluctuations in the stability of the bioassay over a 9-day period. This confirms the durability of our biosensor for extended continuous monitoring applications in clinical settings.
Continuous Long-Term Monitoring in Human Serum
Having identified an effective approach for continuous monitoring of oligonucleotides, we next tested its application in whole human serum samples. In contrast to measurements in buffered solution, human serum poses unique challenges due to its complex matrix with a substantial protein content. This complexity could lead to a significant increase in nonspecific interactions. To address this challenge, we introduced extra salt into undiluted and unfiltered serum samples containing considerably lower salt levels than our buffer experiments. It is important to note that the type and amount of salt are crucial factors for oligonucleotide hybridization and denaturation.57 The sensograms in Figure 6A indicate all the tested target concentrations within the human serum matrix and the calibration curve for the AuNP-enhanced bioassay. When comparing these results to the buffer experiments, we observed an improved sensitivity for lower concentrations by 55 %. However, the dynamic range has slightly decreased from 5000 pM to 3000 pM, while the LoD increases from 6.64 pM to 9.70 pM. It is worth noting that the transient effects until stabilization are more noticeable than the buffer experiments, possibly due to significant transient refractive index changes (bulk effects).58
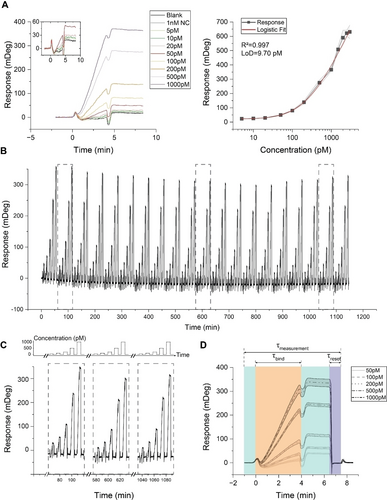
Evaluation for long-term continuous monitoring in whole human serum. (A) Sensograms (left) include blank, negative control (NC), and varying concentrations of the 15-bp target. The calibration curve (right) employing 20 nm AuNPs is plotted using three replicates for each concentration of the 15-bp target, and a 5-point logistic fit function is applied to these curves to determine the fit, with the corresponding R2 calculated for each. Additionally, the limit of detection (LoD) for each bioassay is determined. (B) Long-term performance is assessed by subjecting a sensor to a cyclic testing regimen in which five distinct target concentrations (50, 100, 200, 500, and 1000 pM) were injected into a buffer over the course of a single day. A total of 100 injections were performed, with each concentration being injected 20 times with a 4-minute τresponse for all concentrations, followed by a 2.5-minute post-wait interval, amounting to a total τmeasurement of 6.5 minutes. Subsequently, the sensor was consistently restored to its initial state in a τreset of only 1 minute. (C) Three distinct cycles were selected from the complete sensogram shown in panel A (highlighted in a gray dashed box) to visualize better the nearly identical responses at the same target concentrations. The top panel is a schematic representation of the injected concentrations. (D) Sensor response variability analysis, using the same-concentration injections’ averaged response and corresponding standard deviations, represented as a grey-shaded area.
We tested our sensor with the same parameters as the long-term evaluation in the buffer to evaluate long-term continuous monitoring capability in human serum. Figure 6B illustrates the consistent response of the sensor throughout the day-long experiment, highlighting the robustness of our bioassay. During the resetting stage, the sensor consistently returned to its original state within 1 minute, allowing for reliable detection of subsequent samples after multiple injections.
To better compare various cycles of target concentration sweeps, we present a schematic of the injected concentrations and a selection of three different cycles from the complete sensogram (Figure 6C). Similar to the buffer case, we observe a distinct baseline drift between the early and subsequent cycles. Despite this baseline shift, the sensor's response exhibits minimal total signal variation regarding identical concentrations. We depicted all injections in Figure 6D by representing each concentration's average signal intensity while illustrating the associated deviations. As the concentration levels increased, a noticeable rise in SD among injections of the same concentration was observed. For instance, after signal stabilization, the maximum standard deviation for 50 pM injections reached 2.79 mDeg, in contrast to a greater deviation of 12.82 mDeg for 1000 pM injections. However, at higher concentrations, a trend of reduced CV was evident compared to lower concentrations. For example, the CV for 50 pM injections stood at 7.68 %, decreasing to 4.76 % for 1000 pM injections. Overall, deviations were more pronounced when compared to the results from buffer experiments. Nonetheless, our findings remain consistent with the FDA's accepted criteria of a 20 % variation in sensor response. Supporting Figure S4D displays the deviation analysis at target concentrations employed in the calibration curve, as well as deviations observed over the long term.
The long-term performance of biosensors in serum is influenced by the presence of nucleases, which can degrade nucleic acids and potentially compromise sensor stability. Some studies use modifications such as phosphorothioate to inhibit nuclease degradation or employ heat-inactivated serum samples. In our work, despite using untreated human serum with unmodified oligo probes, we observed a negligible change in the stability of ssDNA probes. We attribute this to the high salt concentration (>0.5 M ionic strength) in both the running buffer and the measurement conditions, which has been shown to significantly reduce nuclease activity beyond physiological salt and pH conditions.59-61 Furthermore, the functionalization process creates a dense ssDNA layer, which provides steric hindrance and facilitates protection of the probes from nuclease access.62
Operating in the whole human serum is an important advancement for our approach, as most other optical or refractometric methods use highly diluted37 or filtered complex matrices.31, 36 Introducing a filtration step to process serum samples imposes significant limitations for continuous monitoring applications because just the centrifugation step for filtering can take 30 minutes. Furthermore, in some cases, targets are introduced into a complex matrix after filtration. However, this is not practical in real settings and also results in considerable target loss after filtration.63
Conclusion
In summary, we introduced a promising approach for long-term continuous monitoring of oligonucleotide biomarkers with a rapid binding time of 4 minutes and a sensor reversibility time of less than 1 minute. For this aim, we conducted a systematic investigation into label-free and AuNP enhancements across various dynamic ranges and sensitivities, ultimately reaching a limit of detection as low as pM levels. More importantly, we explored regeneration-based reversibility strategy for continuous biosensing, optimizing buffer conditions with the Taguchi method to ensure rapid and consistent reversibility. Further, we assessed the flow rate's influence on assay response time and signal intensity. Reliable continuous measurement is achieved with the regeneration approach, enabling fast measurement and sensor reversibility times to perform frequent measurements for capturing dynamic fluctuations in biomarker concentration. Further, our approach offers flexibility to adjust the response times according to specific biomarkers of interest by manipulation of flow rates and idle times for faster or sparser sampling. The incorporation of AuNP enhancement amplifies sensitivity, making it suitable for detecting certain blood-based miRNAs.64 However, additional sensitivity improvements are needed to measure miRNAs present at lower concentrations, such as those found in serum.46 Additionally, utilizing aptamers can extend our approach for continuous protein monitoring;65, 66 however, optimization for regeneration conditions is required due to a number of different binding modes and interaction processes between aptamers and their targets. Our approach was validated over an extended period of 9 days with minimal standard deviation.
Additionally, we demonstrated the capability to operate in undiluted human serum for a long time without additional sample treatment processes, such as filtration. Our study demonstrated the efficacy of continuous biosensing in human serum over a day. This operational period ensures the practical utility of the proposed approach for continuous monitoring in clinical and bedside settings. Additionally, recent advancements in miniaturized SPR devices are resulting in compact, point-of-care devices that can facilitate easier incorporation in bedside settings as well as other applications outside controlled clinical environments. This study presents new possibilities for continuous biosensing to gain insights that traditional single-time measurements cannot achieve and also extends real-time molecular interaction analysis capabilities.
Author Contributions
A.S. and H.A. conceived and designed the project. A.S. carried out the experiments, analyzed the data, prepared figures and wrote original draft. J.G. optimized nanoparticle conjugation. S.A., L.O.M., and P.Z. contributed valuable feedback and insights during discussions. H.A. supervised the project, secured funding, and contributed to manuscript revisions. All authors contributed to the manuscript's writing and editing.
Acknowledgments
This project has received funding from the European Union's Horizon 2020 research and innovation programme under the Marie Skłodowska-Curie grant agreement No. 955623 (H2020MSCA-CONSENSE). We would like to acknowledge the EPFL CiME facility for supporting electron microscopy. Open Access funding was provided by École Polytechnique Fédérale de Lausanne (EPFL). Open Access funding provided by École Polytechnique Fédérale de Lausanne.
Conflict of Interests
The authors declare no conflict of interest.
Open Research
Data Availability Statement
The data that support the findings of this study are available from the corresponding author upon reasonable request.


