Bottom-up Synthesis of Highly Chiral 1T Molybdenum Disulfide Nanosheets
Graphical Abstract
Chiral 1T−MoS2 nanosheets were produced via hydrothermal synthesis in the presence of tartaric acid as a chiral ligand to control mirror symmetry breaking. This novel chiral inorganic nanomaterial exhibits a chiral morphology as well as remarkably high chiroptical activity, with a g-factor of up to 0.01. The optimization of the synthetic conditions and the material's formation mechanism revealed critical details on the transfer of chirality.
Abstract
Chirality in inorganic nanostructures has recently stimulated the attention of many researchers, both to unravel fundamental questions on the origin of chirality in inorganic and hybrid materials, as well as to introduce novel promising properties that are originated by the symmetry breaking. MoS2 is one of the most investigated among the large family of layered transition metal dichalcogenides. In particular, the metastable metallic 1T−MoS2 phase is of large interest for potential applications. However, due to thermodynamic reasons, the synthesis of 1T−MoS2 phase is quite challenging. Herein, we present the first synthesis of chiral 1T−MoS2 phase which shows remarkably high chiroptical activity with a g-factor up to 0.01. Chiral 1T−MoS2 was produced using tartaric acid as a chiral ligand to induce symmetry breaking during the material's growth under hydrothermal conditions, leading to the formation of distorted hierarchical nanosheet assemblies exhibiting chiral morphology. Thorough optimization of the synthetic conditions was carried out to maximize chiroptical activity, which is strongly related to the nanostructures’ morphology. Finally, the formation mechanism of the chiral 1T−MoS2 nanosheet assemblies was investigated, focusing on the role of molecular intermediates in the growth of the nanosheets and the transfer of chirality.
Chiral nanomaterials have recently stimulated large interest due their potential applications in several technologically relevant fields, including sensing, catalysis and photonics.1-3 The development of new synthetic procedures to induce chirality in inorganic nanostructures is a challenging task, which has garnered the interest of researchers worldwide. In particular, the use of chiral ligands to passivate the surface of plasmonic and excitonic nanocrystals has shown to be an efficient technique to introduce chirality, giving rise to a plethora of inorganic nanostructures with unique chiroptical properties.2 Assemblies of small nanoparticles into chiral structures have been successfully proven to expand the chirality of the single monomeric unit into a collective behaviour.2 More complex nanostructure growth in the presence of a chiral ligand as a directing agent shows complex morphologies, hierarchical chirality and superior chiroptical properties.4-6
Molybdenum disulfide MoS2 is among the most investigated layered transition metal dichalcogenides (TMDCs) materials.7 Among the different polytypes, 1T−MoS2 is a metastable phase which has a structure formed by S−Mo−S layers of octahedrally coordinated Mo atoms in a trigonal unit cell containing a single molecular layer.8, 9 1T−MoS2 is of particular interest due to its metallic behaviour, which is especially appealing for applications in energy storage, electrocatalysis and spintronics.7, 10, 11 However, 1T−MoS2 is thermodynamically unstable compared to the semiconductor 2H polytype where the Mo atoms are found in a trigonal prismatic coordination environment.10 Due to its intrinsically lower stability, 1T−MoS2 can be produced by only few specific approaches, among which hydrothermal synthesis has proved to be a successful bottom-up technique for the large-scale production of highly stable 1T−MoS2.10, 12
In this work, we report the first synthesis of chiral 1T phase MoS2. In our approach, tartaric acid was used to control the mirror symmetry breaking during the crystallisation process of 1T−MoS2 nanosheets under hydrothermal conditions. The chiral 1T−MoS2 nanosheets show high chiroptical activity with a g-factor of up to 0.01 due to their chiral morphology. Critical detail on the effect of synthetic parameters on the material's morphology and its consequent chiroptical properties were explored, along with the material's formation mechanism, proving that this novel bottom-up approach can be efficiently used for the production of highly chiral 1T−MoS2 with tunable chirality.
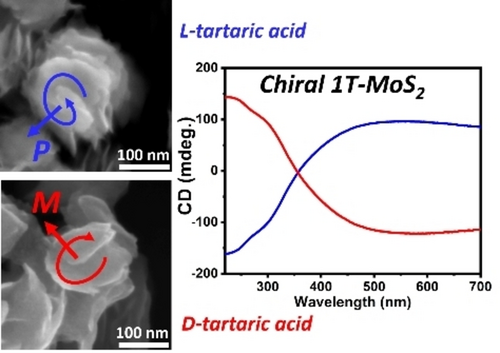
In our work chiral 1T molybdenum disulfide has been prepared by modifying the hydrothermal procedure previously developed by Liu et al.12 based on the decomposition of thiourea as a reducing agent and sulfur source (Figure 1a). In our synthesis tartaric acid was used as chiral ligand to direct the mirror symmetry breaking during the formation process and to enantioselectively produce chiral 1T−MoS2 nanostructures. The chirality of the nanomaterials has been confirmed by Circular Dichroism (CD) spectroscopy (Figure 1b).
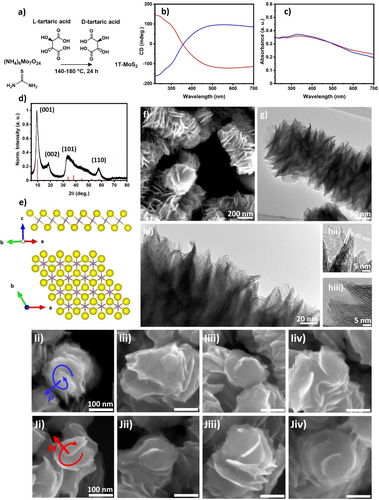
a) Schematic representation of the synthetic procedure. CD (b) and UV/Vis (c) spectra of chiral 1T−MoS2 synthetised in the presence of L (blue) and D (red) tartaric acid. d) XRD pattern of chiral 1T−MoS2 and representation of the crystallographic structure (e), reference pattern according to ICSD 254956 adapted to represent a d spacing of 0.92 nm for the (001) planes. SEM (f),TEM (g) and HR-TEM (hi–iii) images of 1T−MoS2 chiral nanosheets. High magnification SEM images of chiral 1T−MoS2 prepared in the presence of L (Ii–Iiv) and D (Ji–Jiv) tartaric acid.
1T−MoS2 phase produced after 24 h of hydrothermal treatment in the presence of 0.05 M L-tartaric acid shows a strong CD signal that covers the entire visible spectrum and corresponds to the broad UV/Vis absorption spectra (Figure 1c) which are typical of the metallic 1T phase.11 A strong positive CD band is observed at around 545 nm and two negative peaks are observed at 290 and 230 nm respectively. The opposite mirror image CD spectra was recorded for 1T−MoS2 prepared using D-tartaric acid as a chiral agent, confirming the enantioselectivity of the synthesis. In particular, the chiroptical activity of 1T MoS2 produced by bottom-up synthesis in the presence tartaric acid shows a superior CD signal with respect to previous reports on the chirality of MoS2 produced via functionalisation with chiral ligands in which chiroptical activity is often limited to the UV range.13-15 This may be related to the effect of surface localised states generated by hybridisation with the orbitals of the chiral ligand. The X-ray diffraction (XRD) pattern (Figure 1d) confirms the synthesis of 1T−MoS2, showing the characteristic (001) peak at 9.56° and the second order (002) peak at 18.6° which indicate a spacing between the MoS2 layers of around 0.92 nm.10, 12 The increase in layer spacing from 5.9 Å to 9.2 Å is ascribed to the intercalation of ammonium ions and is characteristic of 1T−MoS2 produced via hydrothermal synthesis.12, 16, 17 The peaks at 32.8° and 57.7° can be related to the (101) and (110) planes respectively. The observed diffractions match well with the reference pattern prepared using the 1T−MoS2 unit cell reported by Fang et al.16 applying and intra layer spacing of 0.92 nm to include the effect of the intercalation of ammonia molecules (Figure 1e). Moreover, the observed pattern is in good agreement with several reports on the production of 1T−MoS2 via hydrothermal synthesis.12, 18 The Raman spectrum (Figure S1) shows the expected peaks for 1T−MoS2 with the J1 band observed at 142 cm−1 and strong J2 band at 210 cm−1. The band at 350 cm−1 can be related to the combination of J3 and E2g modes and the A1g is observed at 403 cm−1.19, 20 The same spectrum can be observed for the material produced without the addition of tartaric acid, proving that the addition of the ligand does not affect the material's crystallographic phase despite the significant variation of the morphology.12 The morphology of chiral 1T−MoS2 was investigated by Scanning Electron Microscopy (SEM). The SEM image (Figure 1f) reveals the presence of twisted nanosheets, with an average lateral size of around 140 nm, forming nanorods with lengths of hundreds of nanometers. The formation of these complex hierarchical nanostructures is related to the influence of tartaric acid on the growth process of MoS2 nanocrystals under hydrothermal condition. In contrast, the material produced without the addition of tartaric acid shows the characteristic morphology dominated by isolated nanosheets with a lateral size around 200 nm (Figure S2), that is in agreement with the previous observations from Liu et al. and other reports based on similar methods.12, 18 The formation of MoS2 hierarchical nanorods was observed in the presence of multidentate ligands like citric acid and cysteine, and it was related to the directional effect of multiple hydrogen bonds.21, 22 Transmission Electron Microscopy (TEM) analysis gives further details about the material's structure. In particular, the structure of a nanorod is shown in Figure 1g, the nanorod is composed of ultrathin nanosheets of molybdenum disulfide with the number of S−Mo−S layers ranging between 5 and 10. A spacing between S−Mo−S layers of 0.95 nm can be estimated by the analysis of the diffraction fringes in the High Resolution-TEM (HR-TEM) images Figure 1hi–iii, which is consistent with the d spacing observed by the (001) diffraction in the XRD data. The comparison of the morphology of the 1T−MoS2 nanosheets synthesised in the presence of L and D-tartrate shows the presence of the same macroscopic morphology in both cases (Figure S3a,b). Moreover, the higher magnification images reveal that some of the nanosheets present an evident chiral morphology that can be related to the growth of the nanocrystals along a screw dislocation direction (Figure S3c,d), producing nanostructures with distinctive axial chirality.23 In particular, the nanosheets show a P configuration (Figure 1Ii–Iiv) when L-tartaric acid was used in the synthesis, and the opposite M enantiomer can be observed for the nanosheets grown in the presence of D-tartaric acid (Figure 1Ji–Jiv). This evidence indicates that the stereochemistry of tartaric acid is efficiently transferred to the nanocrystal morphology, controlling the symmetry breaking during the nanocrystal growth. However, most of the nanosheets do not show a clear screw dislocation despite their high chiroptical activity. This may be due to the lateral growth of nanocrystals and it is especially evident in samples prepared at lower temperature (see below). It is likely that the chirality is related to the distorted morphology of the nanosheets as previously observed for 2H−MoS2 and the screw dislocations are just the most recognisable chiral feature which can be easily observed for the samples showing higher chirality.13 Liquid-phase exfoliation in DMSO (see Supporting Information) resulted in the blue shift of the CD band to band to around 430–480 nm (Figure S4), which is related to the reduction of the nanorods’ length to 100–200 nm.
In order to understand the mechanism of the formation of chiral MoS2 nanostructures we have performed the studies of the nanostructures morphology and their chiroptical activity at different temperatures, reaction times and tartaric acid concentrations. It was found that the chirality of 1T−MoS2 is strongly dependent on the synthetic conditions; in particular, a critical effect is related to the reaction temperature (see Supporting Information: effect of the reaction temperature, Figure S5–7) and the amount of tartaric acid used in the synthesis. The chirality of 1T−MoS2 prepared using different reaction conditions was evaluated using the g-factor (see Supporting Information) calculated at the positive maximum (L enantiomer). The plot of the g-factor as a function of temperature and chiral ligand concentration (Figure 2a) highlights the effect of these parameters over the material's chirality. Especially, changes in the concentration of the chiral ligand bring about a more dramatic variation in the chiroptical activity with respect to changes in reaction temperature. Chiral 1T−MoS2 with a g-factor around 0.01 was produced using a chiral ligand concentration between 0.1 and 0.05 M. Instead, a significant reduction of the g-factor was observed when the chiral ligand concentration was reduced to 0.01 M or increased up to 0.4 M causing a reduction of the g-factor by one order of magnitude. The CD spectra of the samples produced at different ligand concentrations are shown in Figure 2b. The reduction in concentration of tartaric acid causes a red shift of the chiroptical transitions; working at 160 °C the positive peak is observed at 405, 413, 544, 597 and 612 nm for 0.4, 0.2, 0.1, 0.05 and 0.01 M respectively. XRD analysis (Figure S8) of the sample produced with different amounts of ligand confirm that 1T−MoS2 was produced under all of the investigated synthetic conditions without significant structural variations. On the other hand, a dramatic variation in the material's morphology was observed by SEM (Figure 2c,d), chiral 1T−MoS2 nanosheets prepared in high concentration of tartaric acid (0.2 M) shows a lateral size of 86±16 nm while an increase to 140±36, 148±32 and 188±22 nm were observed on reducing the ligand concentration to 0.1, 0.05 and 0.01 M respectively.
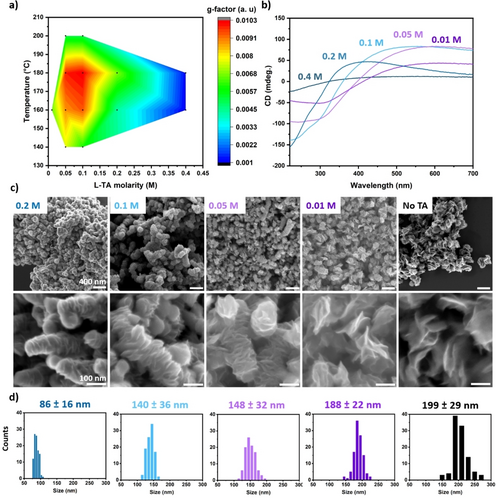
a) plot of the g-factor as a function of temperature and L-tartaric acid concentration. CD spectra b) SEM images c) and size distributions d) of 1T−MoS2 chiral nanosheets synthesised in the presence of different concentrations of L-tartaric acid at 160 °C and 24 h of reaction time.
This can be related to the effect of the ligand suppressing the lateral growth of the nanosheets by passivating the sheets’ edges on the basal plane and promoting a more dense packing along the longitudinal direction. Instead, reduction of the concentration of tartaric acid below 0.05 M reduces the length of the MoS2 nanorods with larger lateral size of 188±22 nm. Similar morphology was observed in the sample produced without the addition of ligand, which shown the presence of individual nanosheets with a lateral size of 199±29 nm. Interestingly, increasing the concentration of tartaric acid to 0.4 M causes a drastic variation in the material's morphology and the nanosheet structure is no longer observed, (Figure S9) along with a drop in the g-factor. Our investigation of the evolution of the CD signal with the reaction time (Figure 3a) reveals critical insights on the formation mechanism of the hierarchical nanostructures (Figure 3b). In particular, after the addition of the molybdenum precursor to a sub stoichiometric concentration of tartaric acid, the ammonium molybdate forms a 1 : 1 complex with the chiral ligand (complex I). This Mo(VI) complex is characterised by two main CD peaks at 297 and 250 nm, in agreement with a previous report from Cavaleiro et al.24 leaving an excess of uncoordinated molybdate during the hydrothermal process. Thiourea starts decomposing, forming first urea and then ammonia and carbon dioxide, releasing hydrogen sulfide in solution which acts as reducing agent for the molybdenum complexes as well as a source of sulfide ions.10
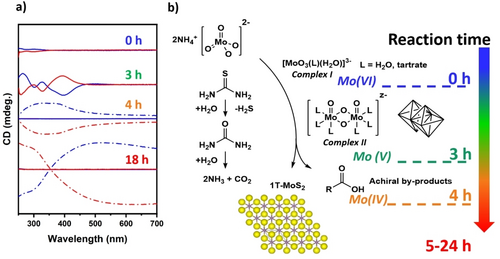
a) CD spectra of the reaction mixture in the presence of 0.05 M of L (blue) and D (red) tartaric acid at different reaction time at 180 °C, solution (solid line) and MoS2 nanoparticles (dashed line). b) representation of the formation mechanism of chiral 1T−MoS2.
After 3.0 hours reaction time, the CD spectrum is dominated by a strong signal centered at around 400 nm that can be related to a tartrate-molybdenum (V) complex (complex II).25, 26 This complex is known to have the characteristic dimeric structure where two edge sharing octahedral molybdenum atoms are connected by oxo- ligands in bridge configuration, isostructural to well characterised Mo(V) complexes with cysteine.27-29 After 4 hours of the reaction, the formation of MoS2 nanoparticles is observed; MoS2 can be isolated from the rest of the reaction mixture by centrifugation and the CD signal of the supernatant, which is indicative of the molecular species present in solution, decreases rapidly after few hours of treatment (Figure S10). This is due to the thermal decomposition of tartaric acid around 160 °C forming achiral by-products such as formic acid, acetic acid, pyruvic acid.30 Despite the decomposition of the chiral ligand in this early stage of the reaction, the MoS2 isolated in this condition is characterised by a smaller particle size (Figure S11) and lower chiroptical activity comparing to the products isolated at longer reaction times. At this reaction stage, the MoS2 nanocrystals grow consuming the excess of molybdate which is still present in solution. SEM analysis (Figure S11) revealed the presence of thin nanorods with lateral size around 50 nm at 4 hours, a longer reaction time increases the lateral size of the nanosheets. This is followed by an increase in chirality, which can be related to the epitaxial deposition of MoS2 onto the chiral nanocrystals formed in the first stage of the reaction, which act as chiral seeds. The observation of the chiroptical activity after extensive reaction time (up to 48 h) suggests that the nanomaterial's chirality is mostly unaffected by treatment longer then 24 h (Figure S12).
In conclusion, herein we presented for the first time a new synthetic approach for the preparation of highly chiral 1T−MoS2 nanosheets. The use of tartaric acid as symmetry breaking agent in the hydrothermal synthesis of 1T−MoS2 nanosheets was shown to efficiently promote the formation of highly chiroptically active 1T−MoS2 with a g-factor up to 0.01. The chiral ligand plays an important role as a structural directing agent during the growth of the nanocrystals in the hydrothermal process, allowing control of the nanomaterial's chirality. Interestingly, the chiroptical properties of the material revealed a strong dependence on the nanostructure's morphology, and the highest chiroptical activity was observed for nanostructures showing a well-defined axial chirality. In these conditions, the enantioselective formation of P and M enantiomers can be observed for 1T−MoS2 nanosheets grown in the presence of L and D-tartaric acid respectively. Finally, we reported our observations on the evolution of the chirality during the material's formation and details of the involvement of chiral complexes in the formation process. We believe that this research will promote further development of novel chiral layered TMDCs based nanomaterials with superior chiroptical activity and a broad range of potential applications.
Supporting Information
The authors have cited additional references within the Supporting Information.31, 32
Acknowledgments
The authors gratefully acknowledge the Science Foundation Ireland, SFI (project: SFI-20/FFP-A/8904) and the SFI Bioeconomy Research Centre, Biorbic (project: SFI 16/RC/3889) for financial support. Microscopy characterisation and analysis were performed at the CRANN Advanced Microscopy Laboratory (AML). Open Access funding provided by IReL.
Conflict of Interests
The authors declare no conflict of interest.
Open Research
Data Availability Statement
The data that support the findings of this study are available on request from the corresponding author. The data are not publicly available due to privacy or ethical restrictions.


