Millimeter-Wave WISP Search with Coherent Light-Shining-Through-a-Wall Toward the STAX Project
Abstract
A dark photon is one of the simplest extensions of the Standard Model of particle physics and can be a dark matter candidate. Dark photons kinetically mix with ordinary photons. The mass range from 10−4 to 10−3 eV of such dark photons is underconstrained by laboratory-based experiments and a new search is therefore motivated. In this mass range, dark photons behave like waves rather than particles and the corresponding electromagnetic waves are in the millimeter-wave range. The technical difficulties of the millimeter waves have prevented so far dark photon experiments in this mass range. The use of coherent millimeter waves to search for dark photons in a Light-Shining-through-a-Wall (LSW) experiment is proposed. The merits and limitations of coherent wave detection are clarified and the potential of single photon sensors at microwaves is investigated. Development of millimeter-wave technology is not only limited to dark photons. Technically, an experiment for dark photons by using electromagnetic waves resembles that for axions, another light dark matter candidate, with static magnetic fields. This paper represents an essential step toward axion LSW in the millimeter-wave range (Sub-THz-AXion experiment; STAX) as a potential successor of an on-going experiment in infrared.
1 Introduction
The discovery of the Higgs boson in 2012 [1, 2] was a major milestone and a confirmation of the Standard Model (SM) of particle physics. Despite its success, the investigation of extensions to the SM continues to be a highly compelling area of research within the field of particle physics. One possibility is the existence of a dark sector containing new particles that do not have gauge interactions with the known particles in the SM.[3-5] These new particles could include scalars, pseudoscalars, and sterile neutrinos. One example of a new particle is the so-called dark photon,[6] a hypothetical particle that would couple to the SM photon via kinetic mixing. However, there is currently no experimental evidence for these new particles.
Astronomical observations[7-9] suggest that the Universe is filled with dark matter interacting with ordinary matter only through gravity. Beyond-the-Standard-Model particles could explain the dark matter puzzle. Among these particles, there are dark photons. This work aims to search for dark photons in a mass range from 10−4 to 10−3 eV with a Light-Shining-through-a-Wall (LSW) experiment that is free from systematic uncertainties in astronomical observations. This mass range has not been well constrained[10, 11] by previous laboratory-based experiments due to technical difficulties in millimeter waves. We use a coherent wave detection method, as opposed to photon counting detectors, as these have a better energy resolution within this mass range. While this technique is not novel, its application in particle physics experiments has been limited. The LSW experiment enables strong temporal coherency in dark photon unlike astronomical dark photons.
In LSW experiments, the advantage of the coherent wave detection was recognized rather recently in the infrared laser experiment (Any Light Particle Search II; ALPSII).[12-14] In this work, we show the feasibility of the coherent detection technique for the search of dark photons in the millimeter-wave range. Although a similar concept was verified at 1–3 GHz,[15-17] an experiment at 30 GHz is novel. Note that microwave technology is not just naively scaled in this frequency range.
In the next section, we develop a theory of LSW for dark photons at 30 GHz. We describe the quantum coherent states and their implication in particle counting and classical wave detection. After that, we show the results of proof-of-concept experiments. Future prospects include the discovery potential of this method and revisit the fundamental limitation of coherent wave detection. We briefly mention the larger scale experiment for axions in the future (Sub-THz-AXion search; STAX). The last section is dedicated to concluding remarks.
2 Theory of Coherent Dark Photon Detection
2.1 Classical Theory of Dark Photons and the LSW Experiment
Equations (1) and (2) lead to photon–dark-photon oscillations because their mass eigenstates are rotated from that of U(1) gauges. Quantum oscillation of this kind can be tested by preparing one of the states and observing the same state at some distance, as is done in neutral meson oscillation[20] and neutrino oscillation experiments.[21] In the case of dark photon physics, one needs to prepare very intense photon fields confined in a bounded space, such as a resonant cavity, so that due to photon–dark-photon oscillation, some of the initial photons may be converted to the dark photons and leak through the boundary of the photon field. Reconverted photons may be detected by a very sensitive photon sensor or wave detector. This is the working principle of LSW experiments.
The LSW technique has pros and cons compared to direct searches for dark matter dark photons. An advantage is that one can be free from astrophysical uncertainties in the dark matter density and model dependence in their coherency. In principle, LSW depends only on an equation of motion of dark photons (Equation (1)). One can fix the strength of the source field and experimentally define the coherency of dark photons. However, in LSW experiments, the conversion happens twice, that is, a photon to a dark photon and a dark photon to a photon, so that the sensitivity of the search is reduced by χ4. [22] Also, one needs to handle purely electromagnetic leakage of photons (cross-talk) without dark photon conversion. Therefore, small signal detection and background reduction are more challenging than dark matter searches.
The concepts of a photon as a particle and as an electromagnetic wave have been conflated thus far. Consequently, the question arises as to how the classical wave equations, as represented by Equations (1) and (2), can be interpreted within the framework of a quantized field. To establish the validity of classical formalism, it is necessary to introduce the coherent state, a well-established concept in quantum optics. This will enable us to better understand the relationship between classical wave equations and quantized fields and further clarify the nature of photons as both particles and waves.
2.2 Coherent State and Classical Waves
2.3 Phase Lock and Relative Temporal Coherency
A coherent state is a very good model of photon fields from lasers in the range of optical frequencies and a chain of a signal generator and amplifiers in a microwave circuit. An ideal relative temporal coherency can be achieved with the phase-locking method. Figure 1 shows a schematic of the phase-locking mechanism. The quantum states of a generator and a detector are visualized on axes that represent two independent classical amplitudes of and components. In free-running operation of these two devices, an expectation value of each photon field, the center of the small circles, independently rotates along the circle with a constant radius . This phase shift corresponds to thermal drift of internal reference quartz oscillators in each microwave device; therefore, it is a classical phenomenon. Here, the fundamental quantum fluctuation is shown as a small circle around the expectation value. In Appendix B, we summarize how the wave detection works on the coherent states. We disregard potential squeezing of the quantum states in this paper for simplicity.
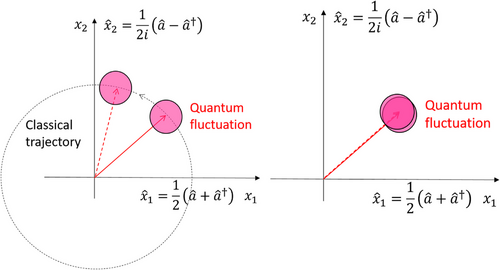
By introducing a phase lock between the generator and the detector, the relative phase shift between them can be strongly reduced. Consequently, the expected signal becomes artificially a δ-function. Since the major background events are white noise from black body radiation and Johnson–Nyquist noise, the signal-to-noise ratio can be dramatically improved. This phase locking can be implemented naturally by the standard 10 MHz reference line in a microwave measurement equipment.
Importantly, the quantum field of dark photons is assumed to almost perfectly preserve the same coherency as the photon fields.[25] This is implied by the coupled classical wave equations, Equations (1) and (2). Quantum mechanically, this description simply influences only the expectation values of field operators. The propagation of dark photons with uncertain mass introduces a small decoherence and the frequency distribution is smeared from the δ-function.[16] Moreover, it is possible that the electric noise within the phase-locking circuit at high frequencies of up to 30 GHz determines the narrowest bandwidth. Consequently, prior to developing a setup for the search of dark photons, experimental validation is crucial.
3 Validation of Coherent Wave Detection Scheme at 30 GHz
- 1.
Coherent millimeter-wave system at higher frequency 30 GHz
- 2.
Quasi-optical oversize resonators at 30 GHz instead of conventional resonant cavities near the fundamental mode
3.1 Relative Temporal Coherency of the Signal
We performed a simple experiment to test the idea of relative coherency at 30 GHz.[26] We used a real-time spectrum analyzer (FSW43; R&S)[27] and a digital signal generator (SMB100A; R&S) located in the THz laboratory at the Karlsruhe Research Accelerator (KARA).[28] Figure 2 shows the experimental setup. The high-quality 10 MHz reference is provided by the facility. The signal generator is phase locked to this reference. The 30 GHz output from the signal generator is fed into the analyzer. The analyzer is phase locked to a 10 MHz signal through a waveform generator (Keysight; 33521A) to add artificial phase noise or offset to the reference. The waveform generator was connected to the reference line of the signal generator instead when the generator's response was tested.
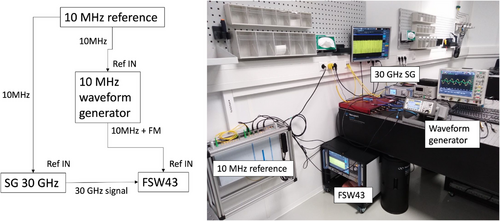
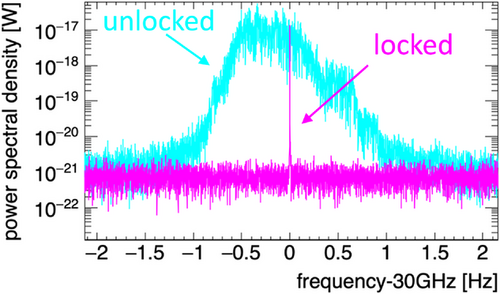
Figure 3 compares the 30 GHz signal integrated over 5240 s with and without the common 10 MHz reference. Note that an offset of 55 Hz out of 30 GHz on the unlocked case is manually corrected in the plot. The data clearly show that the classical drift of the individual devices is corrected and δ-function-like relative coherence is achieved, just as illustrated by Figure 1. After integrating the data over 5240 s, we achieved the resolution bandwidth (RBW) of 169 µHz and the signal bandwidth was within one bin of it with a marginal side-band three orders of magnitude lower than the center signal at 30 GHz. This argument is valid up to the integration time of the relative coherent time of the setup. In this work, we did not observe a practical limit of tco up to 5240 s.
3.2 Narrow-Band Filtering of Thermal Noise
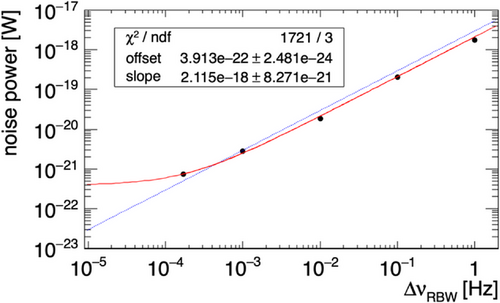
Figure 4 shows the noise power, which is an average of the white noise baseline in Figure 3 as a function of . This result demonstrated the successful narrow-band filtering at 30 GHz and also revealed the limitation of the present setup. The noise power followed the prediction of Equation (11) and started to deviate below 100 µHz. We found that the noise filtering was saturated at W. In conclusion, the narrow-band filtering scheme of the present setup reduced the noise power from W to W. Importantly, this noise power, dominated by the spectrum analyzer, can be further reduced by a low-noise amplifier (LNA) chain.
4 Future Prospect
4.1 Setup of the Lower-Power Experiment at 300 K

The above argument is justified if cross-talks of 30 GHz are sufficiently suppressed. The resonator and the LNA chain must be installed inside a electromagnetic shield in order to avoid cross-talk from the generator side. A nearly perfect electromagnetic shield is realized by avoiding the use of any coaxial feedthroughs because such feedthroughs are transparent to broadband RF. Instead, DC electric power for the LNA and the RF signal can be transported by an optical fiber system. A fiber requires a small hole, not coaxial, and such a hole can be at the signal frequency below cut-off. With this technique, a shielding efficiency of nearly −300 dB was achieved in the CROWS experiment[17] at 1–3 GHz. Since the cut-off diameter is just scaled down by the frequency, a similar shielding for 30 GHz is also feasible.
4.2 Potential of a High-Power Experiment
The phase locking between a photon generator, that is, oscillator, and a wave detector, is key for this project. In the low-power experiment, phase locking is straightforward with the standard 10 MHz line connected to a signal generator at 30 GHz. The linear amplifier introduces phase noise and adds nonlinear distortions in the signal that appear as side bands but is not significant to our experiment. However, in order to increase the search sensitivity to higher power, we face technical challenges. Solid-state amplifiers above 30 GHz are commercially available up to 200 W today. This provides an improvement of a factor of 10 in the number of photons from the low-power setup with a 20 W amplifier described in Section 4.1. Since the total conversion efficiency from a photon to a dark photon and back to a photon is proportional to χ4, the sensitivity of the search is improved by only .
- 1.
Amplifiers: klystrons, gyro-klystrons, gyro-TWT
- 2.
Oscillators: backward wave oscillator (BWO), gyrotrons, gyro-BWO
The oscillators listed above have been developed for continuous wave (CW) applications. In particular, gyrotrons can provide the highest average power in this frequency range. A gyrotron is a coherent oscillator of millimeter waves based on the cyclotron maser resonance. Since the cyclotron maser resonance is stable in CW operation, most typical gyrotrons are in CW operation or long pulsed operation. The state-of-the-art gyrotrons[31] can generate 1 MW CW power at up to 170 GHz for half an hour and such 24 gyrotrons' outputs are combined to heat up the plasma in the future fusion reactor ITER. In KIT, an R&D gyrotron is available at 28 GHz and can generate 20 kW CW for more than 1 h.[32] In terms of the number of photons for dark photon searches, gyrotrons are the most promising option.
An issue for gyrotrons has been their somewhat limited temporal coherency. In a typical free-running gyrotron at 200 GHz, the signal bandwidth has been around 1 MHz ().[33] This gives an amazingly good coherency at this frequency range. However, this excellent coherency is still not sufficient for the coherent dark photon search.
In order to overcome the limitation in coherency, phase-locked gyrotrons have been developed. In a gyrotron, the electron beam for the cyclotron maser resonance is emitted from a magnetron injection gun. This electron gun is either a diode or triode to properly accelerate and guide electrons to the center of a gyrotron cavity. By adding phase-lock control in the high-voltage power supply of either the cathode or the modulation anode, the output frequency can be dramatically stabilized. A recent study achieved 1 Hz absolute signal bandwidth for a 170 GHz and 25 kW gyrotron.[34] Locking the phase-lock circuit to the common reference of the FFT analyzer is a promising way to achieve excellent relative temporal coherence for the dark photon search.
4.3 Potential of Single Photon Counting
Eventually, photon counting sensors may come into the game even in the LSW experiments. Appendix C summarises previous arguments in dark matter search. From Equation (C4), for any , noise power of single photon sensors surpasses the linear amplifier's noise if everything including a detection cavity is cooled down below 50 mK. Although linear amplifiers cannot improve their noise power below even if their physical temperature goes down, the noise level of the photon sensor is exponentially improved by cooling down because blackbody radiation is dramatically suppressed. This picture is only valid if the dark counts of the photon sensor is dominated by blackbody radiation. Development of a single photon calorimeter around 30 GHz is a technically challenging task. In the National Enterprise for nanoScience and nanoTechnology (NEST) in Pisa, a Josephson Escape Sensor has been developed.[35] This sensor is based on a phase state in a nano-wire Josephson junction under bias current and behaves as a very sensitive transition edge sensor[36] in case of absorbing a microwave photon. The noise equivalent power is expected to be 10−25 W −1 at 20 mK. The next step is to demonstrate this noise level by injecting a very weak microwave signal into a sensor placed inside a dilution refrigerator. Successful implementation would lead to beyond the state-of-the-art detection of microwave photons in this frequency range.
4.4 Predicted Exclusion Limits of Dark Photons
Figure 6 compares the expected exclusion limits (2σ) of several stages in the proposed dark photon search compared to the existing constraints.[37, 38]
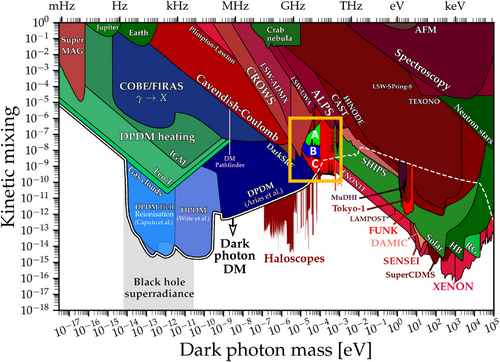
- Stage A: Low-power search This stage uses the low-power experiment described in Section 4.1. With a commercially available amplifier of W, two Fabry–Perot resonators with field enhancement factor , LNA of noise temperature K, we will search the region A (Figure 6) after data acquisition of 1.5 h corresponding to Hz. Note that three experiments of different resonator lengths ( 180, 200, 220 mm) are combined to avoid the zeros in Equation (18). Thus, the total experimental time will be a few days.
- Stage B: High-power search This stage is the experiment with the phase-locked gyrotron at KIT described in Section 4.2. Instead of using a commercial amplifier, we consider kW from this 28 GHz gyrotron. The other conditions are the same as the low-power search. Cooling down the emitting resonator, which is exposed to 20 kW microwaves, is a challenge. In a similar Fabry–Perot resonator of 200 GHz, one of the authors handled 1 kW with water cooling.[33] It is also known that 352 MHz microwaves of 16 kW averaged power can be damped into a relatively compact water-cooled load.
- Stage C: Single photon at higher frequency This stage is the most challenging option with the single photon detector described in Section 4.3 combined with the 1 MW gyrotron (Section 4.2) for ITER, where the ultimate coherency is not necessarily implemented because photon counting is anyway inherently incoherent. The data acquisition time is 3 min determined by the power supply for the 1 MW-class gyrotron at KIT. Since it is not realistic to cool down the emitter resonator exposed to 1 MW power, the Fabry–Perot resonator at the emitter side will be omitted and a travelling wave in a corrugated waveguide will be installed. The detector side, including the resonator, must be cooled to below 100 mK for the operation of the single-photon detector. We also consider the use of a sapphire-based Fabry–Perot resonator that can provide field enhancement of 106 in a cryogenic condition for high-frequency microwaves.
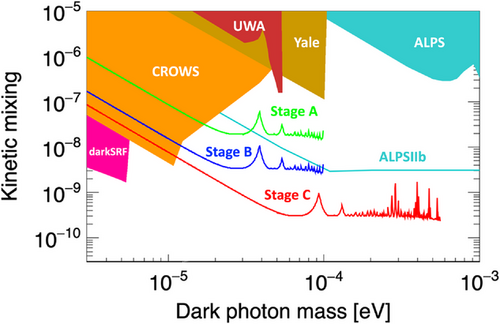
Since this work aims at a new LSW in the parameter range which is complementary to other similar experiments, Figure 7 shows the enlarged view of LSW constraints and our projections. CROWS,[17] UWA,[39, 40] and Yale[41] are LSW searches with normal conducting RF cavities. Similar limits with superconducting resonators are indicated as darkSRF.[42] ALPS [43] shows the previous limit of laser LSW while ALPSIIb [44] is a predicted limit from the upgraded experiment on-going at DESY with infrared lasers and 100 m resonators. Importantly, even a low-power experiment in Stage A can address the region complementary to the ALPSIIb experiment. This is because the frequency of this experiment is four orders of magnitude lower than that of ALPSIIb. Even if the size of the experiment is different, which is 100 m in ALPSIIb while only 20 cm in this proposal, the use of a different frequency provides a unique opportunity in dark photon physics. The future haloscope will be operated in the same frequency range as this proposal but is in principle and in practice complementary to the LSW experiments due to the assumption on dark matter in our galaxy. Moreover, LSW and haloscope will have technical synergy on the use of millimeter waves.
4.5 Sub-THz-AXion (STAX) Search
Once the dark photon search is successfully implemented, axion searches may be performed by adding a dipole magnetic field to the resonators. The STAX project is a future project of this kind[45] and this paper gives a prototype of it (proto-STAX). We develop a single photon sensor in Section 4.3 and the 1 MW gyrotron (Section 4.2) and install the system into superconducting dipole magnets. We are preliminarily considering the use of two of the Nb3Sn dipoles being developed for the HL-LHC project at CERN. This magnet will provide an 11 T dipole field inside 60 cm of the magnet bore where the conversion resonators will be placed. Since the bore is smaller than the diffraction scale of millimeter waves, we employ Fabry–Perot resonators covered with a corrugated waveguide. This technique has been developed for the microwave undulator[46] and the application to axion searches is straightforward. The STAX project is one of the potential successors of the ALPSII experiment. We need to note that 1 MW power handling will be a significant technical challenge of this project.
5 Conclusion
We proposed a new dark photon search in the mass range around 10−4 to 10−3 eV by using the LSW technique around 30 GHz. Wave detection and photon counting are critically compared with respect to the advantage of coherent LSW. The key is to introduce the quantum coherent state that justifies the semi-classical treatment of photon–dark-photon oscillation. In a simple setup of a signal generator and a real-time spectrum analyzer, an excellent relative temporal coherence at 30 GHz was achieved by using the common 10 MHz reference line. With such a signal coherency, we showed that the thermal noise background can be filtered out with a RBW narrower than 1 Hz. This was achieved by FFT of the waveform over a period longer than 1 s. We successfully filter that noise power by four orders of magnitude with a narrowest RBW of 169 Hz. We revealed a limitation of noise filtering below this bandwidth probably because of a limited accuracy of the inner circuits of the device. With the noise filtering and signal coherency demonstrated in this work, we can address the mass region of dark photons that is complementary to other projects by just using commercial amplifiers. Further improvement is feasible with the recently developed phased-locked gyrotrons that are a promising option toward high-power coherent searches of dark photons. Although coherency is the huge advantage of this proposal as the initial stage of this project at 30 GHz, photon counting will surpass the wave detection technique of any coherency in the future because the coherent wave detection is ultimately limited by the SQL, and narrow-band filtering showed some limitation around 100 Hz. The development of single photon sensors is on-going by using the nano-wire Josephson junction. The successful implementation of a dark photon experiment would lead to the future axion project STAX as a successor of infrared axion search of today.
Acknowledgements
This work was supported by the KIT International Excellence Fellowships Program with funds granted to the University of Excellence concept of Karlsruhe Institute of Technology. The authors would like to thank A. J. Millar and S. Albright for useful discussions.
Conflict of Interest
The authors declare no conflict of interest.
Appendix A: Particle Counting
Appendix B: Wave Detection
The wave detection of a coherent state is well established and is the same as for classical waves even in the sub-quantum regime.[48] A system composed of an antenna, linear amplifiers, superheterodyne mixers, and analog-to-digital converter (ADC) directly takes the expectation value of and the consequence is Equation (6). Here, the wave amplitude, or more explicitly, voltage and phase information is taken from the quantum system. If the signal is monochromatic, integration over periods improves the signal-to-noise ratio. This is a classical description of measuring the expectation value of electric field operators from a coherent state.
Appendix C: Coherency of Dark Photons Search
This conclusion needs to be reconsidered for dark photons generated in LSW. Unlike dark matter searches, one can enhance the temporal coherency or even lock the phase of the signal, and consequently, the signal can be much higher than that of dark matter (106). In this case, Equation (C1) leads to very low Pl. Therefore, the cross-over point in Equation (C4) can be at even higher frequency (≫10 GHz) and even lower temperature (≪100 mK) than the case of dark matter dark photons. Implementation of single photon sensors is not justified for LSW until one researches this technically challenging cross-over point.
Open Research
Data Availability Statement
The data that support the findings of this study are available from the corresponding author upon reasonable request.


