Overlapping trisomies for human chromosome 21 orthologs produce similar effects on skull and brain morphology of Dp(16)1Yey and Ts65Dn mice
Abstract
Trisomy 21 results in gene-dosage imbalance during embryogenesis and throughout life, ultimately causing multiple anomalies that contribute to the clinical manifestations of Down syndrome. Down syndrome is associated with manifestations of variable severity (e.g., heart anomalies, reduced growth, dental anomalies, shortened life-span). Craniofacial dysmorphology and cognitive dysfunction are consistently observed in all people with Down syndrome. Mouse models are useful for studying the effects of gene-dosage imbalance on development. We investigated quantitative changes in the skull and brain of the Dp(16)1Yey Down syndrome mouse model and compared these mice to Ts65Dn and Ts1Cje mouse models. Three-dimensional micro-computed tomography images of Dp(16)1Yey and euploid mouse crania were morphometrically evaluated. Cerebellar cross-sectional area, Purkinje cell linear density, and granule cell density were evaluated relative to euploid littermates. Skulls of Dp(16)1Yey and Ts65Dn mice displayed similar changes in craniofacial morphology relative to their respective euploid littermates. Trisomy-based differences in brain morphology were also similar in Dp(16)1Yey and Ts65Dn mice. These results validate examination of the genetic basis for craniofacial and brain phenotypes in Dp(16)1Yey mice and suggest that they, like Ts65Dn mice, are valuable tools for modeling the effects of trisomy 21 on development. © 2014 Wiley Periodicals, Inc.
INTRODUCTION
Down syndrome (DS) is caused by trisomy 21 and is the most common live-born human aneuploidy (1:319–1:1,000 live-births) [Wiseman et al., 2009]. Trisomy 21 results in dosage imbalance for hundreds of genes located on human chromosome 21 (HSA21), with concomitant gene regulatory changes that affect numerous aspects of development and function. Individuals with DS always show some degree of intellectual disability, reduced cerebellar volume, and granule cell density, and dysmorphic facial features [Kisling, 1966; Epstein et al., 1985; Aylward et al., 1997a,b]. The processes by which gene dosage imbalance produces these features are not well understood, in part because many of the affected biological systems cannot be directly tested in humans. Genetically engineered mouse models are useful for elucidating the effects of gene-dosage imbalance on development and can contribute to therapies that ameliorate the effects of trisomy 21 [Richtsmeier et al., 2000; Gardiner, 2010; Gardiner et al., 2010].
The mouse orthologs of genes on HSA21 are found on mouse chromosomes (Mmu) Mmu10, Mmu16, and Mmu17 [Rueda et al., 2012]. A number of DS mouse models have segmental trisomy for portions of these chromosomes that have conserved synteny with HSA21 [Das and Reeves, 2011]. In the Ts65Dn mouse model, an additional chromosome contains the distal end of Mmu16 translocated close to the Mmu17 centromere [Davisson et al., 1993; Reeves et al., 1995]. This portion of Mmu16 contains a 15.6 Mb region of conserved synteny with HSA21, from MRPL39 to ZFP295. Several genes whose orthologs are not found on HSA21, beginning at the centromere of Mmu17 and ending between Synj2 and Pde10a, are also triplicated in Ts65Dn [Duchon et al., 2011; Reinholdt et al., 2011]. There is no direct information about possible contributions of these genes to Ts65Dn mouse phenotypes.
The Ts65Dn mouse models a number of DS manifestations. For example, deficiencies in bone formation [Parsons et al., 2007; Blazek et al., 2011]; brachycephaly, reduced facial, and cranial vault dimensions [Richtsmeier et al., 2000, 2002; Hill et al., 2007], and reduced cerebellar volume and granule cell density [Baxter et al., 2000] have been found in humans with DS and in Ts65Dn mice. Additionally, effects on hippocampal-based behaviors [Reeves et al., 1995; Pennington et al., 2003], occurrence of hematopoietic disease in the presence of GATA1 mutations [Crispino, 2005], and many similar effects on gene expression levels [Gardiner et al., 2003] have been discovered in people with DS and in Ts65Dn mice.
Ts65Dn mice have been compared to other DS mouse models that are trisomic for subsets of the regions of conserved synteny with HSA21to assess phenotypic differences and identify genes involved in the pathogenesis of DS. Ts1Cje mice are trisomic for about 67% of the genes that are trisomic in Ts65Dn mice (Table I) [Sago et al., 1998; Duchon et al., 2011] and have a milder phenotype than Ts65Dn mice. Specifically, Ts1Cje mice demonstrate a generalized global reduction in craniofacial size [Richtsmeier et al., 2002] and a small cerebellum [Olson et al., 2004]. In contrast to Ts65Dn mice, Ts1Cje mice have normal linear Purkinje cell density and cerebellar granule cell density relative to euploid littermates [Olson et al., 2004].
| Homologene Genes | miRBase miRNA | Total | |||||
|---|---|---|---|---|---|---|---|
| All | KRTAP | ORF | RIKEN | Predicted | |||
| Ts65Dn | |||||||
| Mmu16 region of conserved synteny | |||||||
| Mouse | 104 | 13 | — | 6 | 0 | 4 | 108 |
| Human | 116 | 26 | 2 | — | — | 9 | 125 |
| Homologous in mouse | 98 | 11 | — | 4 | — | 2 | 100 |
| Mmu17 triplicated region | |||||||
| Mouse | 41 | 0 | — | 1 | 2 | 1 | 42 |
| Homologous in mouse | 39 | 0 | — | 1 | 1 | 0 | 39 |
| Homologous in humans (HSA6 & HSA15) | 33a | 0 | 1 | — | — | 0 | 33 |
| Dp(16)1Yey | |||||||
| Mmu16 region of conserved synteny | |||||||
| Mouse | 116 | 13 | — | 6 | 0 | 7 | 123 |
| Human | 128 | 26 | 3 | — | — | 14 | 142 |
| Homologous in Mouse | 110 | 11 | — | 4 | — | 5 | 115 |
| Ts1Cje | |||||||
| Mmu16 region of conserved synteny | |||||||
| Mouse | 68 | 0 | — | 3 | 0 | 3 | 71 |
| Human | 71 | 0 | 2 | — | — | 6 | 77 |
| Homologous in Mouse | 66 | 0 | — | 2 | 0 | 1 | 67 |
| Mmu12 monosomic region | |||||||
| Mouse | 7 | 0 | — | 0 | 0 | 0 | 7 |
| Homologous in Mouse | 7 | 0 | — | 0 | 0 | 0 | 7 |
| Homologous in Humans (HSA7) | 7 | 0 | 0 | — | — | 0 | 7 |
- a Mmu17 contains multiple copies of some genes that occur once in humans (Table SIII).
The Dp(16)1Yey DS mouse model developed by Li et al. [2007] has a 22.9 Mb direct duplication of the entire Mmu16 region that is in conserved synteny with HSA21. Unlike Ts65Dn mice, Dp(16)1Yey mice only carry triplicated regions that are in conserved synteny with HSA21 [Li et al., 2007; Duchon et al., 2011] and thus better represent the gene dosage imbalance found in humans with DS.
When present in three copies, trisomic murine genes that are orthologous to HSA21 genes are expected to similarly affect conserved genetic pathways and thereby provide a genetic model of human DS. The purpose of this investigation is to quantitatively evaluate Dp(16)1Yey mouse craniofacial and brain morphology as a model of DS and to compare homologous measures from two established mouse models for DS: the Ts65Dn mouse and the Ts1Cje mouse.
MATERIALS AND METHODS
Gene Content Evaluation
Human and mouse coding gene content were obtained from the Homologene data report on the Mouse Genome Database (Mouse Genome Informatics, The Jackson Laboratory, Bar Harbor, ME). MicroRNA content for human and mouse genomes were obtained using miRBase. Breakpoint locations for the chromosomal translocations in each model have been sequenced, allowing precise definition of triplicated gene content in each model [Li et al., 2007; Duchon et al., 2011; Reinholdt et al., 2011]. The numbers of triplicated HSA21 homologs in these regions were determined using Homologene IDs and miRBase nomenclature. Regions of gene dosage imbalance that are not homologous to HSA21 in Ts65Dn and Ts1Cje mice were analyzed in the same manner. All lists of genes were checked for open reading frames (ORFs), predicted genes, and undefined RIKEN cDNA and these were included in the final gene totals. The reduced gene databases were created using R.
Murine Models
All procedures were reviewed, approved, and carried out in compliance with animal welfare guidelines approved by the Johns Hopkins University and the Pennsylvania State University Animal Care and Use Committees.
Ts65Dn mice were obtained from the Jackson laboratory and maintained in the Reeves' laboratory colony as a C57Bl/6J × C3H/HeJ (B6 × C3H) advanced intercross. Dp(16)1Yey mice [Li et al., 2007] were the gift of Dr. Eugene Yu and were backcrossed for five generations onto a B6 background and bred to C3H mice to create the F1 generation used here. B6.Ts1Cje mice [Sago et al., 1998] were crossed to C3H mice and maintained by outcrossing to (B6 × C3H) F1 mice. Ts65Dn and Ts1Cje mouse datasets were described previously [Baxter et al., 2000; Richtsmeier et al., 2000, 2002; Olson et al., 2004].
Dp(16)1Yey mice were anesthetized with isoflourane and intracardially perfused with a solution of cold phosphate buffer saline (PBS) with heparin (1 unit/ml) followed by a solution of cold 4% paraformaldehyde (PFA). The heads were removed and drop-fixed in 4% PFA for at least 48 hr, washed, and stored in PBS at 4°C.
Skull Morphometric Data Collection
Micro-computed tomography (µCT) images of Dp(16)1Yey (n = 12) and euploid (n = 12) skulls were acquired at the Johns Hopkins Medical Institution Research Building Imaging Center (Gamma Medica X-SPECT/CT scanner, Northridge, CA, 0.05 mm resolution). The software package Avizo 6.3 (Visualization Sciences Group, VSG) was used to reconstruct µCT skull isosurfaces and acquire three-dimensional coordinates of landmark locations (Fig. S1) from each specimen. Landmark measurement error was assessed (0.028 mm) and three-dimensional coordinates of landmarks from the skull (n = 32) and mandible (n = 10) were collected following standard protocols (see Supplementary Information) and used in morphological analyses.
Analyses of Craniofacial Morphology
Differences in craniofacial form between Dp(16)1Yey and euploid littermates were estimated for subsets of landmarks (Fig. S1) from µCT images of the cranial vault, facial skeleton, cranial base, and mandible using Euclidean distance matrix analysis (EDMA) [Lele and Richtsmeier, 1991, 2001]. In addition to the statistical tests for difference in form, an EDMA-based ordination procedure (PCOORD) [Richtsmeier et al., 1998] was used to determine how Dp(16)1Yey mice and euploid littermates vary in multivariate space. Moreover, differences in variances of craniofacial dimensions were estimated for Dp(16)1Yey mice and euploid littermates and statistically evaluated with a bootstrap approach using MIBoot [Cole, 2002]. Finally, we statistically compared the relative differences among DS mouse models (i.e., Dp(16)1Yey, Ts65Dn, and Ts1Cje) and their respective euploid littermates with GDMA [Lele and Richtsmeier, 2001] using a subset of three dimensional coordinates of 21 landmarks (Fig. S1 in Supporting Information online) available for all mice (Ts65Dn and Ts1Cje datasets as described, see [Baxter et al., 2000; Richtsmeier et al., 2000, 2002; Olson et al., 2004]). Anatomical landmark data collection protocols and morphometric analyses are described in further detail in the supplementary materials section.
Brain Data Collection
The brains of Dp(16)1Yey mice (n = 9) and their euploid littermates (n = 9) were removed, sliced slightly off center along the sagittal axis, and embedded cut-side out in a paraffin block to obtain mid-line sagittal sections. For each mouse the left or right hemisphere was chosen at random for further processing and analysis. Tissues were dehydrated, cleared, and embedded in paraffin. Ninety sections, each 7 µm thick, were obtained spanning the mid-line of the brain. Sections were stained with hematoxylin and eosin. Three sections per mouse were imaged for normalized cerebellar area and two sections per mouse were imaged for Purkinje cell linear density. Folia V, VI, and IX were imaged for granule cell density with three independent, non-overlapping, 5,000 µm2 images taken for each folium and two sections imaged for each mouse. Investigators were blind to genotype throughout the histological preparation and assessment. Further detail on imaging and analysis is provided in the supplemental material.
Analysis of Dp(16)1Yey Brain Morphology
Proportional midline sagittal cross-sectional area of the cerebellum was calculated as a proxy for the ratio of cerebellar volume to overall brain volume [Baxter et al., 2000]. The individual measurements for each cerebellum section were divided by the total brain measurements for that section and ratios were averaged over the three sections for each mouse. Purkinje cell counts were divided by length of the folium to calculate the linear density of each section and then averaged for each mouse. Granule cell counts were divided by the area counted and averaged over the 18 images for each mouse as a proxy for the granule cell density [Baxter et al., 2000] (Fig. 5). A repeated measures ANOVA assessed mean trisomic and euploid brain values while incorporating multiple measurements of each animal. Normality was checked by visual inspection of plots of residuals against fitted values. All calculations were performed in R. Further detail on imaging and analysis is provided in supplemental material.
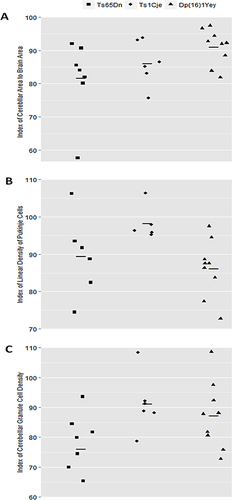
Three measures of cerebellar morphology were assessed across Dp(16)1Yey, Ts65Dn, and Ts1Cje mice and respective euploid littermates: (1) the ratio of midline cerebellar area to total brain area, (2) linear Purkinje cell density, and (3) cerebellar granule cell density. An index for each measurement was created by dividing individual trisomic mouse values by the average of their respective euploid littermates and multiplying the resulting value by 100 (Fig. 6) [Baxter et al., 2000; Olson et al., 2004]. Indices for each model were compared using a Kruskal–Wallis test followed by individual contrast with Bonferroni adjusted P-values (α = 0.10). All calculations were performed in R.
RESULTS
HSA21 Homologous Genes in Ts65Dn, Dp(16)1Yey, and Ts1Cje Mice
Based on the examination of the Homologene database report obtained from JAX and the miRBase database, the number of HSA21 gene homologues that are trisomic in Ts65Dn and Dp(16)1Yey mice is 100 and 115 genes, respectively (Table I; Tables SI and SII in Supporting Information online). A total of 41 trisomic Ts65Dn mouse genes are located on the Mmu17 region of the Ts65Dn translocation chromosome, with 38 genes having HSA6 homologs and one gene having an HSA15 homolog (Table I; Table SIII in Supporting Information online).
The triplicated Mmu16 region of the Ts1Cje mouse includes 67 of the HSA21 homologs found in the other models. The corresponding segment of HSA21 includes 77 genes (Table I; Tables SI and SII in Supporting Information online). Ts1Cje mice are monosomic for seven genes from the telomeric region of Mmu12 that are homologous to HSA7 genes (Table I; Table SIII in Supporting Information online). Thus, Dp(16)1Yey mice provide a better genetic representation, with more HSA21 homologues than Ts65Dn or Ts1Cje mice and no additional triplicated or monosomic genes.
Dp(16)1Yey Craniofacial Morphology and Variance Differs From Euploid Littermates
A global EDMA form analysis showed that Dp(16)1Yey mice and euploid littermates exhibited significant form differences for the cranial vault, face, base, and mandible (Table II). Locally, an average of 50% of all linear measures differed significantly differed between the Dp(16)1Yey and euploid samples. On average, 88% of significantly different linear distances were smaller in Dp(16)1Yey mice relative to euploid littermates (Table II).
| Global form difference results | Confidence interval results for local linear distance (LD) differences | ||
|---|---|---|---|
| Percentage of significantly different LDs | Number of significantly different LDs smaller in Dp(16)1Yey mice | Number of significantly different LDs larger in Dp(16)1Yey mice | |
| Cranial vault* (P-value <0.001) | 29/55 (52.73%) | 22/55 (avg. magnitude 4.54% smaller) | 7/55 (avg. magnitude 6.4% larger) |
| Face* (P-value <0.001) | 28/45 (62.22%) | 27/45 (avg. magnitude 5.5% smaller) | 1/45 (6.2% larger) |
| Cranial base* (P-value <0.001) | 23/55 (41.82%) | 22/55 (avg. magnitude 3.87% smaller) | 1/55 (3.1% larger) |
| Mandible* (P-value <0.001) | 20/45 (44.44%) | 17/45 (avg. magnitude 4.75% smaller) | 3/45 (avg. magnitude 7.3% larger) |
- * Indicates that testing for global differences in form for each craniofacial region was statistically significant.
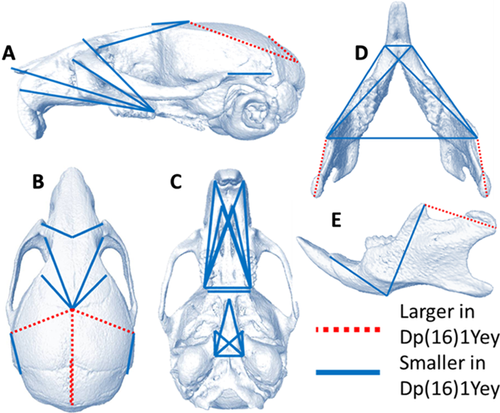
Cranial vault measurements crossing the parietal and interparietal bones of the Dp(16)1Yey trisomic mice were larger along the mediolateral and rostrocaudal axes relative to euploid littermates (Fig. 1). Dp(16)1Yey frontal, nasal, premaxillary, maxillary, and palatine bones exhibited significantly smaller dimensions along the dorsoventral, mediolateral, and rostrocaudal axes compared to euploid littermates. The Dp(16)1Yey presphenoid and basiphenoid were significantly smaller along the rostrocaudal and mediolateral axes relative to euploid littermates. The Dp(16)1Yey mandible was significantly smaller (i.e., small jaw) along the dorsoventral and mediolateral axes, but distances between the left and right coronoid processes and mandibular condyles were increased in Dp(16)1Yey mice (i.e., broad jaw).
The multivariate analysis of cranial shape showed that together, PCOORD axes one and two (PC1, PC2) accounted for approximately 41% of the variance. Dp(16)1Yey mice and euploid littermates separated along PC1 but overlapped along PC2 (Fig. 2a). Dp(16)1Yey mice clustered along the negative end of PC1, which explained approximately 26% of the variance, whereas euploid littermates clustered along the positive end of PC1. The negative end of PC1 was associated with smaller rostrocaudal and dorsoventral measures of the face and reduced mediolateral dimensions of the cranial vault, whereas the positive end of PC 1 was associated with larger rostrocaudal measures of cranial vault dimensions and larger mediolateral measures of the nasal and premaxallae bones.
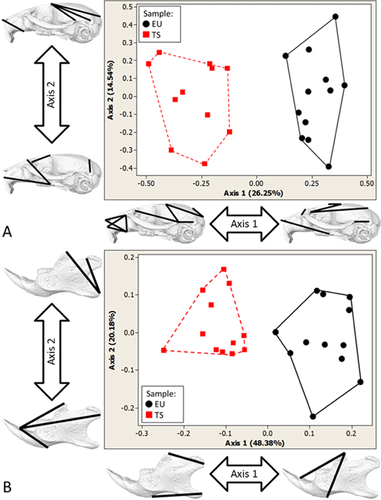
The PCOORD analysis of mandible data indicated that 48% of the variance was characterized by PC1, with nearly 69% of mandibular variance explained by PC1 and PC2 combined together (Fig. 2b). Dp(16)1Yey mice clustered towards the negative end of PC1, which was associated with smaller rostrocaudal measures between the condyle and coronoid process, and smaller measures between the angular process and the base of the of the incisive portion of the mandible. The positive end of PC1 was associated with larger oblique measures of the anterior portion of the mandible stretching from the coronoid process to the most posterior and anterior aspects of the incisive portion of the mandible.
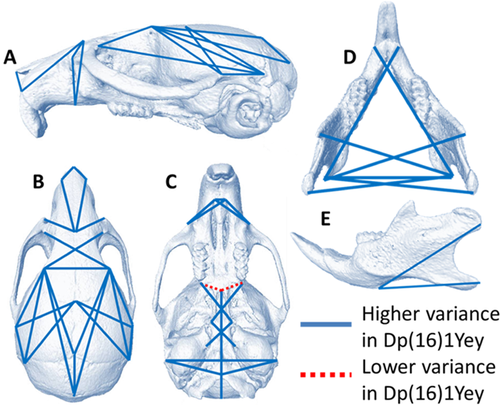
Approximately 20% of all unique linear distances estimated among cranial landmarks (39/200) showed significantly different variances between Dp(16)1Yey mice and euploid littermates (see Table III), with 97% (38/39) of these being higher in trisomic Dp(16)1Yey mice. Linear measures exhibiting significantly increased variance were found across all craniofacial regions (Fig. 3).
| Percentage of LDs with significant differences in variance based on confidence interval tests | Number of LDs with significantly higher variance in Dp(16)1Yey trisomic mice based on confidence interval tests (range of variance increase) | |
|---|---|---|
| Variance results | ||
| Cranial vault | 14/55 (25%) | 14/55 (122–380% increase) |
| Face | 8/45 (18%) | 8/45 (164–263% increase) |
| Cranial base | 7/55 (13%) | 6/55 (106–207% increase) |
| Mandible | 10/45 (22%) | 10/45 (115–236% increase) |
Relative Dp(16)1Yey Craniofacial Dysmorphology Is Similar to the Ts65Dn Model
Using a reduced set of landmarks available for all DS mouse models, the morphological differences between Dp(16)1Yey mice and euploid littermates were statistically compared to differences between Ts65Dn mice and euploid littermates using GDMA (see Supplemental Information). The GDMA analysis showed that only 7% (4/57) of all unique linear distances considered showed differences in the effects of trisomy on specific cranial dimensions in the two mouse models. Though the pattern of differences between these two segmentally trisomic mouse models and their respective euploid littermates was similar, the magnitude of the differences was relatively greater between Dp(16)1Yey mice and euploid littermates. The measures showing increased differences in Dp(16)1Yey mice were localized to the rostrocaudal length of the parietal bone and a bilateral measure connecting bregma with the frontal process of the maxilla (Fig. 4a and b).
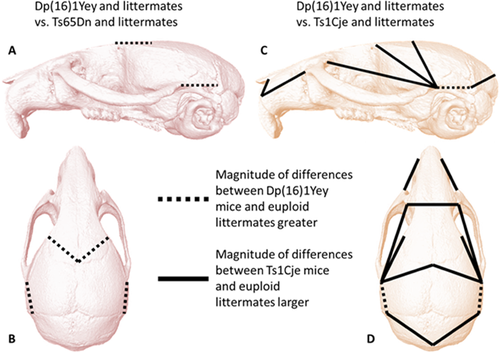
The GDMA determined that 15 out of 57 (26%) linear distances exhibited statistically significant differences in the way that Dp(16)1Yey and Ts1Cje models differed from their respective littermates (Fig. 4c,d). Differences in the effects of these trisomies were detected on measures of facial length and height, and measures of cranial vault length and width. In many cases the effect on linear measures of the Ts1Cje facial skeleton with respect to euploid littermates was greater than the effect measured on Dp(16)1Yey mice relative to their respective euploid littermates, owing to the relatively large reductions in Tc1Cje craniofacial size previously reported [Olson et al., 2004].
Dp(16)1Yey Cerebellar Dysmorphology Is Similar to Ts65Dn and Ts1Cje Models
The cross sectional area of the cerebellum normalized to total brain area in Dp(16)1Yey mice was 91.1% of the area of euploid littermates (P-value = 0.02). Within the cerebellum the Purkinje cell linear density of Dp(16)1Yey mice was 86.5% of euploid littermates (P-value = 0.002), and the granule cell density was 87.2% of euploid littermates (P-value = 0.03) (Fig. 5; Table IV).

| Dp(16)1Yey | Ts65Dna | Ts1Cjeb | |
|---|---|---|---|
| Normalized cerebellar midline histology | 91.1% of euploid | 81.7% of euploid | 86.3% of euploid |
| n = 9 Dp(16)1Yey | n = 7 Ts65Dn | n = 6 Ts1Cje | |
| n = 9 euploid | n = 8 euploid | n = 6 euploid | |
| P = 0.02 | P = 0.002 | P = 0.001 | |
| Purkinje cell density | 86.5% of euploid | 89.5% of euploid | 98.3% of euploid |
| n = 9 Dp(16)1Yey | n = 6 Ts65Dn | n = 6 Ts1Cje | |
| n = 9 euploid | n = 6 euploid | n = 6 euploid | |
| P = 0.002 | P = 0.03 | P = 0.27 | |
| Cerebellar granule cell density | 87.2% of euploid | 76.0% of euploid | 91.2% of euploid |
| n = 9 Dp(16)1Yey | n = 8 Ts65Dn | n = 5 Ts1Cje | |
| n = 9 euploid | n = 8 euploid | n = 5 euploid | |
| P = 0.03 | P = 0.0001 | P = 0.09 |
We reported previously [Olson et al., 2004] that the Ts65Dn mouse was significantly smaller than euploid on these three measurements while the Ts1Cje mouse was not different from euploid in Purkinje cell linear density, showed a trend (but not formal significance) for a reduction in cerebellar granule cell density, and was significantly different in cross-sectional area (Table IV). Despite the differences in gene dosage among the three models considered here, the midline cerebellar area was reduced to the same extent in all three models. In contrast, linear Purkinje cell density was reduced similarly in Ts65Dn and Dp(16)1Yey models, but not affected in Ts1Cje mice. The reduction in granule cell density in the Dp(16)1Yey mice exhibited an intermediate value between the other two models, while the difference between Ts65Dn and Ts1Cje models was statistically significant (Fig. 6; Table V).
| Different from Dp(16)1Yey | Different from Ts65Dna | Different from Ts1Cjeb | |
|---|---|---|---|
| Normalized cerebellar midline histology | |||
| Ts65Dna | No | — | No |
| Ts1Cjeb | No | No | — |
| Dp(16)1Yey | — | No | No |
| Purkinje cell density | |||
| Ts65Dna | No | — | Yes |
| Ts1Cjeb | Yes | Yes | — |
| Dp(16)1Yey | — | No | Yes |
| Cerebellar granule cell density | |||
| Ts65Dna | No | — | Yes |
| Ts1Cjeb | No | Yes | — |
| Dp(16)1Yey | — | No | No |
DISCUSSION
The craniofacial complexes of people with DS typically exhibit dysmorphology, brachycephaly, and reduced facial dimensions (e.g., midfacial retrusion, micrognathia) [Kisling, 1966; Shapiro et al., 1967; Frostad et al., 1971; Fink et al., 1975; O'Riordan and Walker, 1979; Schmidt-Sidor et al., 1990; Allanson et al., 1993; Richtsmeier et al., 2000; Guihard-Costa et al., 2006]. We observed a similar pattern of morphological effects in Dp(16)1Yey mice, including reduced dimensions of the maxillae and palate (Fig. 1), brachycephaly, and reduced mandibular size. Additionally, Dp(16)1Yey mouse skulls exhibited increased variance relative to euploid littermates for specific linear distances (Fig. 2), not unlike increased variance in human DS suggested by other studies [Shapiro, 1975, 1983]. Dp(16)1Yey mice separated from euploid littermates when evaluated in high dimensional form space (Fig. 2), which supports our results that morphology and variance patterns differ for trisomic and euploid mice. The cerebellum is small and hypocellular in humans with DS [Aylward et al., 1997a; Baxter et al., 2000; Olson et al., 2004] and deficits in cerebellar midline area and cerebellar granule cell density seen in the Dp(16)1Yey, Ts65Dn, and Ts1Cje mice parallel these differences (Fig. 5; [Baxter et al., 2000]).
Trisomy affects skull (Fig. 1; Table II) and brain (Table IV) features of Dp(16)1Yey mice, and also affects the same structures in Ts65Dn and Ts1Cje mice [Baxter et al., 2000; Richtsmeier et al., 2000, 2002; Olson et al., 2004]. Craniofacial and brain morphology were affected similarly in Ts65Dn and Dp(16)1Yey mice (Figs. 4 and 6; Table V), although the magnitude of morphological differences between Dp(16)1Yey mice and euploid littermates was greater than the magnitude of differences found between Ts65Dn mice and euploid littermates. The brain and skull were also affected in Ts1Cje mice, but to a lesser degree (Fig. 4; Table IV), suggesting that some genes that are trisomic in Ts65Dn and Dp(16)1Yey mice but not in Ts1Cje mice contributed to effects on craniofacial and brain development (Fig. 4; Tables I and IV). The similarity among the three models suggests that neither monosomy for seven genes from Mmu12 (i.e., Ts1Cje mice) nor trisomy for 42 genes that are not homologous to genes on HSA21 (i.e., Ts65Dn mice) (Table I) have a large impact on these diverse manifestations.
It has been suggested that the regions at dosage imbalance in the Ts65Dn mouse that are not conserved with HSA21 preclude the inclusion of this mouse as a model for DS. If this were the case, then the phenotypic similarities between the Ts65Dn mice and the Dp(16)1Yey mice would logically not be due to specific gene dosage effects of their shared triplicated HSA21 homologs. We reject this reasoning and assert the usefulness of the many studies of the Ts65Dn mouse over the last 20 years. The collection of gene dosage imbalance effects is further reinforced by this study showing quantitative effects on brain and skull morphology that are nearly identical in the Dp(16)1Yey and Ts65Dn mouse models and that closely parallel alterations seen in humans with DS.
Neither Ts65Dn, Ts1Cje, nor Dp(16)1Yey mice create a perfect model of human DS. The 42 triplicated Ts65Dn mouse genes that are orthologous to genes on HSA6 and HSA15 (Table I), along with the seven monosomic Ts1Cje mouse genes that are orthologous to genes on HSA7, confound the interpretation of gene dosage effects. Also, in contrast to 95% of people with DS, Dp(16)1Yey mice do not carry an extra chromosome that disrupts centromere number. In human DS, the extra chromosome must be independently replicated and segregated at mitosis, and must find its appropriate place within the three-dimensional structure of the interphase nucleus. No murine model with trisomic mouse chromosome segments will exactly duplicate all the genes that are found on HSA21, because HSA21 contains genes without direct orthologs in the mouse and vice versa. A given murine model must be evaluated for phenotypes of interest with the assumption that trisomy for corresponding genes affects corresponding developmental and regulatory pathways in both species in similar, but not identical, ways. It follows that trisomy will frequently affect the same structures or functions, but not that the effects will be quantitatively equivalent in two different species. The criteria for evaluating the usefulness of mouse models for human conditions must include more than the presence or absence of particular genes.
The Dp(16)1Yey mouse model will likely supplant the Ts65Dn mouse model, primarily because of simpler husbandry rather than gene content or phenotypic differences. Ts65Dn mice are difficult to breed compared to Dp(16)1Yey mice, in part, because male Ts65Dn mice are typically sterile [Davisson et al., 2007; Moore et al., 2010]. Of note, human males with DS are usually sterile, but male Dp(16)1Yey mice are fertile. The simpler husbandry of Dp(16)1Yey mice should make this model more broadly useful. It will be important to control for the parent contributing the duplicated chromosome segment, as the maternal contribution to the placenta reflects the mother's genotype and maternal effects may be expected with trisomic dams.
The multiple segmental trisomies in Ts1Cje, Ts65Dn, and Dp(16)1Yey mouse models allow correlation of phenotypic outcomes to the effects of genes from the overlapping trisomic regions. The choice of which mouse model to use in an investigation should depend on the scientific question under investigation, the relevant phenotypes, and the presence of genes or other features (e.g., an additional freely segregating chromosome, susceptibility to environmental effects, possible placental contributions) that influence the biological trait(s) of interest.
ACKNOWLEDGMENTS
The authors acknowledge support from the following grants: NIDCR/NIH: R01-HD038384 (R.H.R.), R01-DE018500, R01-DE018500-S1, R01-DE022988 (J.T.R.); NSF: DGE-053135 (J.M.S.), BCS-1061563 (J.M.S.), BCS-0725227 (J.T.R.).


