Whole blood viscosity and red blood cell adhesion: Potential biomarkers for targeted and curative therapies in sickle cell disease
Erdem Kucukal and Yuncheng Man contributed equally to this study.
Funding information: Case Western Reserve University; The Cure Sickle Cell Initiative; University Hospitals; National Heart, Lung, and Blood Institute, Grant/Award Numbers: OT2HL152643, R01HL133574, T32HL134622, U01HL117659; National Science Foundation, Grant/Award Numbers: 1552782, 1706295
Abstract
Sickle cell disease (SCD) is a recessive genetic blood disorder exhibiting abnormal blood rheology. Polymerization of sickle hemoglobin, due to a point mutation in the β-globin gene of hemoglobin, results in aberrantly adhesive and stiff red blood cells (RBCs). Hemolysis, abnormal RBC adhesion, and abnormal blood rheology together impair endothelial health in people with SCD, which leads to cumulative systemic complications. Here, we describe a microfluidic assay combined with a micro particle image velocimetry technique for the integrated in vitro assessment of whole blood viscosity (WBV) and RBC adhesion. We examined WBV and RBC adhesion to laminin (LN) in microscale flow in whole blood samples from 53 individuals with no hemoglobinopathies (HbAA, N = 10), hemoglobin SC disease (HbSC, N = 14), or homozygous SCD (HbSS, N = 29) with mean WBV of 4.50 cP, 4.08 cP, and 3.73 cP, respectively. We found that WBV correlated with RBC count and hematocrit in subjects with HbSC or HbSS. There was a significant inverse association between WBV and RBC adhesion under both normoxic and physiologically hypoxic (SpO2 of 83%) tests, in which lower WBV associated with higher RBC adhesion to LN in subjects with HbSS. Low WBV has been found by others to associate with endothelial activation. Altered WBV and abnormal RBC adhesion may synergistically contribute to the endothelial damage and cumulative pathophysiology of SCD. These findings suggest that WBV and RBC adhesion may serve as clinically relevant biomarkers and endpoints in assessing emerging targeted and curative therapies in SCD.
1 INTRODUCTION
Sickle cell disease (SCD) is one of the most common inherited diseases in the world.1, 2 It is caused by a single-point mutation in the β-globin gene of hemoglobin. Sickle hemoglobin (HbS) polymerizes into long and stiff chains within the red blood cell (RBC) under low-oxygen conditions.3, 4 As a result, HbS-containing RBCs (sickle RBCs) become abnormally stiff and adherent (impairing microcirculatory blood flow), and fragile (resulting in hemolysis). Microvascular occlusion causes episodic and unpredictable vaso-occlusive events (VOE), pain, and cumulative vasculopathy, which are hallmarks of SCD.5 Although the molecular mechanism of SCD has been well established, the complex underpinnings of VOE and cumulative vasculopathy are less well understood.6, 7
Abnormalities of intrinsic rheological properties of whole blood have been reported in patients with SCD and have been implicated in the underlying pathophysiology.8-12 Whole blood viscosity (WBV) is largely determined by the viscosity of plasma, hematocrit (HCT), RBC deformability, and RBC aggregation.13-19 In SCD, all of these properties are altered, resulting in a cumulative change in rheological characteristics of whole blood.12 Plasma viscosity in SCD has been shown to be abnormally increased during VOE episodes, perhaps due to alterations in cytokine profile and plasma protein concentration during crises.18 Increased levels of some plasma proteins in SCD (eg, fibrinogen) may also cause a marked increase in RBC aggregation, and thus higher WBV at lower shear rates.20 It has been shown that non-Newtonian behavior of blood stems mainly from cell-protein interactions at a HCT below 0.30, rather than from cell-cell interactions.15 Deformability of healthy RBCs is a crucial biophysical property, ensuring adequate blood flow into the smallest capillaries, which can be smaller than individual RBCs.21, 22 It has been shown that extensive RBC deformation at relatively high shear rates (>50 seconds−1) is responsible for the shear-thinning behavior of whole blood, in which apparent viscosity decreases with increasing shear rate until it reaches a plateau.23-25 However, in SCD, HbS polymerization (sickling) under low-oxygen conditions profoundly impairs RBC deformability in a reversible fashion.26 Ongoing sickling and unsickling during cyclic transitions from normoxia to hypoxia eventually result in the formation of permanently stiffened RBCs in the circulation.27 Impaired RBC deformability in these patients likely accounts for altered viscosity in SCD. The HCT, or the volume fraction of RBCs to the volume of whole blood, is another major determinant of WBV.28, 29 HCT has an exponential impact on WBV depending on the shear rate and may surpass the effect of other contributors, particularly in the microvasculature. Sickle cell anemia (SCA), in which the individual possesses two copies of the sickle hemoglobin (HbSS), is the most severe genotype of SCD and leads to accelerated hemolysis and thus lower HCT.30, 31 It has been shown that samples from individuals with HbSS exhibited lower whole blood viscosity values compared to healthy controls (HbAA) or people with hemoglobin-SC disease (HbSC).32-34 Increased whole blood viscosity in HbSC is mainly attributed to increased HCT relative to HbSS and to RBCs that are densely packed with hemoglobin.33 Notably, a proliferative retinopathy has been reported to associate with increased whole blood viscosity in people with HbSC SCD, but not in HbSS.35
The conventional viscometers for the analysis of non-Newtonian fluids, such as whole blood, fall into two categories: drag flow type (eg, rotational viscometers) or pressure driven flow type (eg, capillary viscometers).36, 37 Although these viscometers provide accurate and reliable results, they require large sample volumes, long processing times, and technical expertise, limiting their utility, where rapid viscosity measurements with low sample volumes may be necessary. To overcome these limitations, a number of microfluidic-based techniques for blood rheology assessment have been introduced.38-45 Majority of these methods are equipped with complex instrumentation techniques, such as vibrational noise spectrum,46 cantilever deflection,47 or electrical resistance measurement.48 Other microfluidic models based on conventional lithographic techniques have recently been implemented to measure blood viscosity in both normoxic and hypoxic conditions.26, 38, 41, 49 Here, we describe a new microfluidic system integrated with a micro particle image velocimetry (PIV) technique for integrated in vitro assessment of whole blood rheology and red blood cell adhesion in a clinically useful manner.
Although the distinct effects of plasma viscosity, impaired RBC deformability, and elevated plasma protein levels on WBV are well established in literature, a more comprehensive approach that takes into account all these factors in a patient-specific fashion is needed to better understand the role of WBV in the pathophysiology of SCD. Here, we quantitate WBV using pre-processing-free whole blood samples, without adopting the “HCT-matching” techniques, allowing patient-specific and clinically relevant WBV measurements. This study is unique in that we simultaneously report WBV and RBC adhesion levels, under normoxic and hypoxic conditions, of individuals with SCD and demonstrate associations with clinical variables. This integrated approach is pivotal, since both WBV and RBC adhesion are likely dictated by a number of physiological parameters in SCD. This platform has the potential to provide a more comprehensive evaluation of new and emerging therapeutic interventions in SCD, including treatments designed to improve red cell properties, such as targeted, hemoglobin modifying, and stem cell or gene-based curative therapies.
2 METHODS
2.1 Blood sample acquisition
Whole blood samples from de-identified adult (≥18) healthy donors and subjects with SCD seen in the Adult Sickle Cell Clinic at University Hospitals Cleveland Medical Center (UHCMC, Cleveland Ohio) were collected in vacutainers with EDTA (ethylenediaminetetraacetic acid), based on an Institutional Review Board (IRB) approved protocol. All collected samples were stored at 4°C, and the experiments were conducted within 24 hours of venipuncture. Clinical information, medical treatments and previous comorbidities, were obtained, including total hemoglobin level, red blood cell (RBC) count, white blood cell (WBC) count, platelet count, lactate dehydrogenase (LDH) levels, mean corpuscular volume (MCV), hematocrit (HCT), and hemoglobin phenotype (via high-performance liquid chromatography (HPLC) with the Bio-Rad Variant II Instrument (Bio-Rad, Montreal, QC, Canada) at the Core Laboratory of UHCMC). Only subjects infected with HIV or hepatitis C were ineligible for this study. HCT was defined as the volume ratio of RBCs to the volume of whole blood and expressed as a decimal fraction in SI units (e.g., 0.50 HCT in decimal fraction is equivalent to 50% HCT as percentage).
2.2 Fabrication of microfluidic assays
Fabrication of microfluidic chips was performed as previously described.49-52 Briefly, a double-sided adhesive (DSA) polyester film was placed in between a top polymethyl methacrylate (PMMA) cover, and a bottom glass microscope slide pre-coated with 3-aminopropyl triethoxysilane (APTES, Gold Seal Electron Microscopy Sciences, Hatfield, PA). The DSA film and PMMA top cover were laser micro-machined to define the microchannel walls as well as inlet and outlet ports. The assembled devices consisted of three identical microchannels with dimensions of 4 mm × 25 mm × 0.05 mm (width × length × height). The height of the microchannels was chosen to mimic the size scale of post-capillary venules, as it has been shown that this part of the microvasculature plays a critical role in the initiation and progression of VOE events.
2.3 Micro particle image velocimetry for normoxic viscosity measurements
The assembled microfluidic channels were rinsed with 100% ethanol and PBS, and were equipped with silicon tubing that were fixed with epoxy at the inlet and outlet connection ports. A Flow EZ microfluidic flow control system (Part No: LU_FEZ_0345; Fluigent, Lowell, MA) was used to regulate the flow pressure in the microfluidic channels. The microchannels were connected to the input well by the inlet silicone tubing and male Luer connectors, and were mounted on the stage of an inverted microscope (Olympus IX83) coupled with a charge-coupled device (CCD) microscopy camera (EXi Blue EXI-BLU-R-F-M-14-C) to obtain high-resolution videos of the blood flow, following the experimental setting in Figure S1. For each measurement, a 500 μL whole blood sample was loaded in the input well and perfused at a constant pressure of 20 mBar, and two videos of 500 frames were taken at 10 frames per second in two different locations along the channel length. Data acquisition began oneminute after the initiation of flow to allow it to reach a steady state. To ensure that no significant RBC settling occurred during the experiments, we quantified the grayscale intensity of the images acquired for 50 seconds following the initial oneminute waiting period. The image grayscale intensity has been shown to correlate with sample HCT.50 Figure S2 illustrates that the grayscale intensity of the images recorded sequentially for 50 seconds (representing the entire experiment duration) remained nearly unchanged, indicating there was no significant RBC settling in the reservoir.
2.4 Micro particle image velocimetry for hypoxic viscosity measurements
To achieve a physiologically relevant oxygen tension in flowing blood, we coupled a micro-gas exchanger at the inlet of the microchannel as previously described.26 Briefly, a medical grade gas-permeable tubing (Dow Corning, Midland, MI) was placed inside an impermeable tubing (Cole-Parmer, Vernon Hills, IL), creating an annular space through which a gas composed of 5% CO2 and 95% N2 was flowed. The blood sample was then injected through the permeable tubing and allowed to become hypoxic due to the gas diffusion between the sample and gas flowing inside the annular space, resulting in an SpO2 of 83% when blood flow reached the inlet of the microchannel. We have designed this system to induce a SpO2 level of 83% as it closely mimics the physiologically relevant hypoxic conditions.26 Similar to normoxic viscosity measurement, a 500 μL whole blood sample was loaded and perfused at 20 mBar, and a video of 600 frames was acquired in the middle of the microchannel under normoxic conditions after steady-state flow condition. Thereafter, the blood was still allowed to perfuse while the controlled (hypoxic) gas filled the outer tubing, and a video of 6000 frames was started at the same time in the same field of view.
2.5 Quantification of mean flow velocities
 (1)
(1)Where  is the mean velocity along the microchannel depth, Q is the volumetric flow rate, and A is the cross-sectional area of the microchannel. As shown in Figure S3, our results indicate that the mean velocity obtained by the PIV experiments through the entire fluid volume actually represented the mean flow velocity in the microchannel.
2.6 Clinical whole blood viscosity measurements
Whole blood samples from 19 subjects were sent to the clinical core laboratory at UHCMC for standard reference viscosity measurements by a piston-style viscometer (Cambridge Viscosity, Boston, MA). The clinical reference viscosity measurements were conducted using whole blood samples upon request without any dilution or pre-processing.
2.7 RBC adhesion assays under normoxic conditions
The RBC adhesion assays were performed in microfluidic channels that were functionalized with a subendothelium protein, LN. Functionalization of microfluidic channels were carried out as we have previously described in detail.26, 49, 50 In contrast to the viscosity experiments, a constant displacement pump was utilized to provide a constant wall shear stress throughout the microchannels. The wall shear stress is related to the velocity gradient and can be defined as the product of shear rate and dynamic viscosity at the wall surface. The assembled and functionalized microfluidic devices were attached with an inlet tubing and placed on a motorized microscope stage (Olympus IX83). Undiluted whole blood samples were loaded into 1 mL syringes and a total volume of 15 μL of blood was injected into the microchannels at a constant shear stress of 1 dyne/cm2 using a syringe pump (New Era NE-300, Farmingdale, NY), followed by a wash step (1X PBS, 1% BSA w/v, 0.09% sodium azide w/v) at a shear stress of 1 dyne/cm2, during which non-adherent cells were removed from the microchannel. The wall shear stress acting upon an adherent RBC on the microchannel surface will force the RBC to detach above a certain threshold. Thereafter, a 32 mm × 32 mm interrogation area was scanned at 20× via the Olympus Cell Sense live imaging software, and the total number of adherent RBCs was manually quantified using Photoshop CS5 (Adobe Inc., San Jose, CA).
2.8 RBC adhesion assays under hypoxic conditions
Whole blood samples were perfused into the LN-functionalized microchannels with the micro-gas exchanger at 1 dyne/cm2, which was followed by same washing, imaging, and quantifying as described previously.
2.9 Statistical analysis
The statistical analyses were performed using Minitab 19 (Minitab Inc., State College, PA). Statistical comparison between two groups was conducted using the Student's t test or paired t test for non-paired and paired data respectively. To compare three or more groups, we performed Kruskal-Wallis test with Dunn's multiple comparison. A P value below .05 was considered to indicate statistical significance. The data is reported as mean ± SD.
3 RESULTS
3.1 Mean flow velocity as a surrogate for WBV
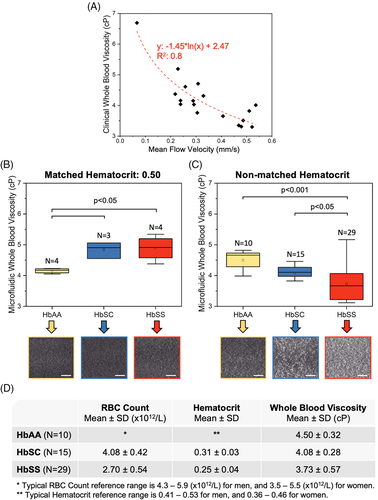
Here, we used mean flow velocities obtained via micro-PIV as a surrogate for whole blood viscosity. To correlate the measured flow velocities with the sample viscosity, the viscosity of 19 blood samples were measured via a commercially available piston-style viscometer. Figure 1A shows that there existed an inverse logarithmic relationship between the sample viscosity and mean flow velocity in the microchannel at a constant pressure of 20 mbar, which was within the physiological range. Thus, we utilized the logarithmic equation to infer the microfluidic whole blood viscosity of the sample from the mean flow velocity determined by micro PIV, which will be referred to as whole blood viscosity (WBV) henceforth. Adhering to this methodology, we first quantified the viscosity of blood samples from subjects with no hemoglobinopathies (HbAA), with hemoglobin-SC disease (HbSC), and with homozygous sickle cell disease (HbSS) by utilizing the “HCT-matching” technique, in which the blood samples were initially centrifuged to separate RBCs from whole blood. Then, the isolated RBCs were mixed with plasma obtained from the same sample at a ratio of 1:1 yielding a fixed HCT of 0.50. During this procedure, we strictly adhered to the hemorheological and laboratory techniques guidelines published in 2009.55 This approach allowed us to analyze the effect of RBCs and plasma on determining whole blood viscosity of a sample by eliminating any possible contribution from sample-to-sample HCT variation.
3.2 Effect of hematocrit matching on WBV
In line with previous findings, our results showed that viscosity of HCT-matched HbSS samples was significantly greater compared to HbAA samples (Figure 1B, 4.89 ± 0.41 cP vs 4.15 ± 0.07 cP, P < .05, Mann-Whitney U test), likely due to abnormal RBCs and pro-inflammatory plasma from subjects with HbSS. However, it is well known that subjects with SCD suffer from chronic anemia and have much lower HCT values compared to people with HbAA, which may have a significant impact on their whole blood viscosity. Therefore, we next tested the viscosity of blood samples from subjects with HbAA, HbSC, and HbSS using undiluted and whole blood samples without pre-processing. As shown in Figure 1C and 1D, the mean viscosity level of HbAA samples was the highest (4.50 ± 0.32 cP), then HbSC (4.08 ± 0.28 cP), while HbSS samples displayed the lowest mean WBV (3.73 ± 0.57 cP), in contrast to the HCT-matched results (Figure 1B). We observed a significant heterogeneity within the HbSS group, in which the difference between the lowest and highest data points was almost 2-fold. Of note, HbAA samples typically had lower grayscale intensities when imaged under a phase-contrast microscope compared to HbSC and HbSS samples, which is indicative of higher HCT (Figure S4).
3.3 WBV is heterogeneous and correlates with hematological parameters in subjects with SCD
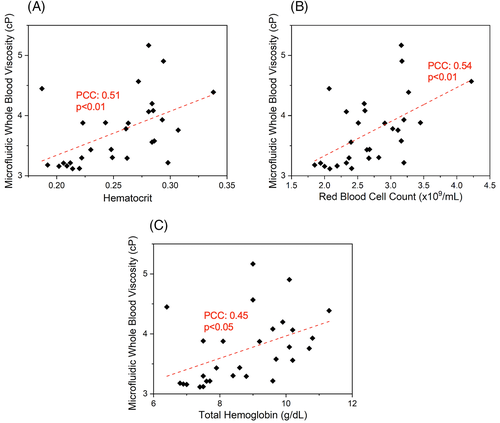
Viscosity of whole blood is determined by a number of factors including HCT (the ratio of RBC volume to whole blood volume).15 Our results show that both HCT and total RBC count associate with WBV, although the relationships were not entirely linear, demonstrating the likelihood of other possible contributors to WBV (Figure 2A, HCT: PCC = 0.51, P < .01; Figure 2B, RBC count: PCC = 0.54, P < .01, one-way ANOVA). Further, subjects with a lower WBV tended to have significantly higher total hemoglobin levels (Figure 2C, PCC = 0.45, P = .001, one-way ANOVA) although all the subjects in the study population had lower than normal HCT levels (Figure 1D). These findings collectively suggest that our microfluidic approach accounts for rheological differences made by a number of determinants of WBV. Similarly, clinical measurements of WBV in people with homozygous or heterozygous SCD, using the piston-style viscometer, also displayed a significant association with subjects' RBC counts and HCT levels, albeit also not strongly linearly (Figure S5, HCT: PCC = 0.35, P = .02; RBC: PCC = 0.56, P = .001, one-way ANOVA). These results confirm that our microfluidic assay provides similar results compared to a commercial viscometer with regards to the dependence of whole blood viscosity on sample HCT and total RBC count. No other significant associations between WBV and clinical variables, including lactate dehydrogenase (LDH), absolute reticulocyte counts, mean corpuscular volume, HbS levels, and fetal hemoglobin (HbF) levels, were detected in this modest-sized study population. However, subjects with a recent transfusion history (<3 months) had a significantly higher WBV, compared to those with no recent transfusion (Figure S6A, 4.01 ± 0.7 cP vs 3.56 ± 0.4 cP, P < .05, Student's t test). The subject population with a recent transfusion had significantly lower HbS levels (Figure S6B, 39.7 ± 6.5% vs 77.1 ± 13.3%, P < .001, Student's t test). No association was observed between WBV and hydroxyurea treatment (data not shown).
3.4 WBV correlates inversely with RBC adhesion
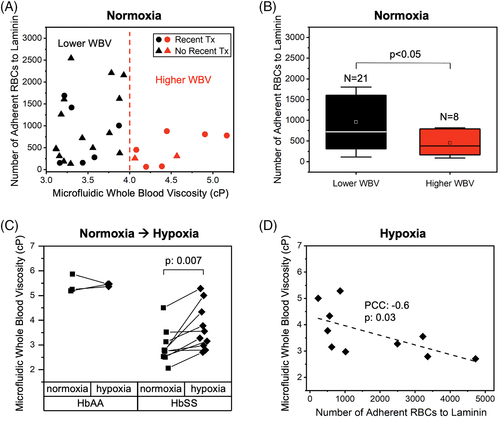
We and others have previously described an association between disease severity and RBC adhesion in SCD.49, 50, 56-59 Since our current results suggest a heterogeneous WBV profile among patients with HbSS, we next sought to determine whether there was an association between RBC adhesion to the sub-endothelial protein Laminin (LN) and WBV.49, 59 Laminin has been shown to mediate sickle RBC (HbSS RBC) adhesion through the RBC membrane receptor BCAM-Lu.60, 61 Therefore, it constitutes a physiologically relevant substrate in assessing RBC adhesion in vitro. The adhesion experiments and WBV measurements were conducted in parallel using microfluidic channels. Because the lowest limit of WBV from tested HbAA samples was approximately 4 cP, we categorized the SCD study population into two groups: a subnormal (lower) WBV group (<4 cP, N = 21) and normal (higher) WBV (>4 cP, N = 8) as shown in Figure 3A. Notably, subjects with a lower WBV displayed significantly greater RBC adhesion to LN, compared to those with a higher WBV (Figure 3B, 957 ± 767 vs 452 ± 331, P < .05, Student's t test). Moreover, RBC adhesion to LN strongly associated with subject LDH levels, and borderline so for absolute reticulocyte count (Figure S7A, P = .003, PCC = 0.53; Figure S7B, P = .07, PCC = 0.35, respectively).
3.5 Hypoxia-induced WBV increase is subject-specific and may influence RBC adhesion in SCD
Polymerization of sickle hemoglobin (HbS) in hypoxia leads to abnormal RBC biophysical properties such as increased adhesiveness and impaired deformability.26, 62 Therefore, a hypoxic environment may increase sickle WBV in an individual patient, due to the impact of RBC deformability. On the other hand, the ratio of HbS to normal hemoglobin (HbA) may be heterogeneous among individuals with SCD, who are often transfused. Finally, contribution of RBC deformability to WBV may be significantly altered depending on the HCT level.21 We integrated a micro gas exchanger to our microfluidic system, as we have previously described,26 in order to probe the change in WBV as well as RBC adhesion to LN deriving from the change from normoxic to hypoxic conditions. Because RBC settling in the reservoir could affect the measured viscosities, we quantified grayscale intensity changes of the images that were acquired for 5 minutes following flow initiation. As illustrated in Figure S8, there was no significant change of RBC settling during the entire experimental setup, reflected by the absence of a grayscale intensity change. Of note, the grayscale intensities in Figure S8 do not represent flow velocity, and we did observe a significant reduction in mean flow velocity under hypoxia as shown in Figure 3. The hypoxic viscosity results showed that WBV of control blood samples (HbAA, N = 3) remained relatively unchanged, while HbSS samples (N = 10) became more viscous under hypoxia as shown in Figure 3C (P = .007, Student's t test). Interestingly, we observed an inverse relationship between hypoxic WBV and RBC adhesion to LN in hypoxia, similar to that seen under normoxic conditions (Figure 3D, PCC = -0.6, P = .03, one-way ANOVA). In other words, RBCs from samples with a lower hypoxic WBV had an increased propensity to adhere to LN under hypoxic conditions.
4 DISCUSSION
Abnormal RBC adhesion and changes in WBV are two independent but inter-related factors that contribute to the endothelial dysfunction and vaso-occlusion which underlie SCD.7, 63-65 In vitro systems as well as microfluidic platforms have been developed to tease out the effects of altered blood rheology in SCD pathophysiology. However, in most studies, the authors utilized a HCT matching approach, through which RBCs from whole blood samples were initially separated and then re-suspended either in a physiologic buffer, or in the plasma itself at a fixed HCT level. Although this approach is useful in highlighting the role that RBCs play in determining whole blood rheology, it does not account for the effects of plasma proteins or HCT.
In this study, we quantified the viscosity of preprocessing-free whole blood samples from a clinically-diverse SCD patient population. Our findings revealed that sample HCT played a pivotal role in WBV. Thus, SCD samples were significantly more viscous compared to HbAA samples when HCT levels were matched, while the viscosity of SCD samples was heterogeneous and much lower compared to the HbAA group when pre-processing free whole blood samples were tested.
Our results demonstrated that subjects with HbSS SCD had heterogeneous WBV profiles, with normal or subnormal WBVs compared to controls (HbAA), which may result in distinct pathophysiological consequences. A subnormal WBV depresses endothelial shear stress, which maintains endothelial health.66 A lower endothelial shear stress, has been established as a pro-inflammatory stimulus and associated with a risk for initiation and progression of coronary atherosclerosis.67-69 Therefore, we postulate that chronic subnormal WBV, due to anemia, may impose additional burdens to cardiovascular health and disease, particularly for people with HbSS who already suffer from a high degree of micro and macro-vascular complications.
Hypoxia is a strong modulator of whole blood rheology,70 particularly in SCD, as the biophysical properties of HbSS RBCs significantly change under low oxygen conditions, which in turn alters both WBV and cellular adhesion.21, 26, 59, 74 We found no meaningful change in WBV between normoxic and hypoxic conditions in HbAA samples, but HbSS samples became significantly more viscous in hypoxia (Figure 3C). This acute rise in WBV under hypoxia could result in a lower mean blood flow velocity, promoting RBC sickling, vaso-occlusion, and local ischemia due to increased RBC passage time through the microvasculature. This could increase local hypoxia, leading to a further rise in WBV and increased cellular interactions between RBCs and endothelial cells, slowing down the blood flow and contributing to local occlusion and ischemia (Figure 4).
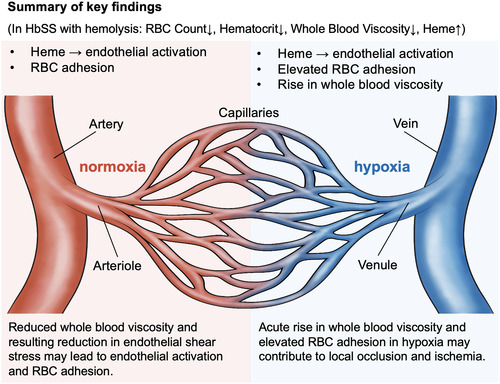
In this work, we integrated analyses of WBV and RBC adhesion. We found an inverse association between RBC adhesion and WBV in subjects with HbSS. A lower WBV strongly associated with a lower HCT. Similarly, LDH levels and absolute reticulocyte counts were significantly higher in subjects with a higher RBC adhesion profile, as we reported previously.26, 49, 50 Based on these findings, we speculate that a hemolytic environment associates with RBC adhesion and also leads to a lower WBV due to reduced HCT, which explains the inverse relationship between RBC adhesion and WBV. Further, a hemolytic environment has been reported to damage the endothelium,71, 72 while a lower WBV and thus lower endothelial shear stress may mediate activation and adhesive interactions between endothelial cells and blood cells in vivo, since cellular adhesion is strongly governed by applied shear force (Figure 4). Our integrated viscosity and adhesion analyses highlight a range of deleterious effects on the microvasculature that may arise in a patient with HbSS and hemolysis, from the cumulative effects of heme toxicity, abnormal cellular adhesion, and the impact of a low HCT and subnormal WBV on endothelial health. Further, acute, hypoxia-induced increases in viscosity and in RBC adhesion may together have a deleterious impact on the local environment of the microvasculature (Figure 4). Patients with low WBV and high cellular adhesion may represent an especially at-risk subpopulation, and we are evaluating this prospectively.
The microfluidic assay described in this study holds promise as a translatable system that could be utilized for simultaneous assessment of WBV and RBC adhesion in a wide spectrum of clinical scenarios as clinically relevant biomarkers, and in assessment of emerging targeted and curative therapies that aim to improve blood rheology and cellular adhesion.73-76 For instance, WBV and RBC adhesion levels can be assessed before and after therapeutic interventions targeted at HCT augmentation, adhesion mitigation, and/or before and after curative therapies, in order to assess improvements in blood rheology and RBC properties with therapy.
Allogeneic hematopoietic stem cell transplantation is the only currently available, feasible, relatively accessible, and potentially curative strategy for patients with high-risk SCD.77, 78 However, only a small portion of patients (<18%) have access to matched sibling donors.79 Gene therapy, on the other hand, can repair the underlying cause of SCD, the mutated sickle beta-globin gene, by altering hemoglobin composition within the RBC through ex vivo gene transfer into autologous hematopoietic stem cells.80, 81 Close monitoring of WBV along with RBC adhesion properties after a curative therapy is essential to fully evaluate the impact of such treatments on patient outcomes. Particularly, it is likely that RBC heterogeneity will be typical immediately following a curative therapy, at which time, precise discernment of heterogeneity may be especially crucial. Based on our results, unmatched for sample HCT, we project that more normal RBCs and a more normal HCT post curative therapy will likely result in a rise in WBV. In parallel, HbSS-containing whole blood has higher RBC adhesion than HbAA-containing whole blood.49 We project that WBV and RBC adhesion, as measured by our integrated microfluidic approach, will transition following curative therapy (low-to-high WBV and high-to-low RBC adhesion, post-treatment).
CONFLICT OF INTEREST
The authors declare no conflict of interest.
AUTHOR CONTRIBUTIONS
EK and YM have contributed equally to this work. E.K., Y.M., and U.A.G. conceived the project. E.K., Y.M., A.H., S.L., A.B., and R.A. performed the experiments and collected the data. E.K., Y.M., and U.A.G. analyzed the results. E.K. prepared the figures. E.K. and Y.M. wrote the manuscript. J.K. advised on the technical considerations of the PIV application. E.K., Y.M., J.A.L., and U.A.G. edited the manuscript. J.A.L. provided the patient samples.
ACKNOWLEDGEMENTS
This work was supported by National Science Foundation (NSF) CAREER Award 1552782, NSF Award 1706295, The Cure Sickle Cell Initiative; National Heart, Lung, and Blood Institute (NHLBI) grants R01HL133574, OT2HL152643, U01HL117659, and T32HL134622. The authors acknowledge with gratitude the contributions of patients and clinicians at Seidman Cancer Center (University Hospitals, Cleveland). U. A. G. would like to thank the Case Western Reserve University, University Center for Innovation in Teaching and Education (UCITE) for the Glennan Fellowship, which supports the scientific art program and the art student internship in CASE-BML. The authors would like to thank Alexa Abounader from Cleveland Institute of Art for her scientific illustration used in this work.


