Downregulation of miR-15a due to LMP1 promotes cell proliferation and predicts poor prognosis in nasal NK/T-cell lymphoma
Conflict of interest: Nothing to report.
Abstract
Nasal NK/T-cell lymphoma (NNKTL) is an Epstein-Barr virus (EBV)-associated malignancy and has distinct clinical and histological features. However, its genetic features are hitherto unclear. MicroRNAs (miRNAs) play a crucial role in the pathogenesis of several malignancies via regulating gene expression. In this study, we investigated whether the specific microRNAs were related to the tumor behaviors in NNKTL. MiRNA array and Quantitative RT-PCR analyses revealed that miR-15a was expressed at a much lower level in NNKTL cells (SNK-1, SNK-6, and SNT-8) than in normal peripheral NK cells and EBV-negative NK cell line KHYG-1. Quantitative PCR and western blot analyses showed that the expression of MYB and cyclin D1, which are validated targets of miR-15a, was higher in NNKTL cells. Transfection of NNKTL cells (SNK-6 and SNT-8) with a miR-15a precursor decreased MYB and cyclin D1 levels, thereby blocking G1/S transition and cell proliferation. Knockdown of EBV-encoded latent membrane protein 1 (LMP1) significantly increased miR-15a expression in SNK-6 cells. In NNKTL tissues, we found that reduced miR-15a expression, which correlated with MYB and cyclin D1 expression, was associated with poor prognosis of NNKTL patients. These data suggest that downregulation of miR-15a, possibly due to LMP1, implicates in the pathogenesis of NNKTL by inducing cell proliferation via MYB and cyclin D1. Thus, miR-15a could be a potential target for antitumor therapy and a prognostic predictor for NNKTL. Am. J. Hematol. 89:25–33, 2014. © 2013 Wiley Periodicals, Inc.
Introduction
Nasal natural killer (NK)/T-cell lymphoma (NNKTL) has distinct epidemiologic, clinical, histological, and etiologic features. Clinically, NNKTL is characterized by progressive necrotic lesions mainly in the nasal cavity, as well as a poor prognosis caused by rapid lesion progression 1, 2. The original cells of NNKTL have been reported to be of NK- or γ∂ T-cell lineages, both of which express the NK-cell marker CD56 1, 3. In 1990, we were the first to identify the presence of Epstein-Barr virus (EBV) DNA, EBV-oncogenic proteins, and clonotypic EBV genomes in NNKTL tissues from five patients 4. It is now widely accepted that EBV plays an important role in lymphomagenesis 1, 5.
Establishment of the EBV-positive cell lines SNK-6 and SNT-8 from primary lesions has greatly facilitated NNKTL research; since then, the biological characteristics of NNKTL have been gradually elucidated 3. We previously reported that NNKTL cell lines produce several cytokines and chemokines, such as interferon (IFN)-γ, interleukin (IL)-9, IL-10, and IFN-γ-inducible protein (IP)-10, possibly because of LMP1, which regulates the proliferation and invasion of cells in an autocrine manner 6-8. We have also shown that circulating monocytes attracted by IP-10 enhanced the proliferation of NNKTL cells via direct cell-to-cell contact 9. More recently, we demonstrated that NNKTL cell lines express CD70, which mediates cell proliferation by binding to soluble CD27 10.
MiRNAs are small noncoding RNAs that regulate gene expression by binding to the 3′ untranslated region of target mRNAs to repress translation and play important roles in various biological processes, including development, differentiation, apoptosis, and cell proliferation 11. Deregulation of miRNAs is associated with various lymphomas/leukemias and solid tumors, irrespective of the presence or absence of disease-specific genetic aberrations 12, 13; however, very few studies have reported miRNA deregulation in NNKTL 14-16. Thus, the functional roles of miRNAs in NNKTL lymphomagenesis are still not fully understood.
To determine which miRNA plays a role in NNKTL lymphomagenesis, we conducted miRNA array analysis and compared the miRNA expression profiles in NNKTL cell lines, and then found that miR-15a was downregulated. We further found that miR-15a led to decreased expression of MYB and cyclin D1, thereby resulting in inhibition of cell-cycle progression and cell proliferation. In contrast, silencing of LMP1 increased the miR-15a expression in NNKTL cells. Importantly, lower expression of miR-15a was also found to be associated with poor prognosis in NNKTL patients. All together, these data implicate downregulation of miR-15a, possibly by LMP1, in the pathogenesis of NNKTL by inducing cell proliferation via the enhanced actions of MYB and cyclin D1.
Materials and Methods
Study subjects
NNKTL tissue specimens were collected from 16 Japanese patients [12 men and four women; age 21–85 years (median age, 56 years)]. Patients were diagnosed according to the World Health Organization classification of hematological malignancies 17 and treated at the Department of Otolaryngology-Head and Neck Surgery, Asahikawa Medical University between 2003 and 2010. Their clinical characteristics are listed in Table 1. Normal NK cells from six healthy volunteers were isolated from peripheral blood mononuclear cells via immunomagnetic negative selection using the Dynabeads Untouched Human NK Cells Kit (Invitrogen, Carlsbad, CA). All patients and volunteers signed informed consent forms. This study was approved by the Institutional Review Board of Asahikawa Medical University.
| Case no. | Age | Gender | Clinical stage | B symptom | Serum LDHa (IU/L) | miR-15a | CD56 IHCb | EBER ISHc | LMP1 IHCb | MYB IHCb | Cyclin D1 IHCb | Treatment | Course (Months) |
|---|---|---|---|---|---|---|---|---|---|---|---|---|---|
| 1 | 68 | M | I | – | 248 | High | + | + | – | – | – | Chemotherapy, Radiation | Died (122) |
| 2 | 53 | F | I | – | 163 | High | + | + | – | – | – | Chemotherapy, Radiation | Alive (112) |
| 3 | 68 | M | I | + | 373 | Low | + | + | + | + | – | Chemotherapy, Radiation | Died (5) |
| 4 | 53 | M | II | + | 219 | Low | + | + | + | + | + | Chemotherapy, Radiation | Died (2) |
| 5 | 85 | M | II | + | 223 | Low | + | + | + | + | + | NDd | Died (7) |
| 6 | 40 | M | I | – | 197 | High | + | + | – | – | – | Chemotherapy, Radiation | Alive (108) |
| 7 | 48 | F | I | – | 205 | High | + | + | – | + | – | Chemotherapy, Radiation | Alive (104) |
| 8 | 40 | F | I | + | 144 | High | + | + | – | – | – | Chemotherapy, Radiation | Alive (99) |
| 9 | 64 | M | I | – | 162 | High | + | + | – | – | – | Chemotherapy, Radiation | Alive (92) |
| 10 | 48 | M | I | + | 176 | Low | + | + | + | + | + | Chemotherapy, Radiation | Alive (51) |
| 11 | 67 | F | IV | – | 171 | Low | + | + | + | + | + | Chemotherapy, Radiation | Died (18) |
| 12 | 21 | M | I | + | 177 | Low | + | + | + | – | – | Chemotherapy, Radiation | Alive (59) |
| 13 | 58 | M | II | + | 765 | High | + | + | – | – | – | Chemotherapy, Radiation | Alive (57) |
| 14 | 67 | M | I | + | 626 | High | + | + | – | + | – | Chemotherapy, Radiation | Alive (44) |
| 15 | 21 | M | I | + | 205 | High | + | + | + | – | + | Chemotherapy, Radiation | Alive (17) |
| 16 | 85 | M | I | + | 398 | High | + | + | – | – | – | Chemotherapy, Radiation | Alive (15) |
- a LDH, lactate dehydrogenase.
- b IHC, immunohistochemistry.
- c ISH, in situ hybridization.
- d ND, not determined.
Cell lines and cell cultures
EBV-positive NNKTL cell lines, SNK-6, SNK-1, and SNT-8, were kindly provided by Dr. Shimizu (Tokyo Medical and Dental University) 3. SNK-6 and SNK-1 exhibit an NK cell phenotype, whereas SNT-8 has a T-cell phenotype. KHYG-1 and NK-92 were established from patients with NK cell leukemia 18, 19. The former is an EBV-negative NK cell line. NK-92, though initially described as EBV-negative, is EBV-positive 10, 20 (Supporting Information Fig. 1a). Raji is an EBV-positive B cell line that originated from Burkitt's lymphoma 21, and Jurkat cells are EBV-negative T cells derived from patients with acute lymphoblastic leukemia 22.
SNK-1, SNK-6, and SNT-8 cells were cultured in RPMI 1640, supplemented with 10% human serum, 50 units/mL penicillin, 50 μg/mL streptomycin, and 700 units/mL recombinant human IL-2. KHYG-1 cells were cultured in RPMI 1640, supplemented with 10% fetal bovine serum (FBS), 50 units/mL penicillin, 50 μg/mL streptomycin, and 100 units/mL recombinant human IL-2. NK-92 cells were cultured in α-minimum essential medium, supplemented with 12.5% horse serum, 12.5% FBS, 50 units/mL penicillin, 50 μg/mL streptomycin, and 200 units/mL recombinant human IL-2. Raji and Jurkat cells were cultured in RPMI 1640 supplemented with 10% FBS, 50 units/mL penicillin, and 50 μg/mL streptomycin. All cell lines were incubated at 37°C in an atmosphere containing 5% CO2.
MiRNA array analysis
Total RNA was extracted from SNK-6, SNK-1, SNT-8, KHYG-1, and normal NK cells using the mirVana RNA Isolation Kit (Ambion, Austin, TX) according to the manufacturer's protocol. Extracted RNA was then labeled with Hy5 using the miRCURY LNA microRNA Array Labeling Kit (Exiqon, Vedbaek, Denmark) and hybridized onto 3D-Gene Human microRNA Oligo chips (Toray, Kamakura, Japan). The annotation and oligonucleotide sequences of probes were conformed to the miRNA database miRBase (http://microrna.sanger.ac.uk/sequences/). After stringent washes, fluorescent signals were scanned and analyzed by the 3D-Gene Scanner (Toray). Raw data of each spot were normalized by substitution with a mean intensity of the background signal determined by all blank spots' signal intensities of 95% confidence intervals. Measurements of duplicate spots with signal intensities greater than two standard deviations (SD) of the background signal intensity were considered to be valid. Signals detected for each gene were normalized using a global normalization method (i.e., the median of detected signal intensities was adjusted to 25).
Quantitative reverse transcription (RT)-PCR analysis of miR-15a
Total RNA extracted from cell lines and frozen tissue specimens was reverse transcribed using the TaqMan MicroRNA Reverse Transcription Kit (Applied Biosystems, Foster City, CA) according to the manufacturer's instructions. Quantitative PCR of mature miRNAs was performed using the TaqMan microRNA Assay (Applied Biosystems) specific for miR-15a, along with TaqMan Universal Master Mix II (Applied Biosystems), according to the manufacturer's instructions. Results were normalized to the U47 expression using the 2−ΔΔCT method. PCR was performed in the LightCycler 480 (Roche, Indianapolis, IN) under the following conditions: 50°C for 2 min and 95°C for 10 min, followed by 40 cycles of 95°C for 15 s and 60°C for 1 min. For cell lines, reactions were performed in triplicate.
Quantitative RT-PCR analysis of MYB, cyclin D1, and LMP1
Total RNA extracted from all cell lines was reverse transcribed using Transcriptor High Fidelity cDNA Synthesis Kit (Roche) according to the manufacturer's instructions. The expression levels of MYB and cyclin D1 were determined using LightCycler 480 SYBR Green I Master (Roche) and normalized to β-2-microglobulin (β2MG) levels. The following primers were used in this study: MYB, 5′-AAGCCAG CCAGCCAGCAGTG-3′ (sense) and 5′-TGCTGTGCCACCCGGGGTAG-3′ (antisense); cyclin D1, 5′-GGATGCTGGAGGTCTGCGA-3′ (sense) and 5′-AGAGGCCACGAACATGCAAG-3′ (antisense); LMP1, 5′-AATTTGCACG GACAGGCATT-3′ (sense) and 5′-AAGGCCAAAAGCTGCCAGAT-3′ (antisense); and β2MG, 5′-GCCTTAGCTGTGCTCGCGCT-3′ (sense) and 5′-TGCGGCATCTTCAAACCTCCATGA-3′ (antisense). PCR reactions were performed in triplicates under the following conditions: 95°C for 5 min, followed by 40 cycles of 95°C for 10 s, 60°C for 10 s, and 72°C for 10 s.
Transient transfection
Cells were transfected with premiR precursors or siRNAs using the Neon Transfection System (Invitrogen) according to the manufacturer's instructions. Briefly, 2.5 × 10⁵ cells suspended in 10 μL of buffer containing 50 nM premiR precursors or siRNAs were electroporated at three pulses of 1500 V for 10 ms. After electroporation, cells were resuspended in fresh media and used for analyses after 48 h. PremiR precursors used in this study included a miR-15a precursor (premiR-15a) and a premiR precursor negative control (premiR-Ctrl) obtained from Ambion (Austin, TX). The following siRNAs were acquired from Dharmacon (Lafayette, CO): MYB siRNA, ON-TARGETplus SMARTpool Human MYB siRNA; cyclin D1 siRNA, ON-TARGETplus SMARTpool Human cyclin D1 siRNA; and Ctrl siRNA, ON-TARGETplus nontargeting Pool siRNA. Silencer Select siRNA against LMP1 (LMP1 siRNA), which was designed as described previously 23, and Silencer Select Negative Control #1 siRNA (NC siRNA) were both synthesized from Applied Biosystems (Foster City, CA).
Apoptosis assay
The apoptosis assay was performed using the Annexin V-FITC Kit (Beckman Coulter, Miami, FL). Briefly, transfected cells were washed with phosphate-buffered saline (PBS) and resuspended in 100 μL of binding buffer containing annexin V-fluorescein isothiocyanate (FITC) and propidium iodide (PI). After incubation on ice for 10 min, cells were analyzed on a FACSCalibur flow cytometer (Becton Dickinson, San Jose, CA). The relative number of apoptotic cells (annexin V- and PI-positive cells plus annexin V-positive and PI-negative cells) was calculated. Three independent experiments were performed.
Cell cycle analysis
Cells treated or untreated with 40 nM nocodazole (Sigma, St. Louis, MO) for 10 h were fixed in 70% ethanol, followed by two washes with PBS. DNA was stained using PI/RNase Staining Buffer (BD Biosciences) according to the manufacturer's instructions. The DNA content was measured on a FACSCalibur flow cytometer and analyzed by ModFit LT software (Verity Software House, Topsham, ME). In each sample, at least 20,000 events were counted. Four independent experiments were performed.
Cell proliferation assay
Cell proliferation was evaluated using the CellTiter 96 AQueous One Solution Proliferation Assay (Promega, Madison, WI) according to the manufacturer's instructions. First, transfected cells (2.0 × 10⁴ cells/well) were seeded in 96-well plates and incubated at 37°C. After 24, 48, and 72 h, cell proliferation was assessed as follows. CellTiter 96 AQueous One Solution (20 μL/well) was added to plates and incubated at 37°C for 2 h under 5% CO2. Absorbance at 490 nm was then measured using a microplate reader (Nalge Nunc International, Roskilde, Denmark). Cell proliferation was expressed as the percentage of untreated controls. Three independent experiments were performed in duplicate.
Western blot analysis
Cells starved of IL-2 for 24 h were lysed in RIPA buffer (50 mM Tris-HCl [pH 8.0], 150 mM NaCl, 1% Triton X-100, 0.1% SDS, and 1% sodium deoxycholate) containing 1 mM PMSF. Protein concentration in the cell extracts was determined using the Micro BCA Protein Assay (Pierce, Rockford, IL). Equal amounts of proteins were run on 10% Bis-Tris gels (Invitrogen), followed by transfer onto PVDF membranes at 75 V for 90 min. After blocking for 1 h with Block Ace (Dainippon Pharmaceutical, Osaka, Japan) in Tween 20, membranes were incubated overnight at 4°C with the following primary antibodies: rabbit monoclonal anti-MYB, clone EP769Y (Abcam, Cambridge, MA); mouse monoclonal anti-cyclin D1, clone DSC-6 (Dako, Glostrup, Denmark); mouse monoclonal anti-Cdk1/Cdc2, clone 1/Cdk1/Cdc2 (BD biosciences, San Jose, CA); mouse monoclonal anti-LMP1, clone CS1-4 (Dako); or mouse monoclonal anti-α-tubulin, clone DM 1A (Sigma). Blots were then incubated with horseradish peroxidase (HRP)-conjugated sheep anti-mouse or donkey anti-rabbit IgG antibodies (Amersham, Arlington Heights, IL) and detected with the ECL Prime Detection Reagent (Amersham). Band intensities were quantified relative to α-tubulin values using the LAS-3000 image analyzer and Multi Gauge software.
Immunohistological staining
Two-color immunohistological staining was performed using the Envision G2 Doublestain System (Dako) as described previously 6, 10. Formalin-fixed, paraffin-embedded sections were obtained from 16 patients with NNKTL for antigen retrieval. After incubation with Dual Endogenous Enzyme Block Solution with Protein Block Serum-Free (Dako), sections were incubated with rabbit monoclonal anti-MYB (clone EP769Y; Abcam) or anti-cyclin D1 (clone EP12; Dako) antibody. After washes with PBS, sections were incubated with HRP Polymer and then stained with the 3,3′-diaminobenzidine tetrahydrochloride chromogen. For double staining, sections were also incubated with mouse monoclonal anti-CD56 antibody (Novocastra, Newcastle, UK). Next, sections were incubated with Rabbit/Mouse link and the Polymer/AP reagent. CD56 was visualized with Permanent Red Chromogen. Finally, sections were lightly counterstained with hematoxylin. When >25% of CD56-positive lymphoma cells were also MYB or cyclin D1 positive, the specimen was defined as MYB or cyclin D1 positive 24, 25. LMP1 expression was detected using mouse monoclonal anti-LMP1, clone CS1-4 (Dako) by the Envision system (DAKO) according to the manufacturer's instructions. The expression of EBV-encoded small RNA (EBER)-1 in NNKTL tissues was also assessed by in situ hybridization, as described previously 6, 8.
Statistical analysis
Two-group comparison was conducted using the Mann–Whitney U-test. Results were expressed as mean ± SD. Correlations between categorical variables were determined using the Fisher's exact test, whereas the Kaplan-Meier method was used to estimate survival curves. The statistical significance of differences in survival curves was examined using the log-rank test, and P < 0.05 was considered significant. GraphPad Prism 5.0a (GraphPad Software, San Diego, CA) was used for all statistical analyses.
Results
MiR-15a expression is reduced in NNKTL cell lines
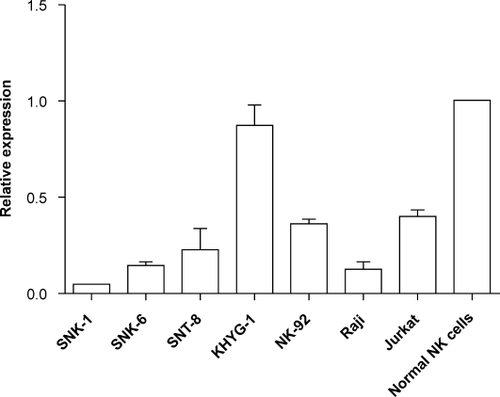
To compare miRNA expression profiles of NNKTL cell lines (SNK-1, SNK-6, and SNT-8), we first performed miRNA array analysis. The expression levels of 5 miRNAs were at least twofold lower in NNKTL cell lines (SNK1 and SNK6) than in normal NK cells and KHYG-1 cells (Table 2). Our microarray data have been deposited in the Gene Expression Omnibus (GEO) database (GEO accession no. GSE43958). Among these five miRNAs, we focused on miR-15a as a candidate because it was predicted to have a role in NNKTL lymphomagenesis by TargetScan and because previous reports indicated that miR-15a was a tumor suppressor targeting several oncogenes in various malignancies 26, 27. Quantitative RT-PCR analysis confirmed that the miR-15a expression in SNK-6, SNK-1, or SNT-8 was 3–10-fold lower than that in normal NK cells or KHYG-1 (Fig. 1).
| Chromosomal location | SNK-6 | SNK-6/normal NK cells | SNK-6/KHYG-1 | SNK-1 | SNK-1/normal NK cells | SNK-1/KHYG-1 | SNT-8 | SNT-8/normal NK cells | SNT-8/KHYG-1 | |
|---|---|---|---|---|---|---|---|---|---|---|
| miR-15a | 13q14.2 | 61.6 | 0.3 | 0.1 | 106.4 | 0.4 | 0.2 | 237.5 | 1.0 | 0.4 |
| miR-223 | Xq12 | 15.6 | 0.01 | 0.1 | 16.4 | 0.01 | 0.1 | 517.9 | 0.3 | 3.2 |
| miR-150 | 19q13.33 | 9.3 | 0.01 | 0.1 | 12.7 | 0.01 | 0.2 | 44.6 | 0.1 | 0.5 |
| miR-342-3p | 14q32.2 | 132.6 | 0.3 | 0.1 | 92.2 | 0.2 | 0.1 | 783.1 | 1.5 | 0.7 |
| miR-422a | 15q22.31 | 22.2 | 0.4 | 0.1 | 27.6 | 0.4 | 0.2 | 21.6 | 0.3 | 0.1 |
MiR-15a regulates cell proliferation by blocking G1/S progression in NNKTL cell lines
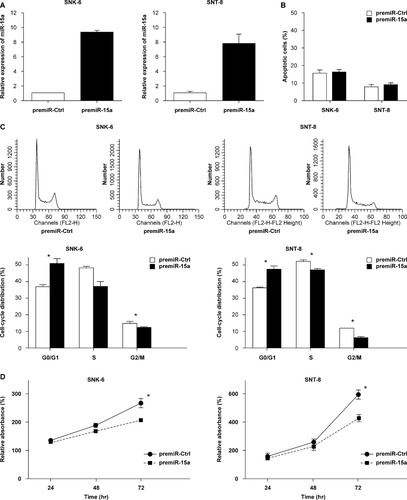
To investigate whether miR-15a has a functional role in NNKTL cell lines, we transfected premiR-15a into SNK-6 and SNT-8 cells (Fig. 2A) and performed various analyses. Apoptosis assay revealed that percentage of the apoptotic cells was not different between premiR-15a-transfected versus premiR-Ctrl-transfected SNK-6 or SNT-8 cells (Fig. 2B). On the other hand, the cell cycle analysis revealed that percentage of the cells in G0/G1 phase was significantly higher and that of the cells in G2/M phase was significantly lower in premiR-15a-transfected versus premiR-Ctrl-transfected SNK-6 and SNT-8 cells (P < 0.05; Fig. 2C). Furthermore, proliferation of the SNK-6 or SNT-8 cells transfected with miR-15a was significantly decreased at 72 h after transfection, compared to that of cells transfected with premiR-Ctrl (P < 0.05; Fig. 2D).
MYB and cyclin D1 are targets of miR-15a and are upregulated in NNKTL cell lines
Several oncogenes have been identified as targets of miR-15a in various cancers 26-28. In consideration of the esult that miR-15a affected G1/S progression in the cell cycle, but not apoptosis in NNKTL cells, we focused on MYB and cyclin D1 as target genes of miR-15a, which are reported to be directly regulated by miR-15a and modulate G1/S progression 28, 29. Western blotting confirmed that transfection of SNK-6 and SNT-8 cells with premiR-15a reduced the expression of MYB and cyclin D1 at the protein level (Fig. 3A). Notably, the expression of Cdc2/Cdk1, a downstream target of MYB that regulates the G1/S progression in the cell cycle 30, was also reduced.
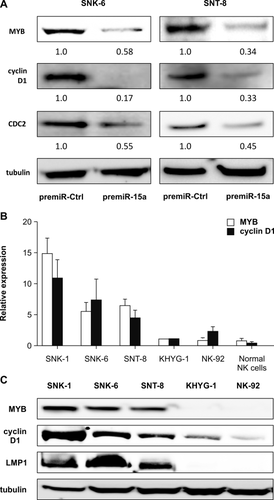
We next investigated the expression of these target genes in untransfected NNKTL cells. The quantitative RT-PCR showed that the expression levels of MYB and cyclin D1 mRNA were at least threefold higher in SNK-1, SNK-6, and SNT-8 cells than in KHYG-1 and NK92 cells (Fig. 3B). Western blot analysis further confirmed higher protein expression of MYB and cyclin D1 in SNK-1, SNK-6, and SNT-8 cells, compared to KHYG-1 and NK92 (Fig. 3C).
MYB and cyclin D1 play a role in the proliferation of NNKTL cell lines
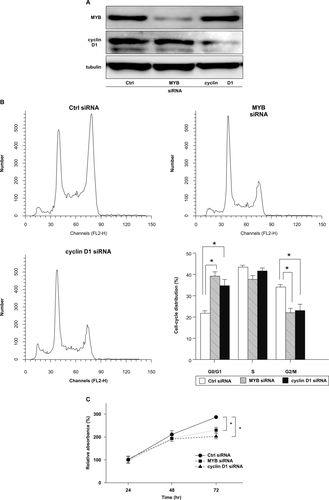
To determine the function of MYB and cyclin D1 in NNKTL cells, we analyzed the cell cycle progression and cell proliferation of SNK-6 cells transfected with either MYB or cyclin D1 siRNA. First, western blot analysis confirmed that transfection with MYB or cyclin D1 siRNA indeed reduced the respective protein expression in SNK-6 cells (Fig. 4A). Furthermore, SNK-6 cells transfected with either MYB or cyclin D1 siRNA showed G1 arrest similar to that observed in premiR-15a-transfected cells and also exhibited significant reduction of cell proliferation, compared to those transfected with Ctrl siRNA (Fig. 4B,C).
EBV-encoded oncoprotein LMP1 downregulates miR-15a in NNKTL cells
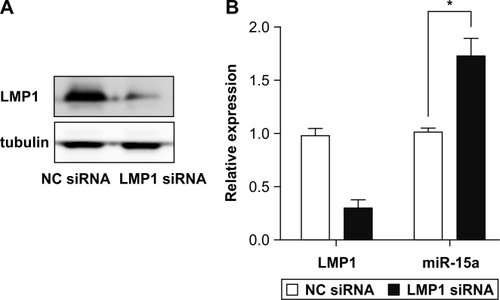
To examine whether LMP1 downregulates miR-15a expression in NNKTL cells, we transfected SNK-6 cells with LMP1 siRNA. LMP1 expression was decreased in LMP1 siRNA-transfected SNK-6 cells (Fig. 5A). Subsequent quantitative RT-PCR analysis shows that the miR-15a expression was significantly increased in the LMP1 siRNA-transfected cells (P < 0.05; Fig. 5B).
Reduced miR-15a expression correlates with higher MYB and cyclin D1 levels in NNKTL tissues and poor prognosis in NNKTL patients
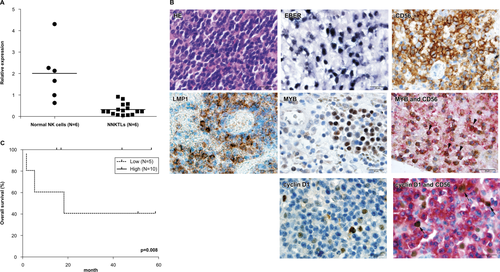
We next investigated the expression of miR-15a, MYB, cyclin D1 and LMP1 in NNKTL tissues collected from 16 patients. The quantitative RT-PCR analysis reveals that miR-15a was expressed at significantly lower levels in NNKTL tissues than in normal NK cells (P = 0.0008; Fig. 6A). Two-color immunohistological staining shows that out of 16 samples, seven (44%) and five (31%) were MYB- and cyclin D1-positive, respectively. Representative immunohistological staining micrographs of MYB and cyclin D1 are displayed in Fig. 6B. Based on the miR-15a expression level, 16 NNKTL tissue samples were divided into two groups, the low expression group (the lowest one-third of the 16 cases; n = 6) and the high expression group (n = 10). Remarkably, a significant correlation was observed between positive staining for MYB and cyclin D1 and reduced expression of miR-15a (P = 0.035; Table 3). LMP1 was expressed in seven (44%) of 16 cases tested. In the low miR-15a expression group, all cases showed LMP1-positive staining, while only one (10%) of 10 cases expressed LMP1 in the high miR-15a expression group (P < 0.01 Table 1).
| Target gene expression | miR-15a expression | P | ||
|---|---|---|---|---|
| High (n = 10) | Low (n = 6) | |||
| MYB | 0.0357 | |||
| Negative (n = 9) | 8 | 1 | ||
| Positive (n = 7) | 2 | 5 | ||
| Cyclin D1 | ||||
| Negative (n = 11) | 9 | 2 | 0.0357 | |
| Positive (n = 5) | 1 | 4 | ||
We further investigated whether the miR-15a expression level correlated with prognosis in NNKTL patients by performing the Kaplan–Meier analysis. Except one patient who did not undergo treatment, 15 patients were available for analysis. As shown in Fig. 6C, the high-miR-15a expression group demonstrated a favorable clinical course with a 5-year overall survival rate of 100%, whereas the low expression group showed an unfavorable course with 5-year overall survival rate of 25%. These results indicate a significant difference between survival of the two groups (P = 0.008).
Discussion
A tumor suppressor role of miR-15a has been previously reported in several malignancies 26-29; however, the mechanism varies according to tumor cell types. Bandi et al. 29 demonstrated that miR-15a induced cell cycle arrest in G1 phase by targeting cyclins D1, D2, and E1 in nonsmall cell lung cancer cell lines, whereas Zhao et al. 28 reported that miR-15a blocked the cell cycle in G1 phase by decreasing the MYB expression in K562 myeloid leukemia cells. Cimmino et al. 26 showed that miR-15a induced apoptosis by regulating the antiapoptotic gene BCL2 in a leukemic cell line, and Bonci et al. 27 demonstrated that miR-15a acts as a tumor suppressor in prostate cancer to control cell apoptosis, proliferation, and invasion by targeting BCL2, cyclin D1, and WNT3A.
In the present study, we showed that miR-15a was downregulated in NNKTL cells and tumor tissues. We further showed that overexpressed miR-15a in NNKTL cells induced G1 arrest and suppressed cell proliferation, but did not affect apoptosis. These data indicate that miR-15a may act as a tumor suppressor to inhibit cell proliferation by blocking the G1/S transition of NNKTL cells. In other words, reduced miR-15a expression in NNKTL cells and tissues may promote cell proliferation by activating the cell cycle.
Several reports have previously reported the role of miRNAs in NNKTL, including increased expression of miR-21 and miR-155 14, as well as reduced expression of miR-101, miR-26a, miR-26b, and miR-363 15. Yamanaka et al. 14 performed northern blot analysis on tissues of NK cell malignancies using 66 probe sets and found increased expression of miR-155 and miR-21, which resulted in the activation of the AKT pathway by downregulating PTEN and SHIP1. Ng et al. 15, on the other hand, conducted the miRNA microarray analysis on NNKTL tissues and found reduced expression of miR-101, miR-26a, miR-26b, and miR-363, which promoted the growth of an NK cell line by upregulating MUM1, BLIMP1, and STMN. In addition, Paik et al. 16 suggested that microRNA-146a downregulates NFκB activity by targeting TRAF6 and acts as a tumor suppressor with a prognostic value in NNKTL. In agreement with previous reports, our microarray analysis showed increased expression of miR-21 and miR-155, as well as reduced expression of miR-26a and miR-363, in NNKTL cell lines, compared to normal NK cells (data not shown). Notably, Ng et al. 15 also reported reduced miR-15a expression in NNKTL tissues; however, they did not investigate the function of miR-15a. To the best of our knowledge, this report is the first to clearly identify the function of miR-15a in NNKTL.
Previous studies showed that the miR-15a-miR-16-1 cluster is downregulated in chronic lymphocytic leukemia and prostate cancer due to a deletion of chromosomal region 13q14 that codes these miRNAs 27, 31. However, since the expression of miR-16, which is coded by the same region as that for miR-15a, was not downregulated (Supporting Information Fig. 1b), the loss of 13q was not likely to be the case in NNKTL patients enrolled in this study. The Janus kinase (JAK) 3-activating mutation, which is reported to play important roles for cell growth and invasion in NNKTL 32, 33, may suppress miR-15a expression via STAT5 activation. Koo et al. 32 identified JAK3 mutations, which activate STAT5 and IL-2-independent cell growth, in 23 of 65 (35%) NNKTL cases. Additionally, Li et al. 34 reported that STAT5 knock-out mice showed increased miR-15a expression in mast cells. LMP1 has also been reported to alter several cellular microRNAs in an EBV-negative Burkitt's lymphoma cell line that was transduced with an LMP1-expressing vector 35. In the present study, we clearly show that silencing LMP1 in SNK-6 cells induced miR-15a expression. Additionally, LMP1 expression was correlated with lower expression of miR-15a in NNKTL tissues. These results indicate that LMP1 may downregulate miR-15a expression. Cameron et al. 35 also found decreased miR-15a expression in the LMP1-transduced lymphoma cell line. Interestingly, LMP1 has been reported to activate protein kinase C (PKC) α 36 and proto-oncogene MYC 37, both of which suppress miR-15a expression 38, 39. Ng et al. 40 previously showed that MYC activation, which was enhanced in NNKTL, correlated with the downregulation of several miRNAs. We conducted an additional experiment to show that the PKCα expression in NNKTL cell lines was much higher than that in the EBV-negative NK cell line KHYG-1 and the EBV-positive LMP1-negative NK cell line NK-92 (Supporting Information Fig. 1c). Based on these findings, we speculate that LMP1 is most likely to repress miR-15a expression by activating PKCα and/or MYC in NNKTL.
In this study, we focused on MYB and cyclin D1 as putative target genes of miR-15a in NNKTL because both genes have been reported to be overexpressed in NK/T-cell lymphoma 41, 42. By quantitative RT-PCR and western blot analyses, we confirmed that the expression levels of MYB and cyclin D1 were higher in NNKTL cells compared to the EBV-negative NK cell line KHYG-1 and the EBV-positive LMP1-negative NK cell line NK-92. The proto-oncogene MYB is a transcription factor that regulates G1/S progression in the cell cycle via its downstream target Cdc2/Cdk1 30. On the other hand, cyclin D1 promotes the G1 to S progression by forming an active complex with cyclin-dependent kinase 4 (CDK4) and CDK6, thereby inducing the phosphorylation of retinoblastoma gene. In the present study, we demonstrate that overexpressed miR-15a reduced the expression of MYB and cyclin D1, whereas silencing of MYB and cyclin D1 resulted in an inhibition of cell proliferation inducing G1 arrest in NNKTL cells. Taken together, these data suggest that miR-15a may act as a tumor suppressor to inhibit cell proliferation by downregulating MYB and cyclin D1 in NNKTL cells. The observations from the immunohistological analysis that reduced miR-15a expression correlated significantly with the expression of MYB and cyclin D1 indicate that miR-15a may downregulate MYB and cyclin D1 in vivo.
Several researchers have investigated the usefulness of miR-15a as a predictor for disease progression and/or patient prognosis; however, the results have been hitherto controversial. For instance, low miR-15a expression was associated with poor prognosis of hepatocellular carcinoma patients 43 and correlated with disease progression in prostate cancer 27. In contrast, high miR-15a expression was found to correlate with poor prognosis in lymphocytic leukemia and multiple myeloma patients 44, 45. In the present study, we report that patients with low miR-15a expression in NNKTL tissues showed significantly worse prognosis, compared to those with high miR-15a expression, suggesting that miR-15a may be useful as a novel biological marker for predicting prognosis in NNKTL patients. Recently, Paik et al. 16 also reported that low miR-146a expression was associated with poor prognosis in NNKTL patients. Large prospective cohort studies will be necessary to confirm these results.
In summary, we show that miR-15a expression was reduced in NNKTL cell lines and tissues. MiR-15a, which may be regulated by LMP1, acts as a tumor suppressor to inhibit cell proliferation by blocking G1/S transition in the cell cycle via MYB and cyclin D1 downregulation in NNKTL cells. Moreover, we demonstrate that low miR-15a expression in lymphoma tissues was associated with poor prognosis in NNKTL patients. Taken together, our findings provide new insights into the pathogenesis of NNKTL and suggest that miR-15a may serve as not only a potential target for antitumor therapy, but also a prognostic marker for NNKTL.
Acknowledgments
The authors thank Dr. N. Shimizu (Tokyo Medical and Dental University) and Prof. E. Klein (Karolinska Institutet) for generously providing cell lines.
Author Contributions
Y.K. was the principal investigator and takes primary responsibility for the paper. K.K. and M.T. designed the study. T.N. and S.U. analyzed data. Y.H. organized the study and wrote the paper.


