Spatially resolved chiroptical study of thin films of benzo[1,2-b:4,5-b’]dithiophene-based oligothiophenes by synchrotron radiation electronic circular dichroism imaging (SR-ECDi) technique
Abstract
The study of the chiroptical properties of thin-film samples of two chiral benzo[1,2-b:4,5-b’]dithiophene-based oligothiophenes with optoelectronic properties was carried out at Diamond B23 beamline using the synchrotron radiation electronic circular dichroism imaging (SR-ECDi) facility. The experimental results support the hypothesis that the non-reciprocal circularly polarized absorption observed in these materials is due to the combined linear dichroism and linear birefringence contributions. The mapping at 50-µM spatial resolution revealed that several species coexist in the mesoscopic chiral domains likely due to different aggregated phases, which were identified in the films by SR-ECDi but could not be detected with benchtop ECD instruments.
1 INTRODUCTION
In the last two decades, organic π-conjugated small molecules and polymers have known a tremendous development as semiconducting active layers for optoelectronic and nanotechnology applications: in fact, devices such as organic photovoltaic cells, organic light-emitting diodes or organic field-effect transistors increasingly make use of thin films of π-conjugated systems as the key material.[1-5] The intrinsic physico-chemical properties of these compounds, which are instrumental to their technological applications [e.g., absorption and fluorescence features, highest occupied-lowest unoccopied molecular orbital (HOMO-LUMO) gap, electron delocalization, charge and exciton transport, and so on],[6, 7] are strongly dependent not only on the chemical structure, but also on their organization in the solid state at different levels of hierarchy, from the first-order supramolecular arrangement[8-10] to the nano/mesoscale.[11, 12] Furthermore, it is quite common to come across structural heterogeneity and local polymorphism, that is, the existence of regions with different local orders associated with different physico-chemical properties.[4, 11] The same π-conjugated material may also undergo competing aggregation pathways during thin films fabrication or post-deposition operations, leading to different aggregated phases (i.e., kinetic vs. thermodynamic states) often resulting in different optical and electrical properties.[13, 14]
Controlling molecular chirality is definitely one of the most appealing tools to harness the structural organization of organic π-conjugated systems at all hierarchical levels: the introduction of stereodefinite chiral groups in the chemical structure of these compounds can drive them to organize into more or less complex chiral supramolecular architectures, where both random twists (disordered) and the perfect cofacial stacking between adjacent π-conjugated chains are prevented in favour of a regular twist, thus generating self-assembled helices, spirals or chiral sheets.[15-20] In some cases, this first-order supramolecular chirality can also be transferred to larger nano/mesoscale chiral structures such as helical fibres or twisted ribbons.[16, 21] Furthermore, chiral organic semiconductors have recently paved the way for highly innovative optoelectronic devices exploiting the interaction with circularly polarized (CP) light.[5, 14, 22-24]
Instrumental techniques able to identify and characterize the aggregated states occurring in thin films of organic π-conjugated materials at different length scales are fundamental for clarifying and also predicting structure-property relationships.[11, 12, 25] Electronic circular dichroism (ECD) spectroscopy is a key tool for the study of supramolecular organization of chiral π-conjugated systems in solution and solid state: the appearance of ECD signals is very sensitive to the reciprocal arrangement of adjacent chromophores, thus providing information about their structural organization at the nanometric scale.[26-29] Moreover, ECD spectroscopy appears very convenient to detect the presence of multiple aggregation pathways associated with different aggregated phases, often very difficult to identify through UltraViolet-Visible (UV-Vis) absorption as characterized by similar optical responses.[13] Increased computer power and the development of sophisticated computational models added further fuel to this powerful engine.[30]
In the typical instrumental setup of a benchtop ECD spectropolarimeter, the light beam generally samples an area of ∼1 cm2: therefore, the emergent ECD spectrum provides only average chiroptical properties, mediated on a quite large area. Whereas this is not a problem for isotropic and homogeneous samples such as solutions, it has a clear impact on anisotropic solid samples such as pellets or thin films, where the structural information allied to individual local domains is entirely lost. Microscopy techniques such as atomic force microscopy, scanning electron microscopy and transmission electron microscopy are ideal to characterize film morphology down to the 10–100 nm scale,[31] but they can hardly provide insight into the supramolecular organization of the molecules at the first level of hierarchy (1–10 nm). An appealing solution is the fusion between these two levels of analysis: ECD, providing geometrical information on chiral supramolecular aggregates with no spatial resolution, and microscopy, affording spatially resolved images at microscopic level without insights into the aggregation at the first level of hierarchy.
Although the idea of an ECD microscope was introduced in 1982,[32] the first dedicated instrumental setups[32, 33] suffered from the persistent presence of parasitic contributions due to sample heterogeneity.[34] The development of spatially resolved Mueller matrix techniques represents definitely an important strategy for spatial mapping and disentangling of circular and linear anisotropies in thin films.[35-37] On the one hand, custom-built Mueller matrix polarimetry microscopes[38] have found successful applications in the study of polycrystalline spherulites of D-sorbitol[34] and of conjugated polymers.[39] On the other, commercial benchtop ellipsometers have been successfully applied for spatially resolved Mueller matrix spectroscopic ellipsometry measurements,[40] with successful applications in the 2D-investigation of thin films of chiral π-conjugated small molecules[41, 42] and polymers.[43] Other techniques have been more recently developed, based on two-photon fluorescence scanning confocal microscopy,[44] scanning near-field optical microscopy[45, 46] or synchrotron radiation ECD (SR-ECD).
In fact, the highly collimated SR of Diamond Light Source B23 beamline[47-49] recently allowed for the development of a highly innovative technique able to fill the gap between standard ECD spectroscopy and conventional microscopy, named synchrotron radiation ECD imaging (SR-ECDi).[50] In contrast with all other ECD microscopy techniques mentioned above, SR-ECDi is based on the collection of local ECD spectra for each pixel of a selected grid array area, mapped with a motorized XY stage having spatial resolution down to ∼0.0025 mm2. These local ECD spectra can then be processed into maps showing the ECD intensity at a selected wavelength versus x–y coordinate. Although the result is similar to other ECD microscopy methods, SR-ECDi takes full advantage of the complete circular polarization of SR light attaining the lowest limit of quantitation with maximum accuracy of ECD signals. We recently demonstrated the application of SR-ECDi in the context of chiral organic semiconductors, as a superior technique in the study of local supramolecular structures in thin films of chiral π-conjugated systems,[50, 51] and also in the context of chiral active pharmaceutical ingredients, getting insight into the distribution of a model microcrystalline solid (Finasteride) into KCl pellets.[52]
In the last years, we studied in detail the (chiro)optical properties in thin films of a series of oligothiophenes bearing enantiopure 3,7-dimethyl-1-octyl or 2-methyl-1-butyl alkyl chains as chiral element.[58-63] In particular, for a family of structurally-related benzo[1,2-b:4,5-b’]dithiophene (BDT)-based oligothiophenes, including compounds 1 and 2 (Figure 1), we found that they can give rise to distinct supramolecular structures with chiroptical properties due to isotropic CDiso and non-reciprocal LDLB that were dependent on the nature of chiral pendant group, the length of π-conjugated backbone, and the deposition technique such as drop casting and spin coating.[59] Although a complete understanding of their different chiroptical behaviour, ranging from a pure intrinsic CDiso to an almost complete non-reciprocal CP absorption, is still far from being completely achieved, it is clear that a major role is played by local supramolecular structures. Therefore, the spatially resolved chiroptical investigation by SR-ECDi technique, taking advantage of the extremely bright, stable and well-collimated SR light of Diamond Light Source B23 beamline, might cast new light on the structure-chiroptical features relationship of these systems.
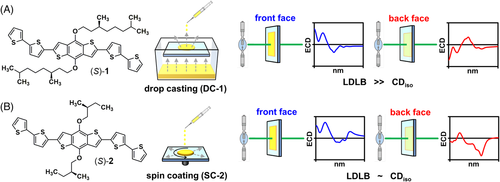
Herein, we applied the SR-ECDi technique to study two thin-film samples of chiral BDT-based oligothiophenes 1–2 showing different chiroptical behaviour with benchtop ECD spectropolarimeter: (a) Drop casted film of 1 (DC-1), obtained by drop casting a solution of oligothiophene 1 in CH2Cl2, characterized by a predominant LDLB contribution (Figure 1A); (b) spin-coated film of 2 (SC-2), fabricated by spin coating a solution of oligothiophene 2 in CH2Cl2, resulting in comparable contributions from LDLB and CDiso (Figure 1B). For each sample, the surface of both the front and back sides has been mapped using a focused beam diameter that could be tuned from 0.1 mm to 0.05 mm, thus obtaining 2D colour maps showing the ECD intensity at a selected wavelength versus x–y coordinate, which has been compared with the corresponding optical microscopy images. The current study allowed us to observe the concurrence of CDiso and LDLB effects for the first time on a 50-µM scale and to demonstrate that it is allied with local birefringent aggregate domains with sub-mm size. Moreover, we revealed the co-existence of different aggregation modes for different local domains from the same thin films. Both pieces of information are unattainable by using standard ECD spectroscopy or microscopy.
2 RESULTS AND DISCUSSION
The two chiral BDT-based oligothiophenes 1–2 investigated in the present work were recently synthesized in good yields from benzo[1,2-b:4,5-b’]dithiophen-4,8-diol by a versatile three-steps protocol based on alkylation with the chiral bromide, bromination and Suzuki-Miyaura cross-coupling reaction.[58, 59] The detailed preparation scheme and the full characterization of these compounds is reported in our previous publications.[58, 59]
We prepared thin films by depositing their CH2Cl2 solutions onto transparent glass plates. DC-1 samples were obtained by drop casting technique depositing about 100 µL of 1.0 × 10⁻³ M CH2Cl2 solution followed by slow solvent evaporation in a closed chamber saturated with CH2Cl2 vapours. SC-2 samples, on the other hand, were prepared by spin coating technique depositing about 100 µL of 2.0 × 10⁻² M CH2Cl2 solution with anticlockwise angular speed of 1000 rpm.
According to our previous investigations,[58-63] these deposition conditions provided in all cases stable films with reproducible and intense ECD spectra. These samples were chosen because of their different chiroptical response, while sharing very similar chemical structures and spectroscopic features (absorption spectra). All the films showed a thickness of roughly 100 nm (measured by means of a profilometer) and appeared visually semi-transparent.
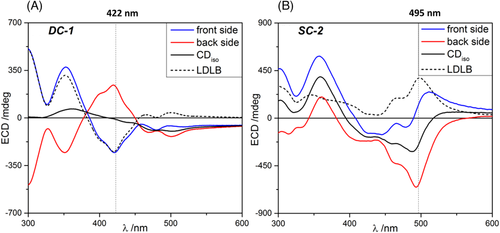
The chiroptical properties of the two thin-film samples were first investigated using a benchtop Jasco J-710 ECD spectropolarimeter (Figure 2), reproducing what found in our previous publications.[58, 59] DC-1 showed a strong non-reciprocal CP absorption with an almost complete inversion of the ECD spectral profile upon sample flipping from front to back face (Figure 2A), as a result of predominant LDLB contribution (LDLB ≫ CDiso). This is evident from the dissymmetry factor gabs values measured for the bands at 422 nm and 300 nm in the front and back geometry (Table 1). Less precisely inverted is instead the band at 352 nm as well as the long-wavelength tail, which is mostly due to differential scattering. Samples of 1 obtained by spin coating (SC-1) showed very similar behaviour to DC-1.[59] In the case of SC-2, the ECD profiles recorded for the front and the back sides were quite different, although not mirror image of each other (Figure 2B), suggesting comparable contributions from LDLB and CDiso. This is again confirmed by the dissymmetry factors gabs measured at 365 and 495 nm (Table 1). Samples of 2 obtained by drop casting (DC-2) exhibited no LDLB effect.[59] It must be noted that the J-710 spectropolarimeter outputs ellipticities rather than directly CD; however, the two quantities are strictly proportional for CD < 0.5 rad (approximately 28000 mdeg),[41] which is definitely the case for all our spectra. Therefore, throughout the manuscript, we refer to all spectra as ‘CD’, although ellipticities (mdeg) are reported on the Y axis.
| Sample | λ (nm) | gabs front side | gabs back side | ∫|LDLB|/∫|CDiso| |
|---|---|---|---|---|
| DC-1 | 422 | −7.8 × 10⁻³ | +7.7 × 10⁻³ | 2.01 |
| 352 | +1.8 × 10⁻² | −1.8 × 10⁻² | ||
| 300 | +1.8 × 10⁻² | −1.1 × 10⁻² | ||
| SC-2 | 495 | +9.7 × 10⁻³ | −2.2 × 10⁻² | 1.03 |
| 365 | +3.3 × 10⁻² | +2.1 × 10⁻² |
For each sample, a more quantitative comparison between CDiso and LDLB contributions was obtained by considering the integrated area for the absolute value of semi-sum (∫|CDiso|) and semi-difference (∫|LDLB|) calculated spectra. The values reported in Table 1 (rightmost column) confirm once again a substantial difference between the two films, one prepared by drop casting and the other by spin coating.
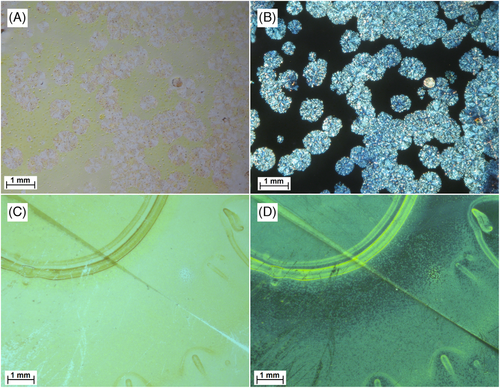
All films were characterized by optical microscopy, performed with non-polarized light and under cross-polarized filters (Figure 3). In the case of DC-1 (Figure 3A,B), micrographs clearly revealed strongly birefringent spheroidal domains with a diameter of about 500 µM, standing out on a background with no LB: a result definitely correlated[58, 59] with the strong LDLB contribution observed for this sample. Sample SC-2 (Figure 3C,D) showed on the other hand a more homogeneous texture, attributable to the use of spin coating as deposition method, consisting of small grain-like domains (having dimension of few microns) characterized by a moderate degree of birefringence. A circular border is also clearly recognizable in the same microscopy images, which significantly differs from the aforementioned texture and was generated by the shear stress associated with the sample rotation during spin coating.
Apart from the above information, optical microscopy images can hardly provide insight into the supramolecular organization of the molecules at the first level of hierarchy, as well as the co-existence of concomitant aggregation pathways associated with different aggregated phases. Therefore, we took advantage of the SR light of Diamond Light Source B23 beamline to carry out a spatially resolved chiroptical investigation of these thin-film samples by SR-ECDi technique.
For both front and back face of thin films, a 31 columns by 31 rows grid array with 0.1 mm step size was mapped at fixed wavelength of 422 nm for DC-1 and 495 nm for SC-2.
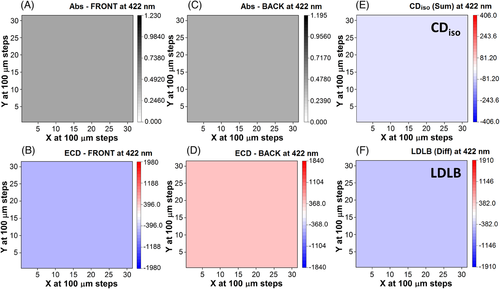
For DC-1, a total of 961 individual points were measured using the B23 beam light with size focused at 0.05 mm in diameter on the thin film surface, from which 2D maps were generated for both absorbance (Figure 4A,C) and SR-ECDi data (Figure 4B,D). The chosen wavelength (422 nm) corresponds in the standard ECD spectrum (Figure 2A) to the maximum intensity of a negative band for the front face and a positive band for the back face. The calculation of the CDiso and LDLB terms was carried out first by manipulating the matrix from which the back face orientation was scanned, that is, by constructing the flipped matrix where column 31 became 1, and column 30 became 2 and so forth. Basically, the matrix was rotated around column 16. In this manner, the flipped back face orientation could be added and subtracted from the 31 × 31 data matrix of the front face orientation. The sum and difference divided by 2 gave rise to the 2D maps of CDiso (Figure 4E) and LDLB (Figure 4F), respectively.
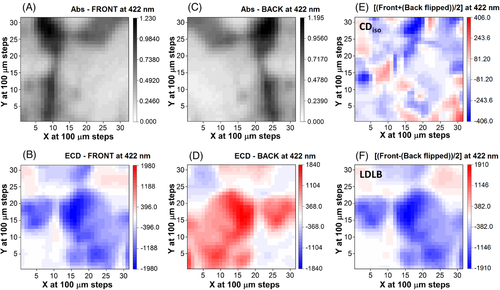
In both front and back orientations, the 2D SR-ECDi maps of DC-1 (Figure 4B,D) revealed spheroidal domains of diameter up to 2 mm with strong SR-ECD intensity, negative for the front side and positive for the back side. They were standing out from the background with weak dichroic signals. These domains were consistent with those observed with cross-polarised optical microscopy showing strongly birefringent spheroidal structures (Figure 3B). Interestingly, these spherical domains were not visible in absorbance from unpolarised light (Figure 4A,C) highlighting again the essential role of SR-ECDi imaging technique. The spheroidal domains can be considered responsible for the strong LDLB of the global ECD spectrum of DC-1, while the background provides only a weak CDiso contribution. These results support the hypothesis suggested in our previous study for this class of BDT-based oligothiophenes,[58, 59] demonstrating that the strong non-reciprocal CP absorption was due to the combined effect of LD and LB, i.e. the LDLB term (Figure 4F) arising from single local meso-domains in the film of DC-1.
In Figure 5, the images generated from the average intensities of the 31 × 31 grid matrices used in Figure 4 illustrate how the maps would appear using benchtop ECD instruments rather than B23 beamline and demonstrate they will be unable to address the heterogeneity of the thin films of chiral molecules at mm and sub-mm scale.
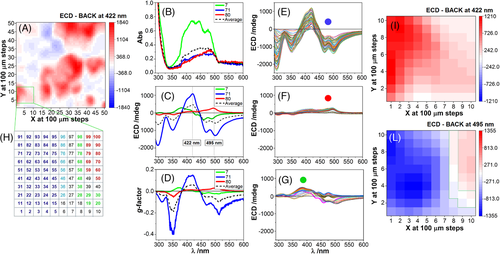
From a larger 2D map of 50 × 50 grid measured at fixed wavelength of 422 nm (Figure 6A), a smaller area of 10 × 10 grid at 0.1-mm intervals was investigated scanning 100 spectra in absorption (Figure 6B) and SR-ECDi (Figure 6C) in the 290–600 nm region. The corresponding dissymmetry g-factors (Δε/ε, or ECD[mdeg]/[33000·Abs]) are also plotted (Figure 6D) for some selected traces as well as for the average. The single value decomposition (SVD) analysis identified three distinct ECD component spectra. The three groups of spectra were labelled with red, green and blue colour scheme, and their position highlighted in the 10 × 10 grid (Figure 6H) according to their coordinates in Figure 6A. The most intense ECD spectra of the ‘blue family’ (Figure 6E), with negative bands at 350, 469 and 501 nm, and positive band at 420 nm, are associated with the inner part of the spheroidal domains and with large LDLB effects (Figure 6H). The bundle of spectra in Figure 6E, corresponding to the first five columns (on the left) in panel 6H, demonstrates a large variation in the “blue region” of the film. The same occurs in the “green region” (Figure 6G), while the “red region” is more homogeneous (Figure 6F). The chosen wavelength to generate the 2D map from the 100 spectra is of prime importance as the map from 422 nm (Figure 6I) appears to be made of a single component whereas that from 495 nm (Figure 6L) is associated with three distinct components. In summary, Figure 6I would be misleading as it would suggest substantial homogeneity in terms of chiroptical properties, whereas Figure 6L revealed the true picture of sample DC-1 with the three species likely to be associated with multiple and distinct aggregation modes.
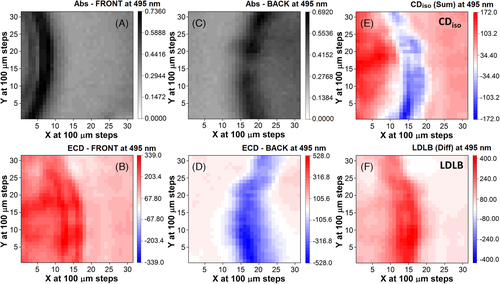
The SR-ECDi mapping of the SC-2 thin film was conducted at 495 nm (Figure 7), the maximum intensity of the negative band (gabs = −2.2 × 10⁻²) for the back face, and corresponding to a weak positive ECD (gabs = +9.7 × 10⁻³) for the front face orientation (Figure 2B). Like for Figure 4, the 2D maps of a 31 × 31 grid at 0.1-mm intervals of the CDiso (Figure 7E) and LDLB terms (Figure 7F) were calculated from the sum and difference of the flipped matrix of the back side orientation (Figure 7D) to that of front side of SC-2 and divided by 2 (Figure 7B). The maps captured a portion of the circular border seen in the microscopic images (Figure 3C,D). SR-ECDi maps helped in differentiating the contribution of the border with respect to the inner and outer regions. In particular, for the back side (Figure 7D), the circular border region was associated with strong negative SR-ECDi values, standing out on a background with negligible dichroic signals. This border effect is rather interesting, as it seems able to generate strong ECD signals, and it may only be appreciated by a mapping technique with sub-mm resolution.
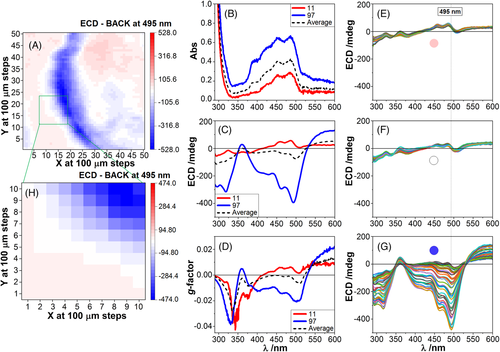
Analogously to Figure 6, from a larger 2D map of 50 × 50 grid measured at 495 nm (Figure 8A), a smaller area of 10 × 10 grid at 0.1-mm intervals was investigated scanning 100 spectra in absorption (Figure 8B) and SR-ECDi (Figure 8C) in the 290–600 nm region; the g-factor was evaluated as well (Figure 8D) for selected traces. Three groups of spectra were labelled with red, white and blue colour scheme, and their position highlighted in the 10 × 10 grid (Figure 8H) according to their coordinates in Figure 8A. In terms of SR-ECDi profiles, the red and white labelled spectra (Figure 8E,F) were very similar and can be grouped together as the same species. The “blue region” yields a bundle of spectra with more pronounced variation (Figure 8G). The SVD analysis indicated two main distinct species to be present in the grid area investigated in Figure 8H. They were consistent with the two distinct groups of SR-ECDi spectra (Figure 8C) and their corresponding g-factor spectra (Figure 8D). The first spectral family (white-red), associated with the film portion outside the ring, is weaker and characterized by positive bands at 464 and 493 nm. The second one (blue family), associated with the ring, is stronger and characterized by a broad negative band between 380 and 420 nm. They clearly belong to different aggregation modes: the first covers a wider surface of the film, the second concentrates in the circular fringes created by the spin coating.
Despite the chemical and spectroscopic similarity between the two samples, DC-1 and SC-2, their supramolecular structure and aggregates in thin films appear nevertheless significantly different. These differences, which arise from the long/branched and short/linear chiral (S)-alkyl groups of the benzo[1,2-b:4,5-b’]dithiophen-4,8-diol moiety, are promptly revealed with SR-ECDi imaging at high spatial resolution.
3 CONCLUSIONS
In the present work, we took advantage of the extremely bright, stable and well-collimated SR light of Diamond Light Source B23 beamline to characterise the chiroptical properties of two thin films of chiral BDT-based oligothiophenes 1 and 2. Despite their chemical similarity, the flanking long/branched and short/linear chiral alkyl groups showed two different supramolecular behaviours exhibited in the drop-casted DC-1 and spin-coated SC-2 films, respectively. SR-ECDi technique of B23 beamline at high spatial resolution revealed superior capability to provide information on both size and nature of the aggregation modes of these thin film samples than with benchtop ECD instruments. It is important to note that this achievement was possible thanks to the combination of full spectra and 2D maps at single wavelength scanned at high spatial resolution. In the case of DC-1, showing a pure non-reciprocal CP absorption with LDLB ≫ CDiso, the SR-ECDi technique allowed us to confirm that LDLB was indeed due to the combined effect of LD and LB of single meso-domains in the film at the highest spatial resolution of 50 µM. On the other hand, SC-2 showed a comparable contribution of the LDLB and CDiso terms. Interestingly, both thin films revealed an intrinsic structural heterogeneity, which would pass unnoticed by standard techniques, due to the presence of more than one form of aggregates: three for DC-1 and two for the SC-2 that were detected at high resolution, unattainable using benchtop ECD instruments. SR-ECDi technique is a powerful tool in the study of aggregated phases of chiral organic π-conjugated materials and chiral thin films in general, especially in the presence of complex chiroptical phenomena. The use of SR-ECDi can provide useful information for the optimisation of the parameters to obtain reproducible supramolecular structures in aggregates of thin films, with the aim to control active layers morphology. Moreover, through its focused view on the first-order supramolecular structure of molecular aggregates, it can assist one in the rationalization of their chiroptical properties.
4 EXPERIMENTAL SECTION
4.1 Thin film preparation
DC-1 samples[59] were prepared by drop casting. About 100 µL of a 1.0 × 10⁻³ M CH2Cl2 solution of the oligothiophene 1 was deposited dropwise on a quartz plate, followed by slow evaporation in an atmosphere saturated with CH2Cl2 vapours. SC-2 samples[59] were prepared by spin coating. About 100 µL of a 2.0 × 10⁻² M CH2Cl2 solution of the oligothiophene 2 was deposited on a quartz plate, using a WS-400B-6NPP-LITE or a WS-650HZ-23NPP-LITE (Laurell Technologies Corp., North Wales, PA, USA) spin coater. Conditions: 1000 rpm, 30 s, acceleration 1000 rpm/s. The preparation of all thin film samples was optimized to obtain an optical density ranging between 0.4 and 0.6 at the maximum absorbance wavelength.
4.1.1 Microscopy
Optical microscopy images of thin films were obtained at room temperature using a ZEISS SteREO Discovery.V8 microscope provided with cross-polarized filters and equipped with a camera Canon PowerShot A640.
4.1.2 ECD measurements
ECD spectra were recorded at room temperature using a Jasco J-710 spectropolarimeter. In all cases, five independent thin film samples were prepared and subjected to full ECD analysis. In the first place, invariance of ECD amplitudes upon sample rotation was assessed by sample rotation through successive 45° increments around the optical axis normal to the film surface. In all rotations, we did not observe any significant spectral variations. For each sample, two ECD spectra were then recorded: one with the organic film facing the light source (front face) and one with the organic film facing the detector (back face). Each ECD spectrum was normalized to the maximum absorbance to eliminate sample inhomogeneity. The semi-sum and semi-difference of front and back ECD spectra were calculated to obtain CDiso and LDLB respectively, as described in Equations (1) and (2).
4.1.3 SR-ECDi measurements
SR-ECDi experiments were performed under N2 purging using the end-station B spectrophotometer available at B23 beamline for SR-ECD of Diamond Light Source, Ltd (Didcot, UK).[39] The beam light was positioned in the vertical measurement chamber using a motorized XY stage. For each thin film sample, local ECD signals at a fixed wavelength were recorded by scanning various grid array areas with 0.2-mm step size, using a beam diameter ranging between 0.05 mm and 0.1 mm. For the 50 × 50 maps, the measurement time for each pixel was 1.5 s (overall time 1 h per map). For the 290–600 nm scans, the following conditions were employed: step 1 nm; integration time 0.1 s; scan speed 125 nm/min; measurement time per pixel, 2.5 min; overall time, 6 h. The CD signal was extracted from the Mueller matrix elements by CD = (l03+l30)/2 and converted into ellipticity θ by the formula θ = CD/2, which is valid when CD < 0.5 rad (approximately 28,000 mdeg).[41] The obtained results were then processed using CDApp.[49]
ACKNOWLEDGEMENTS
Access to Diamond Light Source B23 beamline for SRCD was granted under awarded proposal SM17621. Marcin Górecki thanks the Bekker Program from the Polish National Agency for Academic Exchange (NAWA). Ministero per l'Università e la Ricerca (MUR) is acknowledged for funding through PRIN project 20172M3K5N.
CONFLICT OF INTEREST
The authors have no conflict of interest to declare.
Open Research
DATA AVAILABILITY STATEMENT
Data available on request from the authors.


