Accurate and sensitive probing of onset of micellization based on absolute aggregation-caused quenching effect
Abstract
Probing the onset of micellization, or determining the critical micelle concentration (CMC), is of crucial importance while remains to be challenged by growing demand for extraordinary sensitivity and accuracy. Although fluorometry has attracted wide attention owing to its superiority in simplicity and sensitivity over other methods, the presence and fluctuation of background fluorescence of conventional fluorescent probes undermine the accuracy of CMC determination. Herein, a series of novel fluorescent probes without background fluorescence at a concentration below CMC owing to absolute aggregation-caused quenching (aACQ) are utilized for sensitive and accurate measurement of CMC. The aACQ probes aggregate spontaneously and instantly in an aqueous environment owing to molecular π–π stacking with fluorescence quenching absolutely. Therefore, the absence of background fluorescence at a concentration below CMC clears relevant interference associated with conventional fluorophores. In this study, the new method is applied for versatile surfactants with CMCs ranging from nanomolar to millimolar concentrations, especially copolymers with ultralow CMC. The higher sensitivity and accuracy are highlighted by comparison with conventional probes.
1 INTRODUCTION
In recent decades, amphiphilic materials have attracted much attention owing to their wide applications in areas such as catalysis, materials science, drug delivery, and so forth, with the specific micellar forming characteristics.[1-5] However, micellar formation of amphiphiles only occurs at a unimer concentration above a definite threshold, that is, the critical micelle concentration (CMC). It is generally acknowledged that amphiphiles present as unimers at a concentration below CMC and start to self-assemble spontaneously to form micelles with specific core-shell structures under the drive of hydrophobic forces at a concentration above CMC.[6, 7] Micellization remarkably changes the physicochemical properties of the bulk colloidal system. Hence, it is of critical importance to accurately determine the corresponding CMC of amphiphiles. This remains a hot topic in physical chemistry, analytical chemistry, and drug delivery.[8-11]
CMC determination is by far mainly based on catching the steep changes in physicochemical properties of the bulk solution of amphiphiles such as surface tension, conductivity, light scattering, UV/Vis spectra, fluorescence, and so on upon micelle formation.[12-15] Nevertheless, there are no official methods available for universal determination of CMC because each method has its own operation requirements and scope of applications, as well as limitations. For example, conductometry is not applicable for non-ionic surfactants and ionic surfactants with small aggregation numbers owing to the low, even undetectable, conductivity or lack of easily identifiable changes in the conductivity versus concentration curves.[16, 17] Tensiometry seems to be well suited for both ionic and non-ionic surfactants, whereas evaporation of surfactants, time consumption, the requirement of a professional instrument, tedious operation, and sensitivity to highly surface-active impurities restrict its applications.[15, 18, 19] Among all methods, fluorometry is preferred and applied widely owing to simplicity, universality, and high sensitivity.[11, 20, 21] In recent decades, numerous functional probes have been developed and applied for CMC determination, such as coumarins, iodine, DiO, carbon dots, pyrene, as well as probes with aggregation-induced emission (AIE) properties.[13, 21-26]
Although these probes show promises in determination of approximately millimolar level CMC of common surfactants, probing the onset of micellization of amphiphilic copolymers with ultralow CMC (<μM) remains a challenge.[27-29] Reluctantly, overestimated values with high variance are always recorded for ultralow CMC of amphiphiles.[30-32] This is mainly ascribed to the intrinsic high fluorescence background of the probes utilized in an aqueous environment which is reflected in the CMC determination curve as high and fluctuated baseline fluorescence in the below-CMC region (Figure 1A,B). Conventional probes commonly work at a relatively high concentration (near to the micromolar or above), for example, 2 μM for pyrene, 0.25 μM for DPH, 0.45 μM for coumarin, and 10 μM for DiO.[13, 21, 24, 33, 34] In the case of ultralow CMC, the fluorescence intensity is always too low to feature a clear turning point owing to low quantum yields of conventional probes, as well as the interference of high and fluctuated baseline originated from free probes.[9, 35-37] In addition, the poor stability against light (coumarin, DPH, and Nile red), oxygen (pyrene), or salinity (Nile red) may complicate sample handling, incur extra errors in fluorescence measurement and thereby undermine the accuracy of CMC determination.[38-42]
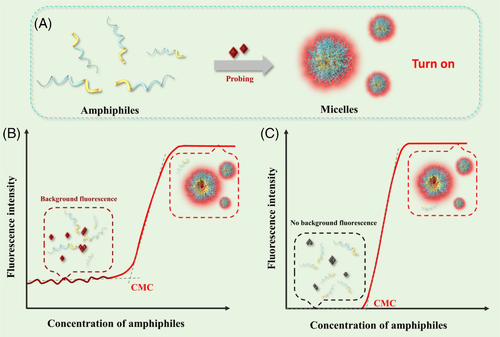
The aggregation-caused quenching (ACQ) effect, which refers to the phenomenon that highly emissive fluorophores become weakly emissive or non-emissive upon aggregation by π–π stacking due to the formation of nonradiative charge-transfer complexes, may reduce background fluorescence to some extent.[43-45] However, the ACQ effect is generally not absolute for most conventional probes, owing to which fluctuated background fluorescence exists and causes certain interference when applied to the determination of CMC. Previously, we reported a series of near-infrared aza-BODIPY fluorescence probes for accurate in vivo tracing of various nanocarriers and found that the fluorescence of these probes could be quickly and absolutely quenched.[46] Here, we term these probes as absolute ACQ (aACQ) probes. We envision that, high accuracy and sensitivity in CMC determination can be achieved by utilizing these aACQ probes, owing to the absence of background fluorescence at an amphiphile concentration below CMC which renders the interference associated with conventional probes reduced to the minimum (Figure 1C). This method is simple, easy to operate, more accurate than conventional fluorometry, and universally applicable for all kinds of surfactants or amphiphiles, including copolymers with ultralow CMC. Moreover, the high chemical and photo-stability of the fluorophores utilized confers this method superior robustness.
2 RESULTS AND DISCUSSION
2.1 aACQ versus commercial probes for CMC determination
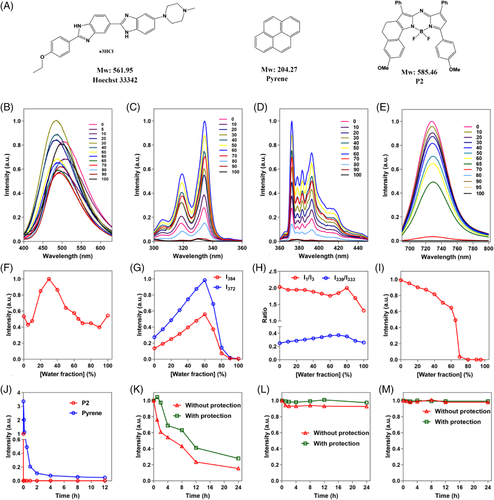
P2, a previously reported aACQ probe, was utilized as an exemplification.[46-48] Meanwhile, Heochst 33342, a commercial probe with “practically no emission in water” as described in literature, and pyrene, the mostly utilized probe for CMC determination by far, were investigated as comparisons.[49] The molecular structural formulas and absorptive/emissive spectra of the three fluorescence probes are shown in Figure 2A and Figure S1. The maximum absorptive/emissive wavelengths of Heochst 33342 and pyrene fall within the ultraviolet and visible light region, while P2 has longer maximum absorptive and emissive wavelengths in the near-infrared region. Pyrene has polarity-sensitive vibrational bands distinct from Heochst 33342 and P2 in its emissive spectrum in the form of five predominant peaks at 372, 379, 384, 388, and 393 nm, respectively.
2.1.1 Water quenching properties
As CMC determination by fluorometry is based on observation of the onset of fluorescence changes−intensity or wavelength−upon transferring of probe molecules from the continuous aqueous phases to the micellar microenvironment, negligible background fluorescence of probes is believed to reduce interference and thus benefit accuracy and sensitivity. Therefore, the water-quenching properties of Heochst 33342, pyrene, and P2 are investigated and compared first. Figure 2B–E shows the fluorescence response of Heochst 33342, pyrene, and P2 in binary acetonitrile/water mixed solvent as a function of water fraction, respectively. The Heochst 33342 fluorescence of the bulk system changes following a “W” type pattern in response to increase of water fraction (Figure 2F). In general, Heochst 33342 exhibits relatively strong fluorescence, irrespective of water fraction, which however contradicts with such description of “practically no emission in aqueous solution” in literature.[49] The pyrene fluorescence intensifies gradually with increase of water fraction up to 60%, but drops rapidly afterwards (Figure 2G). At a water fraction of over 90%, weak emission or excitation of pyrene is observed, which is mainly ascribed to the aggregation-caused quenching effect. We further investigated the water sensitivity of two parameters of pyrene commonly utilized for CMC determination, that is, I339/I333 (fluorescence intensity ratio upon excitation at 339 or 333 nm, respectively) and I1/I3 (fluorescence intensity ratio upon emission set to 372 (I1) and 384 nm (I3), respectively). The two parameters show a progressive, rather than steep, change in response to the increase in water fraction, probably due to the similar polarity between acetonitrile and water (Figure 2H).
On the contrary, the P2 fluorescence gradually attenuates with the increase of water fraction up to 65%, then abruptly decreases and finally vanishes at a water fraction above 80% (Figure 2I). The fluorescence quenching of P2 is instant and absolute when encountered with water, while pyrene fluorescence quenches much slower (Figure 2J). Compared with Heochst 33342, P2 and pyrene show much higher photo-stability against light (Figure 2K–M). Interestingly, Heochst 33342 in acetonitrile shows a gradual decrease of fluorescence even under the protection from light, which is possibly ascribed to its poor chemical stability or aggregation. A slight decrease of pyrene fluorescence is observed, while P2 fluorescence remains constant for a long period with or without protection from light owing to the excellent photo-stability of aza-BODIPYs.
2.1.2 CMC Determination via Heochst 33342, pyrene, and P2
We first applied three probes for probing the onset of micellization of Triton X100, a common nonionic surfactant with a CMC value near to 0.2 mM (Figure 3A–D). Figure 3E reveals a strong background fluorescence of Heochst 33342 at a Triton X100 concentration below its CMC and a gradual increase of fluorescence upon micellization. The inflection point is hard to determine, partially owing to the high fluorescence background as well as the difficulties in encapsulation of the hydrophilic probes into the hydrophobic micellar cores.
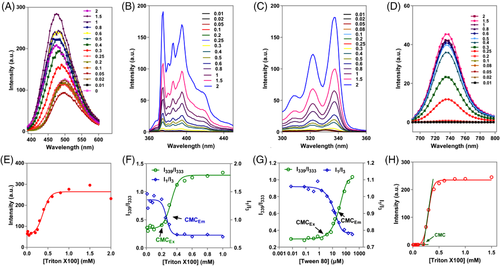
Figure 3B,C,F shows the results of CMC determination based on pyrene. As reported, the CMC of amphiphiles could be determined by monitoring of the excitation spectra (I339/I333) or emission spectra (I1/I3) of pyrene in an aqueous solution. The plot of I339/I333 versus concentration of Triton X100 gives an inflection as CMCEx, while the plot of I1/I3 gives a center point of fitting sigmoid, which is widely recognized as CMCEm.[11, 37] Although both CMCEx and CMCEm are ≈0.23 mM for Triton X100, it is noteworthy that CMCEm are actually overestimated CMC values, especially for amphiphiles with low CMCs (<1 mM).[37, 50] In contrast, CMCEm are generally believed to be more sensitive values than CMCEm.[11, 51, 52] This is also demonstrated by the fact that the obtained CMCEx of 4.66 μM is much lower than CMCEm of 15.3 μM for Tween 80 in this study (Figure 3G). Consequently, CMCEx, rather than CMCEM, is adopted for other amphiphiles in the following investigations.
The profiles of fluorescence spectra and corresponding fluorescence intensity of P2 versus Triton X100 concentration are shown in Figure 3D,H. With the concentration of Triton X100 increasing, P2 initially shows no emission due to the aACQ effect in water, but starts to emit strong fluorescence at above-CMC levels. The plot of P2 fluorescence versus Triton X100 concentration follows a sigmoidal pattern with each stage corresponding to a progressive period of probe state, that is, no encapsulation, partial encapsulation, and total encapsulation of probes in the micellar cores (Figure 3H). Therefore, the CMC value could be determined by calculating the inflection point of the fitted sigmoid curve through a tangential method.[53] The obtained CMC for Triton X100 based on P2 is 0.20 mM, which is in accordance with the results obtained by pyrene (0.23 mM) as well as reported values (0.2–0.25 mM).[13, 22, 54]
2.2 CMC determination of commercial surfactants via aACQ probes and pyrene
2.2.1 P2 versus pyrene for CMC determination
Thanks to its high fluorescence stability as well as instant and absolute fluorescence quenching as mentioned above, CMC determination via P2 exhibits high robustness. Figure 4A shows the profiles after the samples are kept standing for 0, 12, and 24 h, respectively, without any protection (e.g., from oxygen and light). The result reveals that standing for at least 24 h has little influence on the fluorescence intensity and the determined CMC. Moreover, a clear linear relationship between P2 fluorescence and Triton X100 concentration is observed upon dilution by deionized water or quenched P2 dispersion (Figure 4B,C). And the P2 fluorescence quenches absolutely when the concentration of Triton X100 decreases to near 0.2 mM. Based on the intercept point between the regression line and the X-axis, the CMC value of Triton X100 is recorded as 0.19 or 0.21 mM via dilution by deionized water or aqueous P2 suspension, respectively, after samples are kept standing at room temperature for 1 h. Delaying the standing time to 4 h does not significantly alter measured CMCs (0.20 mM for both).
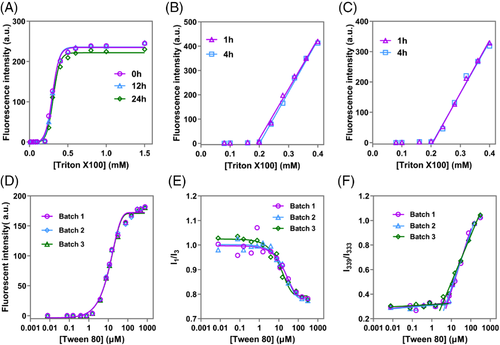
The inter-batch precision of P2-based CMC determination is further investigated using Tween 80 as an exemplification (Figure 4D). Limited fluctuation is observed within batches thanks to the absolute and fast quenching properties as well as the fluorescent stability of P2. The obtained CMCs of different batches are consistent, with an RSD less than 1%. In contrast, high fluctuation and variance within batches is observed when applying pyrene for the same determination (Figure 4E,F), probably owing to the formation of spectrum-obfuscating aggregates.[21, 55] The obtained CMCs for Tween 80 vary from 4.84 to 8.08 μM by the monitoring of I339/I333 with a within-batch RSD of 27.8%, although plotting averaged I339/I333 versus concentration produces a relatively flat profile and a lower CMC of 4.66 μM. The low precision of pyrene method probably contributes to the high variation of reported values as shown in Table 1.
2.2.2 CMC determination of various commercial surfactants via P2
Figure 5A,B and Table 1 show the profiles and the corresponding CMC values of various commercial surfactants determined by P2 versus pyrene. The CMCs measured by P2 for sodium dodecyl sulfate (SDS) and cetyl trimethyl ammonium bromide (CTAB), two common ionic surfactants, are 7.6 and 0.78 mM, respectively, which comply with the values obtained by pyrene (7.2 mM, 0.84 mM) and conductometry (8.02 mM, 0.97 mM, see Figure 5C,D), as well as reported values (6.2–8.4 mM, 0.78–1.2 mM). [13, 15, 56-59]
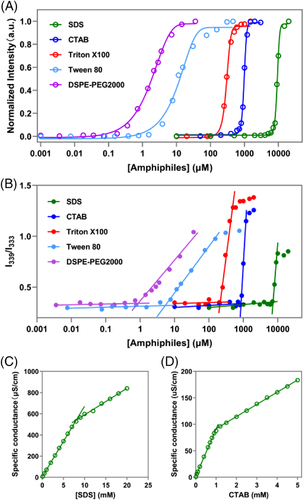
In addition to ionic surfactants, we also applied P2 to measure CMCs of various nonionic surfactants with linear chains or hydrophobic/hydrophilic multi-branch chains, for example, Triton X100, Brij 52, Mrij 58, Cremophor ELP, and Tween 20. The results show that the CMCs determined by P2 are consistent with values obtained by pyrene (Table 1). For example, the CMCs of Cremophor EL and Cremophor ELP determined by P2 were both 1.45 μM, which is in line with results obtained by pyrene (0.98 and 1.37 μM, respectively), and near to the lowest values (2.9 μM) reported in literatures.[60-64]
| Amphiphiles | P2 [μM] | Pyrene [μM]a | Literature values |
|---|---|---|---|
| Triton X100 | 200 | 230 | 200–250[13, 22, 54] |
| SDS | 7600 | 7200 | 6200–8400[13, 15, 56-58] |
| CTAB | 780 | 840 | 780–1200[15, 58, 59] |
| Tween 80 | 2.75 | 4.66 | 3.6–152.7[22, 60, 61, 65, 66] |
| Tween 20 | 5.78 | 7.82 | 10.8–790.2[19, 67-71] |
| Cremophor EL | 1.45 | 0.98 | 2.9–117.2[60-64] |
| Cremophor ELP | 1.45 | 1.37 | |
| Brij 58 | 2.75 | 3.47 | 1.82–80[72-75] |
| Brij 99 | 2.41 | 3.70 | 6–10[74, 76] |
| Myrj 52 | 1.29 | 2.80 | 200–310[77, 78] |
| Poloxamer 407b | 1.34 | 1.71 | ≈0.87–15.9[79-82] |
| Poloxamer 104b | 1.56 | 2.38 | 3.4–5.08[79, 80, 83] |
- a CMC values determined by monitoring of I339/I333.
- b CMC values determined at 40°C.
2.3 CMC determination of thermosensitive amphiphilic materials
Distinct from conventional surfactants, some amphiphilic materials have specific micellization/demicellization properties dependent on temperature, light, pH, and so on, in addition to concentration. Here, the micellization of poloxamers, thermosensitive amphiphilic materials, are monitored based on P2. Figure 6A and Figure S2 show the CMC values of poloxamer 407 (P407, HLB = 27-28) and poloxamer 104 (P104, HLB = 14–16) determined at both 40°C and 27°C by P2. The determined CMCs at 40°C by P2 are 1.34 and 1.56 μM, respectively, which are in accordance with the values determined by pyrene, as well as reported values (Table 1).[79-83] While at 27°C, the CMCs determined by P2 for P407 and P104 were 125.7 and 89.8 μM, respectively, which are significantly higher than those determined at 40°C but in accordance with values mostly determined within the temperature range of 25–30°C. As shown in Figure S2A, the corresponding concentration of P407 when P2 starts to emit fluorescence abruptly decreases when temperature rises. The CMCs of P407 determined by P2 at 30, 33, and 37°C are 78.3, 33, and 3 μM, respectively, which are consistent with the reported results.[79, 80] Meanwhile, the stable quenching of P2 in aqueous solution of non-micellized PEG (PEG2000 and PEG5000) with different concentrations, eliminating the concerns about the rekindling of P2 before micellization of poloxamers (Figure 6A).
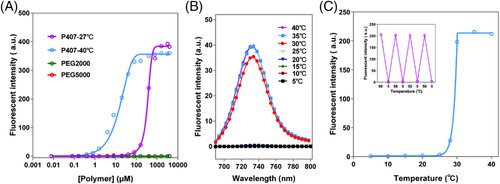
Furthermore, the critical micelle temperature (CMT) can be determined by P2 as well. After addition of P2 into a P104 solution with a fixed concentration, samples were sonicated for 10 min at various temperatures successively. At a temperature below CMT, P104 is unable to form micelles and hence P2 remains absolutely non-emissive, whereas P2 emits strong fluorescence immediately upon formation of P104 micelles at a temperature above the CMT (Figure 6B,C). Moreover, the fluorescence quenches and illuminates alternatively as the systemic temperature alters between 5°C and 50°C, demonstrating the sensitive response of P2 fluorescence to micellization/demicellization (Figure 6C). The determined CMT of P104 at a concentration of 0.5 mg mL−1 was 27.7°C, which is near to reported values.[80]
2.4 CMC determination of amphiphilic polymers with ultralow CMC
Stable polymeric micelles of amphiphilic polymers with ultralow CMC (below micromolar)are commonly thought to be superior in drug delivery. However, their ultralow CMCs are always hard to accurately determine. The pyrene method, albeit its widely accepted sensitivity, can only provide an upper estimation.[32] Here, several amphiphilic polymers with ultralow CMCs, namely methoxy polyethylene glycol (mPEG)5k-poly(D,L-lactic acid) (PDLLA)5k, mPEG5k-PDLLA3k, distearoyl phosphoethanolamine (DSPE)-PEG2000, and polyvinyl caprolactam–polyvinyl acetate–polyethylene glycol graft copolymer (Soluplus) were utilized to verify the accuracy and sensitivity of P2 for CMC determination. Thanks to its background-free property, the working concentration of P2 can be reduced to 17 nM without any influence on the fluorescence transition when polymeric concentrations are just above CMC (Figure 7A).
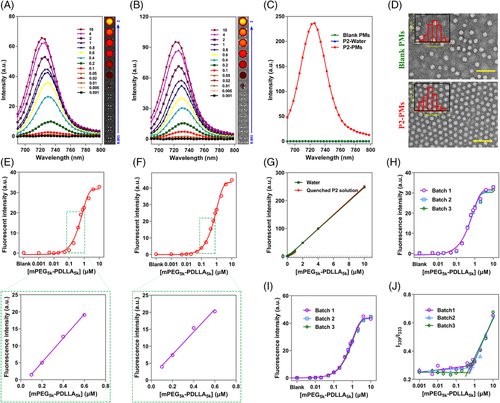
As expected, a clear turning point is observed as shown in Figure 7E. The plot of P2 fluorescence versus the logarithm of polymer concentration fits well to a sigmoid pattern. Obviously, P2 exhibits no emission at a concentration of mPEG5k-PDLLA5k below its CMC. However, when the concentration increases to over its CMC, the fluorescence of P2 appears and then increases in a linear manner with the polymer concentrations. Finally, the fluorescence intensity reaches the top value and remains constant due to complete encapsulation of P2 in polymeric micelles with the increase of polymer concentrations. Accordingly, the inflection point of the fitted sigmoid curve through a tangent method refers to a CMC of 0.1 μM for mPEG5k-PDLLA5k.[53]
It is noteworthy that samples for Figure 7A,E are prepared by incubation after addition of P2 acetonitrile solution. To eliminate the concerns about the potential impact of trace amount of acetonitrile, the hydration method following evaporation of the organic solvent is meanwhile applied to prepare the samples. This method generates similar profiles and a CMC of 0.09 μM near to that obtained by the incubation method (Figure 7B,F). Besides, such ultralow CMC can be visualized by IVIS spectrum live imaging system (Figure 7A,B), which, to our knowledge, has not been reported before.
We reasoned that neutrally charged probe molecules have negligible impact on micellization of amphiphilic copolymers. To this end, the fluorescence responses upon dilution of P2 encapsulated mPEG5k-PDLLA5k micelles by deionized water or aqueous P2 suspension are investigated. As the fluorescence only comes from the encapsulated P2 rather than blank micelles or P2 aggregates (P2-water) (Figure 7C), dilution by deionized water or P2-water produces similar profiles as shown in Figure 7G. Upon dilution, P2 fluorescence attenuates linearly along with the decrease of polymer concentration and finally vanishes at a threshold concentration. The calculated threshold concentrations are 0.13 and 0.2 μM, respectively, which are near to its measured CMC. This means that all encapsulated P2 molecules are easily released and re-aggregated upon collapse of PMs when below its CMC, which demonstrates that the interaction between P2 molecules and copolymers is too weak to impact the aggregation of P2 as well as disassociation behaviors of PMs. This is also demonstrated by the fact that incorporation of P2 has little influence on the morphology and size distribution of polymeric micelles (Figure 7D).
Irrespective of the sample preparation method, CMC determination by P2 for mPEG5k-PDLLA5k shows high inter-batch precisions with the RSD of 0.7% (Figure 7H,I). In contrast, terrible inter-batch precision with the RSD over 48.8% is obtained for the pyrene method as a result of high fluctuation (Figure 7J), which is much lower than that for Tween 80. This is probably the main reason for wide range of reported CMC values of amphiphilic copolymers as shown in Table 2. And we believe that such superior precision of aACQ probes to pyrene holds the potential to eliminate the uncertainties associated with CMC determination of amphiphilic copolymers with ultralow CMC.
| Polymers | CMCs [μM] | |||
|---|---|---|---|---|
| Incubation | Hydration | Pyrene | Reported | |
| mPEG5k-PDLLA5k | 0.10 | 0.09 | 0.24 | ≈0.1–3.8[34, 84-87] |
| mPEG5k-PDLLA3k | 0.18 | 0.14 | 0.48 | ≈0.30–1.3[88-91] |
| DSPE-PEG2000a | 0.30 | 0.26 | 0.86 | ≈0.5–12[33, 59, 92-96] |
| Soluplus | 0.022 | 0.021 | 0.060 | ≈0.017–0.31[97-100] |
- a CMC values determined in HEPES solution.
The obtained CMCs of mPEG5k-PDLLA3k, DSPE-PEG2000, and Soluplus based on P2 are shown in Table 2. It is noteworthy that although pyrene method gives an upper estimation, here we still utilize the pyrene method (I339/I333) for comparisons. Table 2 shows the determined CMC values of these amphiphilic polymers by P2 and pyrene as well as the values reported in literature. The results reveal that CMCs determined by P2 are a bit lower than, but close to the lowest values reported in literatures and obtained by pyrene method.
2.5 CMC determination of amphiphiles by other aACQ probes
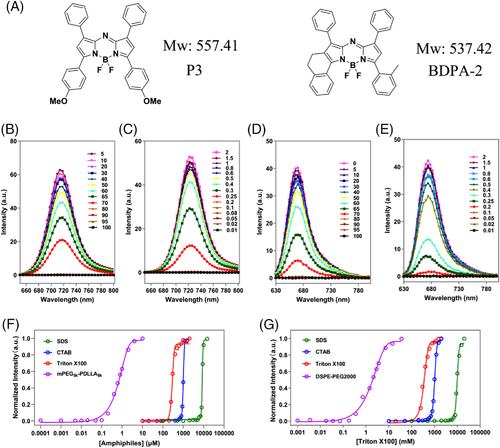
Figure 8 and Table 3 show the CMC determination results based on another two aACQ probes, namely P3 and BDPA-2. These two probes have structures as well as aACQ properties similar to P2 (Figure 8A,B,D and Figure S3). The determined CMC for Triton X100 by P3 is 0.22 mM, complying with the values obtained by P2 and pyrene. The P3 fluorescence in prepared samples remains stable after standing at room temperature for dozens of hours, revealing the robustness of CMC determination by P3 (Figure S4). As shown in Figure 8C, the P3 fluorescence quenches absolutely owing to insufficient Triton X100 (below 0.20 mM) to form micelles, while abruptly intensifying upon micellization when over its CMC. The profiles of P3 fluorescence versus the concentration of SDS, CTAB, Triton X100, and mPEG5k-PDLLA5k, produce CMC values of 7.7 mM, 0.8 mM, 0.22 mM, or 0.60 μM, respectively, which is consistent with the results obtained by P2 (Figure 8F and Table 3). For other amphiphilic polymers with ultralow CMC, such as mPEG5k-PDLLA3k and DSPE-PEG2000, reasonable CMCs of 0.11 and 0.34 μM can also be obtained by monitoring P3 fluorescence (Table 3 and Figure S5). Similar results are obtained when applying BDPA-2 to determine CMCs of various amphiphiles (Figure 8E,G, Table 3, and Figure S6). These results well demonstrate that a series of aACQ probes including P2 can be applied for CMC determination.
| Amphiphiles | P3 | BDPA-2 | |
|---|---|---|---|
| Surfactant [mM] | Triton X100 | 0.22 | 0.22 |
| SDS | 7.7 | 7.8 | |
| CTAB | 0.8 | 0.77 | |
| Amphiphilic polymers [μM] | DSPE-PEG2000a | 0.60 | 0.26 |
| mPEG5k-PDLLA5k | 0.11 | 0.10 | |
| mPEG5k-PDLLA3k | 0.34 | 0.25 | |
- a CMC values determined in HEPES solution.
3 CONCLUSION
Independent on amphiphiles’ conductivity and surfactivity, etc., CMC determination based on fluorometry are applicable to various amphiphiles including ionic and non-ionic surfactants. However, the instability as well as high and fluctuant background of conventional fluorescent probes impedes its application for amphiphilic copolymers with ultralow CMC. Here, we have synthesized a series of aACQ probes and investigated their feasibility and sensitivity for determining CMCs of various amphiphiles. Distinct from conventional probes, these aACQ probes have no background fluorescence when amphiphile concentrations are below CMC, while maintaining high and stable fluorescence when above CMC. This fast and repeatable fluorescence “on/off” switching endows aACQ probes with high precision for monitoring of micellization/demicellization. Moreover, thanks to their absolute quenching of fluorescence in below-CMC region, aACQ probes can be applied for CMC determination without background fluorescence even when probe concentration is reduced to a much lower value (nanomolar range) than ever reported for conventional probes. This confers aACQ probes outperformed sensitivity over conventional probes for determining ultralow CMCs (<μM) of amphiphilic copolymers. Besides, these aACQ probes are neutrally charged and incapable of interacting with ionic amphiphiles by electronic interactions. Weak interactions between probe molecules and amphiphiles have negligible impact on micellization/demicellization, ensuring high accuracy of aACQ probes for measuring CMCs of various types of amphiphiles. Given all this, we believe that CMC measurement based on aACQ probes hold the potential to be the mainstream and universal method for probing the onset of micellization of various amphiphiles with high sensitivity and precision.
4 EXPERIMENTAL SECTION
4.1 Materials
SDS (Aladdin, 99%), CTAB (Aladdin, 99%), Brij 58 (Aladdin, compendial grade, Mn: 1124), Mrij 52 (Aladdin, compendial grade, Mn: 1122) boron trifluoride etherate (98%), and Triton X100 (Wokai, guaranteed reagent) were supplied from Sinopharm Chemical Reagent Co., Ltd. NaCl (analytical reagent, AR), acetic acid (AR), sodium nitrite (AR), dichloromethane (AR), acetic anhydride (AR), diisopropylethylamine (AR), Na2CO3 (AR), 1,2-dichloroethane (AR), acetonitrile (AR), and Na2SO4 (AR) were purchased from Sinopharm Chemical Reagent Co., Ltd. Heochst 33342 (98%), pyrene (99%), Brij 99 (compendial grade, Mn: 1288), Tween 80 (compendial grade, Mn:1309), and 4-(2-hydroxyethyl)piperazine-1-ethanesulfonic acid (HEPES, 99.5%) were supplied by Sigma-Aldrich. Cremophor EL (compendial grade, Mn: 2560), Cremophor ELP (compendial grade, Mn: 2560), Tween 20 (compendial grade, Mn: 1228), Poloxamer 104 (compendial grade, Mn: 5900), Poloxamer 407 (compendial grade, Mn: 12600), and Soluplus (compendial grade, Mn: 118000) were kindly provided by BASF Corporation. DSPE-PEG2000 (compendial grade, Mn: 2805) were purchased from Lipoid GmbH, and mPEG-PDLLA copolymers were kindly gifted by Zhiyong Qian in Sichuan University. Ultrapure reagent water was obtained by a Milli-Q water purification system (Millipore Synthesis A10, Germany).
4.2 Synthesis and characterization of aACQ probes
P2 and P3 were synthesized and characterized exactly according to our previous reported literatures.[101, 102] While BDPA-2 were synthesized with a modified method. Briefly, acetic acid (2 mL) and sodium nitrite (0.8 mmol) were added to the solution of 4,5-dihydro-7-methoxy-3-phenylbenzo[g]indole (0.8 mmol) in dichloromethane (40 mL), followed by stirring at room temperature for 30 min. After successive addition of 2-(o-tolyl)-4-phenyl pyrrole (0.8 mmol) and acetic anhydride (1.6 mL). The reactant was further stirred at room temperature for another 10 min. The reaction was terminated by aqueous Na2CO3. After extraction by dichloromethane, the organic phase was dried over anhydrous Na2SO4 and concentrated under vacuum to obtain aza-dipyrromethene. Boron trifluoride etherate (1 mL) and diisopropylethylamine (1 mL) were added to the solution of aza-dipyrromethene in anhydrous 1,2-dichloroethane (100 mL) at room temperature. The reaction was heated to 80°C and the reaction progress was monitored by TLC. After full conversion, the reactant was cooled down to room temperature and extracted by dichloromethane. The organic phase was washed with saturated NaCl, dried over anhydrous Na2SO4, and concentrated under vacuum. The crude material was purified by silica gel flush column chromatography. BDPA-2 were finally obtained as red solid, with a yield of 50%. The purified BDPA-2 were characterized by 1H NMR (600 MHz), 13C NMR (151 MHz) as well as high resolution mass spectrometry (HR-MS). 1H NMR (600 MHz, CDCl3, δ): 8.53 (d, J = 7.9 Hz, 1H), 8.08 (d, J = 7.2 Hz, 2H), 7.73 (t, J = 11.6 Hz, 2H), 7.59 (d, J = 7.6 Hz, 1H), 7.52 (t, J = 7.5 Hz, 2H), 7.47 (t, J = 7.4 Hz, 1H), 7.43–7.35 (m, 5H), 7.32 (dd, J = 14.2, 6.8 Hz, 3H), 7.28 (d, J = 7.2 Hz, 1H), 6.71 (s, 1H), 3.02–2.90 (m, 4H), 2.39 (s, 3H). 13C NMR (151 MHz, CDCl3, δ): 157.05, 156.19, 147.44, 143.71, 142.48, 140.95, 139.90, 137.25, 133.21, 132.91, 132.62, 132.33, 131.87, 130.67, 130.16, 130.10, 130.04, 129.51, 129.10, 128.96, 128.72, 128.63, 128.39, 128.10, 126.79, 125.23, 117.92, 30.28, 21.96, 20.60. HR-MS (ESI) m/z: [M+H]+ calculated for C35H27N3BF2: 538.2261, found, 538.2267. Details are shown in the Supporting Information.
4.3 Water quenching properties of aACQ probes
The aACQ effects of probes were investigated by the methods previously reported with certain modifications.[44] Briefly, a series of test solvents were prepared by adding different volumetric percentage of water (5%, 10%, 20%, 30%, 40%, 50%, 55%, 60%, 65%, 70%, 80%, 90%, and 100%) to the acetonitrile solution. Then, the test solutions were prepared by adding P2/P3/BDPA-2 solution (34 μM, 10 μL) to test solvents (2 mL). After incubation overnight at 37°C with a shaking speed of 150 rpm, the fluorescence samples were determined by a fluorescence spectrophotometer (Cary Eclipse, Agilent). The spectra of P2 were recorded with excitation wavelength set to 650 nm, while the fluorescence intensity of P2 was measured with excitation and emission wavelengths set to 708 and 732 nm, respectively. As for P3, the spectra were recorded with excitation wavelength set to 630 nm, while the fluorescence intensity was measured with excitation and emission wavelengths set to 688 and 715 nm, respectively. The spectra of BDPA-2 were recorded with excitation wavelength set to 600 nm, while the fluorescence intensity of P2 was measured with excitation and emission wavelengths set to 650 and 679 nm, respectively.
4.4 CMC determination of common surfactants based on aACQ probes
10 μL of P2 or P3 stock solution (34 μM) was added into 2 mL of an aqueous solution of various surfactants with different concentrations. The final working concentration of P2 in samples was 0.17 μM. Then, the samples were incubated overnight at 37°C with a shaking speed of 150 rpm. After cooling down to room temperature, the fluorescence of samples was determined by a fluorescence spectrophotometer as mentioned above. The slits for fluorescence spectra and fluorescence reading are 5 and 10 nm for the excitation and emission wavelength, respectively.
4.5 CMC and CMT determination of thermosensitive materials based on aACQ probes
CMC determination of thermosensitive materials was conducted by methods similar to common surfactants while temperatures were strictly controlled throughout the whole experiment. Briefly, aqueous solutions of materials with varying concentrations were prepared and subsequently incubated overnight at specific temperatures. Afterwards, the fluorescence of samples was immediately determined by a fluorescence spectrophotometer. It was noteworthy that the temperature of samples should be strictly controlled by a water bath during determination.
CMT was determined via the reported methods with modifications.[59] Poloxamer 104 aqueous solution with the concentration set to 0.5 mg mL−1 containing 0.17 μM of P2 was prepared and sonicated for 10 min at various specific temperatures, successively. Samples were fluorescently quantified by a fluorescence spectrophotometer. Water bath was utilized throughout the experiments to strictly control the temperature.
4.6 CMC determination of amphiphilic polymers by P2/P3/BDPA-2
For the incubation method, procedures similar to that utilized for surfactants as mentioned above were employed. Briefly, the probe stock solution (3.4 μM, 10 μL) was added into aqueous polymer solution (2 mL) of various concentrations to ensure a constant probe concentration of 17 nM in all samples. After incubation overnight, the fluorescence spectra and intensity of samples were measured by a fluorescence spectrophotometer. For the hydration method, amphiphilic polymer solutions in acetonitrile with various concentrations were prepared and added to the tubes. Then, probe stock solution (3.4 μM, 10 μL) was added to the polymer solutions, followed by complete evaporation of acetonitrile under nitrogen blowing. After addition of deionized water (2 mL) to the treated tubes, samples were incubated at 37°C under mild shaking. Finally, the fluorescence of samples was measured after cooling down to room temperature.
4.7 Dilution of triton X100 and mPEG5k-PDLLA5k micelles
Triton X100 aqueous solution (0.4 mM) containing P2 (0.17 μM) was prepared by incubation overnight at 37°C. After cooling down to room temperature, Triton X100 solution was diluted by deionized water and quenched P2 aqueous solution containing 0.17 μM of P2, respectively. After being kept standing for 1 or 4 h, the fluorescence of obtained samples with various concentrations of Triton X100 micelles was determined by a fluorescence spectrophotometer. Polymeric micelles (PMs) containing P2 (0.17 μM) and mPEG5k-PDLLA5k (10 μM) were prepared by the methods reported previously.[103] Then, P2-PMs were diluted by deionized water and quenched P2 aqueous solution containing 0.17 μM of P2, respectively. After vortexing for 5 min, the fluorescence was determined by a fluorescence spectrophotometer. The slits for fluorescence spectra were 10 nm for both excitation and emission wavelength. The slits for fluorescence reading were 5 and 10 nm, respectively.
4.8 Visualization of CMC determination by IVIS
To visualize the CMC of mPEG5k-PDLLA5k micelles, samples (200 μL) were added to a 96-well plate and their fluorescence images were captured by an IVIS spectrum live imaging system (Caliper LifeSciences) with excitation/emission wavelengths set to 710/760 nm for P2, respectively.
4.9 CMC determination of surfactants and amphiphilic polymers by pyrene
The CMC determination of surfactants and amphiphilic polymers by pyrene were conducted by referring to the previously reported methods.[52, 104, 105] Briefly, pyrene stock solution (0.4 mM, 10 μL) was added into the aqueous polymer solution (2 mL) of various concentrations to ensure a constant probe concentration of 2 μM in all samples. After filled with nitrogen, samples were incubated overnight at 37°C under mild shaking. Finally, the fluorescence of samples was measured with the excitation wavelengths set to 333 and 339 nm (slit: 5 nm), respectively, while the emission wavelength set to 372 nm (slit: 10 nm). Meanwhile, the fluorescence of samples was also recorded with the excitation wavelength set to 334 nm (slit: 5 nm), while the emission wavelengths set to 372 and 383 nm, respectively (slit: 10 nm).
4.10 CMC determination by Hoechst 33342
CMC determination of Triton X100 by Hoechst 33342 was carried out according to procedures described in literature.[45] Triton X100 aqueous solution with varying concentrations were prepared prior to incubation overnight with 7 μM. The fluorescence of samples was determined by a fluorescence spectrophotometer upon illumination at 335 nm.
ACKNOWLEDGMENTS
This work was supported by the National Natural Science Foundation of China (81872815, 82030107, 81690263) and Science and Technology Commission of Shanghai Municipality (19XD1400300).
CONFLICT OF INTEREST
The authors declare no conflict of interest.
Open Research
DATA AVAILABILITY STATEMENT
The data that support the findings of this study are available from the corresponding author upon reasonable request.


