Unraveling demand and supply shocks in the U.S. nitrogen market
Editor in charge: Gopinath Munisamy
The findings and conclusions in this presentation are those of the authors and should not be construed to represent any official USDA or U.S. Government determination or policy.
Abstract
Nitrogen fertilizer prices have been volatile, especially in recent years. This study decomposes nitrogen price changes into structural shocks related to supply and demand via a structural vector autoregression (SVAR) model and quantifies the relative contributions of these shocks to price movements over recent decades. Our findings reveal that corn and natural gas prices account for only a fraction of ammonia price fluctuations, while other factors in the nitrogen market have a more substantial influence.
Fertilizers are a critical component of modern agriculture, accounting for the largest portion of operating costs for crops like barley, corn, cotton, oats, rice, sorghum, and wheat (USDA-ERS, 2024).1 For instance, corn farmers in 2021 allocated 39.2% of total operating costs to fertilizers, and a survey by Wang et al. (2023) found that fertilizers ranked as the biggest concern for agricultural producers in the Midwest. Research has shown a strong link between nitrogen fertilizers and crop yields, with reductions in nitrogen usage leading to decreased production.2 Global food production has managed to keep pace with a growing population, primarily due to the use of fertilizers. This is evident from the fact that, from 1961 to 2020, cropland area grew by 15.7%, but global use of fertilizer increased over sixfold, from 31 to 195 million tons (Mt) (Food and Agriculture Organization [FAO], 2022).3
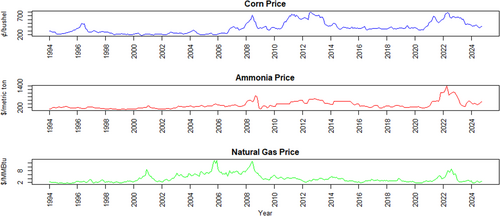
Nitrogen is the primary fertilizer used for crop production (Bekkerman et al., 2021),4 accounting for about 56% of total fertilizer use and increasing over ninefold from 1961 to 2020. However, the price of nitrogen has experienced significant fluctuations in the last two decades, with notable spikes occurring in 2008 and most recently in 2022. For instance, the average U.S. Gulf ammonia monthly price reached a record high of $1402 in April 2022, compared to $545 in April 2021 and $250 in April 2020 (Figure 1).
The increased volatility in nitrogen prices has spurred numerous studies examining the factors driving these fluctuations. Given corn's high nitrogen demand and its price rise fueled by ethanol demand, along with natural gas serving as the primary feedstock for nitrogen production, many studies have explored the relationships between natural gas, nitrogen fertilizer, and corn prices. Reduced-form vector autoregression (VAR) and vector error correction (VEC) models have been commonly used for this purpose (Beckman & Riche, 2015; Crespi et al., 2022; Etienne et al., 2016; Galbraith, 2010). While VAR and VEC models can help identify correlations among these variables, they fall short of pinpointing causal mechanisms. Because each variable is modeled as a function of its own past values and those of other variables, the impulse responses generated by VAR models lack clear interpretation (Cooley & Dwyer, 1998).5 Moreover, these models do not explicitly account for contemporaneous correlations among endogenous variables (Baum, 2013). Consequently, VAR/VEC models struggle to adequately explain nitrogen price spikes such as those in 2008, 2021, and 2022.
This study fills a critical knowledge gap in nitrogen markets with three primary objectives. First, it goes beyond identifying correlations to determine the causal factors driving nitrogen price fluctuations. This is achieved by decomposing nitrogen price changes into structural shocks attributed to supply and demand dynamics. Understanding the nature of these shocks can improve the accuracy of economic forecasts for nitrogen prices. Second, the study quantifies the relative contribution of these shocks to price movements over recent decades, shedding light on how these shocks have influenced ammonia price fluctuations over time. Lastly, the study determines whether responses to these shocks are immediate, delayed, transitory, or persistent. To the best of our knowledge, this is the first study to identify structural shocks and cause-and-effect relationships within nitrogen markets. By disentangling structural shocks into demand and supply factors, our work provides a deeper understanding of the causal mechanisms behind nitrogen price fluctuations and the distinct roles played by various factors. The findings have significant policy implications for stabilizing nitrogen markets, mitigating price volatility, managing farmers' financial risks, and enhancing agricultural sustainability.
FACTORS INFLUENCING NITROGEN PRICES
Ammonia is a key nitrogen-containing compound used in fertilizers. It is commercially produced through the Haber–Bosch process, which synthesizes atmospheric nitrogen with hydrogen derived from natural gas. While ammonia has numerous industrial applications, nearly 90% of domestic ammonia consumption in the United States is used for fertilizer (USGS, 2023). This includes direct applications of anhydrous ammonia, as well as the production of other nitrogen-based fertilizers such as urea, ammonium nitrates, and ammonium phosphates (USGS, 2023). Given its central role, ammonia prices serve as a strong indicator of broader nitrogen fertilizer market dynamics. These prices are influenced by both supply- and demand-side factors.
Natural gas price (supply-side factor)
Natural gas is the primary feedstock for ammonia production, accounting for 70%–90% of its variable production costs (Bicer et al., 2016). Given this reliance, natural gas prices are widely recognized as a key driver of nitrogen fertilizer prices. Previous studies, including those by the U.S. General Accounting Office (USGAO) (2003), Beckman and Riche (2015), Etienne et al. (2016), and Bekkerman et al. (2021), consistently highlight a strong correlation between natural gas and nitrogen fertilizer prices. This relationship is particularly stronger for anhydrous ammonia, which has a higher nitrogen concentration (82%) than other fertilizers, such as urea (46%) (USGAO, 2003).
Between 1990 and 1999, natural gas prices remained relatively stable, ranging from $2 to $4 per million British thermal units (MMBtu) (see Figure 1). However, several spikes occurred between 2000 and 2008 due to factors such as low storage levels, increased winter demand, and supply disruptions from extreme weather events (Federal Energy Regulatory Commission [FERC], 2003; USGAO, 2002). Prices surged to a record $13.45/MMBtu in October 2005 following Hurricanes Rita and Katrina. In 2008, a tight supply–demand balance pushed prices to $12.78 in June, before they fell below $6 by year's end due to the financial crisis and improved stock levels (FERC, 2009). The mid-2000s saw the rise of hydraulic fracturing, which unlocked vast shale gas reserves. As a result, between 2009 and 2021, natural gas prices fluctuated between $1.70/MMBtu and $5.60/MMBtu. However, in 2022, prices surged again—driven by COVID-19-induced supply chain disruptions, post-pandemic recovery, extreme weather events, and geopolitical tensions including the Russia–Ukraine conflict—peaking at $8.78/MMBtu in August 2022.
Corn prices (demand-side factor)
Cereals dominate nitrogen fertilizer use in the United States, accounting for 68% of total consumption as of 2018 (International Fertilizer Association [IFA], 2022). Among cereals, corn is the largest consumer, using 50% of total nitrogen, followed by wheat (13%), rice (2%), and other cereals (3%) (IFA, 2022). Corn prices have fluctuated significantly over recent decades (see Figure 1). In 1996, prices surged due to high demand, reduced production, and lower stocks, with corn futures peaking at $4.94/bushel in May—a 93% increase from the previous year. Prices declined the following year amid the financial crisis, staying below $3.20/bushel until the 2006–2008 period, when strong export demand, expanded biofuel production, and low stocks drove a 198% price increase. The 2008 global economic crisis dampened demand, but volatility persisted, driven by the 2012 drought, subsequent production recovery, biofuel expansion, and rising stocks. Prices hit a low in 2016 due to abundant supply and weak export markets, remaining relatively stable until rebounding in 2020. This increase continued into 2021, peaked in 2022, and then declined into 2024. The link between fertilizer and grain prices stems from cost-push factors, demand shifts, and broader market dynamics. Studies such as Beckman and Riche (2015) and Etienne et al. (2016) suggest a positive correlation between ammonia and corn prices.
Other factors
In addition to natural gas and corn prices, several other factors can influence nitrogen prices, including production capacity, inventory levels, market concentration, transportation costs, and supply chain disruptions. For example, the USGS (1994, 1996) attributes the record-high ammonia prices in 1994–1995 to tight supply driven by U.S. producer overcapacity and strong export demand for grains. Similarly, Huang (2009) identifies multiple factors behind the 2008 ammonia price spike, including depleted inventories, increased corn and wheat acreage, China's high fertilizer export tariffs, and a weakening U.S. dollar, which made fertilizer imports more expensive and exports cheaper.6 Rising transportation costs also contributed, with rail rates increasing 63% between 2005 and 2008 and fuel surcharges reaching 44% in July 2008.
Supply chain disruptions have further exacerbated price volatility. The COVID-19 pandemic strained logistics, triggering a 2021 ammonia price surge. The situation worsened in 2022 with the conflicts between Russia and Ukraine, which disrupted global fertilizer markets. Export restrictions and sanctions on Russia further tightened supply, pushing prices higher. By 2023, prices began to ease as supply and demand shocks subsided.
Market concentration is another key factor. Between the 1980s and the mid-2000s, declining fertilizer demand and rising production costs led to consolidation, reducing the number of U.S. nitrogen fertilizer plants from 59 to 22 and the number of companies from 46 to 13 (Bekkerman et al., 2020). Despite increased fertilizer demand driven by biofuel policies and declining natural gas prices due to hydraulic fracturing, consolidation continued. By 2019, four companies controlled around 75% of domestic production, up from 54% in 1997 (Crespi & MacDonald, 2022), raising concerns about market manipulation (Crespi et al., 2022). Gopinath and Wu (1999) estimated that a 37% concentration ratio in nitrogen led to a 0.183 price markup, while a 70% concentration ratio in pesticides resulted in a 0.70 markup. As of 2023, 17 companies operate 36 ammonia production plants across 17 U.S. states (USGS, 2024), suggesting potential for higher price markups.
The factors outlined above provide a plausible explanation for recent nitrogen price fluctuations. However, fully understanding these dynamics requires further statistical analysis and empirical validation. Quantifying the relative impact of each factor will be crucial for developing effective policy responses and mitigating future price volatility. This study aims to undertake this comprehensive analysis.
METHODOLOGY AND DATA
To conduct our analysis, we construct a structural vector autoregression (SVAR) model based on the framework developed by Kilian (2009). SVAR has gained popularity in recent decades for estimating and interpreting structural shocks across various contexts. Unlike standard VAR models, which explain endogenous variables solely through their own past values, SVAR models explicitly account for contemporaneous interdependencies among variables, allowing them to capture more complex relationships (Pfaff, 2008). Moreover, while VAR models do not directly identify structural shocks, SVAR models do, providing clearer insights into cause-and-effect relationships.
To identify the matrix , two main strategies are commonly used (Du & Dong, 2023). The first involves imposing restrictions on coefficients based on economic theory (Blanchard & Quah, 1989; Sims, 1980; Uhlig, 2005). The second relies on empirical data-driven methods that leverage the statistical properties of the data (Lange et al., 2021). This study adopts the latter approach, using the underlying data structure to determine the structural matrix. Data-driven identification methods fall into two categories: heteroskedasticity-based approaches, which assume heteroskedastic shocks, and independence-based approaches, which exploit the uniqueness of non-Gaussian independent components. Herwartz et al. (2019) demonstrate that identification via independent components is more robust across different distributional frameworks and heteroskedasticity, as long as the innovations are non-Gaussian.
This study employs an independence-based method using nonparametric distance covariance statistics, assuming at most one component exhibiting a Gaussian distribution (Lange et al., 2021). Identification is achieved by estimating that makes the respective structural shocks minimize the distance covariance (Matteson & Tsay, 2017; Székely et al., 2007). In other words, the goal is to find that ensures the elements in are least dependent. A gradient algorithm is used to determine the minimum (Lange et al., 2021).
In our empirical analysis, we specifically select ammonia prices due to their dual role in the nitrogen market. As noted earlier, ammonia is not only directly applied to crops as nitrogen fertilizer, but it also serves as a major input for other nitrogen products. Natural gas is the primary input for nitrogen production, while corn is the leading user of nitrogen fertilizer. Consequently, we use the price of natural gas to measure aggregate nitrogen supply and the price of corn to measure aggregate nitrogen demand. The SVAR model thus comprises three variables: the price of natural gas, the price of corn, and the price of ammonia itself. Changes in ammonia prices can be explained by three components: (i) aggregate nitrogen supply shocks, measured by fluctuations in natural gas prices; (ii) aggregate nitrogen demand shocks, which reflect shocks to nitrogen demand measured by corn price fluctuations; and (iii) nitrogen market-specific shocks that are not captured by the first two components.
Market-specific shocks can arise from various factors as discussed earlier, including fluctuations in nitrogen transportation costs, logistical challenges (e.g., delays or disruptions in the supply chain caused by weather, pandemic, port congestion, or strikes), trade policies (such as tariffs, export restrictions, international sanctions), and geopolitical conflicts. For example, the conflict between Russia and Ukraine impacted nitrogen prices through all three components: it increased energy prices (aggregate nitrogen supply shock), raised crop prices due to reduced supply from a major grain producer (aggregate demand shock), and caused market-specific disruptions such as export bans and logistical challenges.
Monthly U.S. gulf ammonia prices, rolling nearby corn futures prices at the Chicago Board of Trade (CBOT), and rolling nearby natural gas futures prices at the New York Mercantile Exchange (NYMEX) are used in the analysis. Monthly data were selected over weekly data because of the minimal variation in ammonia prices observed within a month. U.S. gulf ammonia prices were obtained from Bloomberg Green Markets, corn futures contract prices from the CBOT, and natural gas futures prices from the U.S. Energy Information Administration (USEIA). The monthly data span January 1994 to October 2024. All price variables were deflated using the consumer price index and logarithmically transformed. To ensure stationarity, first differences were taken for all logged variables based on the augmented Dickey–Fuller test, resulting in data spanning February 1994 to October 2024. The Kruskal–Wallis test (Ollech, 2021) identified significant seasonality in corn and natural gas prices. To address this, seasonal components were removed using data series decomposition. Subsequently, the Mann–Kendall test, WAVK test, and t-test with the sieve-bootstrap enhancement for potential autocorrelation were conducted to detect non-monotonic, monotonic, and linear trends. However, none of these tests identified a trend in the log-differenced, de-seasoned variables. The log-differenced, de-seasoned real prices of corn, nitrogen (ammonia), and natural gas are denoted as , , respectively (see Figure A1).
ESTIMATION RESULTS
Based on the Akaike information criterion (AIC) and final prediction error (FPE), the optimal lag order in the SVAR model was determined to be three. Therefore, the model includes three past periods of the variables to best capture their dynamic relationships. Structural change tests were conducted using an empirical fluctuation process with cumulative sums of recursive residuals (Rec-CUSUM) and moving sums of recursive residuals (Rec-MOSUM) (Pfaff, 2008; Pfaff & Stigler, 2024; Zeileis et al., 2002). The empirical fluctuation process plots from both tests showed that all three price paths—corn, ammonia, and natural gas—remained within the boundaries, suggesting the fluctuations are not large and the null hypothesis of no structural change cannot be rejected. The structural change tests yielded p-values of 0.840, 0.952, and 0.871 for Rec-CUSUM and 0.533, 0.510, and 0.472 for Rec-MOSUM, respectively, indicating no significant structural changes. This finding contrasts with previous studies using VAR/VEC models, which identified structural breaks at inconsistent points in time. For example, Beckman and Riche (2015) reported a break in June 2008, and Crespi et al. (2022) identified breaks in June 2007, November 2009, September 2016, and October 2019.8
The empirical method for identifying structural shocks, based on nonparametric distance covariance statistics, assumes at most one Gaussian shock (Lange et al., 2021). Jarque–Bera tests, along with multivariate skewness and kurtosis tests for the residuals, rejected the normality of the error terms overall. Furthermore, univariate Jarque–Bera tests confirmed the rejection of normality for all three prices, supporting the validity of the identification method's assumption.9 A bootstrap-after-bootstrap procedure, as suggested by Kilian (2009) was employed for estimation. This approach, recognized for its accuracy and conservative assessment of uncertainty (Kim, 2001), was implemented with a recursive-design wild bootstrap and 2000 replications.
Figures 2 and 3 present the historical decomposition of structural shocks affecting ammonia prices, breaking down price fluctuations into the contributions of each identified shock. This decomposition reveals how each shock has influenced ammonia prices over time. With a log-difference transformation applied to the data and the inclusion of three-period lags, the figures cover the period from May 1994 to October 2024. Figure 2 displays the individual shock components, while Figure 3 uses an area plot to visualize their relative contributions to ammonia price fluctuations.
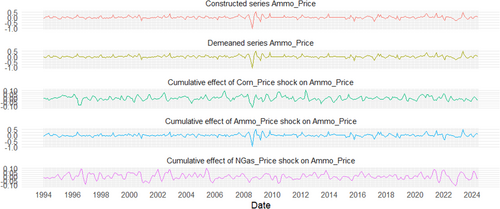
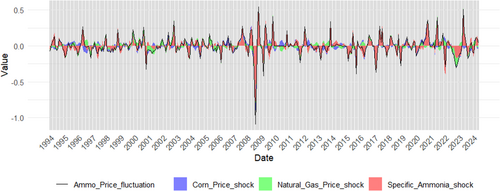
The historical decomposition of structural shocks underscores that ammonia prices are influenced by a combination of shocks at any given time, with their relative importance varying over time. For a better understanding, please refer to the earlier discussion on the potential factors and events influencing the fluctuations in the prices of ammonia, natural gas, and corn. For example, consistent with USGS (1994, 1996), which attributed the record-high ammonia price in September 1994 to strong export demand and limited operational capacities (captured in this analysis as market-specific shocks), our results identify ammonia market-specific shocks as the dominant driver that month, while shocks to corn and natural gas prices mitigated price fluctuations by moving in the opposite direction. Similarly, the significant price spike in December 2008 was largely attributed to ammonia market-specific shocks, aligning with factors identified by Huang (2009), such as depleted stocks, rising transportation costs, and fuel surcharges. In contrast, during October 2005, following hurricanes Rita and Katrina in August and September, natural gas price shocks fully explained the upward movement in ammonia prices. Comparatively, during the first 5 months of 2023, all three shocks exerted downward pressure on ammonia prices, resulting in a significant decline. These findings highlight the intricate interplay among various factors influencing ammonia price dynamics. While previous studies have made anecdotal observations about the drivers of ammonia price volatility, especially during price spikes or troughs, our analysis provides empirical evidence that not only substantiates these observations but also quantifies the contributions of each factor.
A closer examination of Figure 3 reveals that natural gas price shocks had a greater influence on ammonia prices before the 2005–2011 period than after, suggesting that ammonia price movements were more closely aligned with natural gas price shocks prior to that period. This shift corresponds with policy changes and the shale gas boom that occurred during those years. While this change is not significant enough to be detected by the structural breakpoint test, the decomposition highlights the evolving nature of these dynamics.
To explore how variables respond to different shocks over time, we examine the structural impulse response functions (IRFs) presented in Figure 4. IRFs are a crucial tool for analyzing how variables in the system react and adjust in response to a sudden, unexpected change (i.e., a shock or impulse) to one of the variables over time. To better characterize the likelihood shape of the model, following the approach of Sims and Uhlig (1991) and Sims and Zha (1999), we use a 68% significance level to assess the significance of the impulse response. This significance level is in line with the VAR literature (Pesaran et al., 1993; Sims & Zha, 1999) and allows for a reliable assessment of the statistical significance of the obtained results. The three columns in Figure 4 depict the responses of each variable to a one standard deviation increase in corn price, ammonia price, and natural gas price, respectively. The 68% confidence intervals are obtained from a bootstrap-after-bootstrap procedure, as indicated previously.
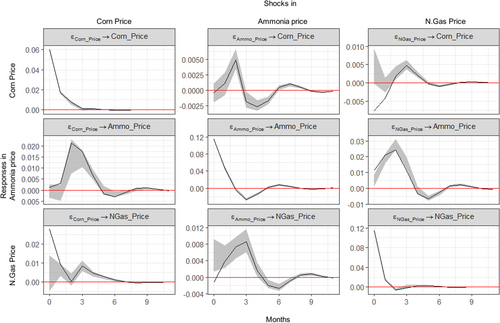
The impulse responses in Figure 4 align well with economic principles. They show that a shock (a one standard deviation increase) to corn prices leads to a delayed increase in both ammonia and natural gas prices, with immediate responses being statistically insignificant. Ammonia prices peak in the second month before gradually declining and adjusting toward zero. In contrast, the response of natural gas prices is smaller than that of ammonia prices, reflecting the fact that corn is a much smaller consumer of natural gas compared to ammonia production. As expected, a shock to corn prices elicits an immediate response in its own price, but this effect diminishes quickly, converging to zero by the third month. These findings suggest that while all responses are short-term, a shock to corn prices results in a delayed but more pronounced and persistent increase in ammonia prices than in corn prices themselves. The stronger and more prolonged impact on ammonia prices may be driven by factors such as industry concentration in nitrogen production or the market power of large firms, as discussed earlier.
Conversely, a shock to ammonia prices prompts no immediate response in corn prices, with only a slight positive response emerging after 1 month. While it may seem intuitive that corn futures would respond immediately to changes in ammonia prices—given that futures markets are generally efficient at processing new information—nearby corn futures prices reflect not only current market conditions but also expectations about future supply, demand, and profitability. If an ammonia price shock is perceived as short-lived or uncertain, the immediate response may be limited or statistically insignificant. Moreover, farmers typically lock in fertilizer prices and make planting decisions weeks or even months in advance. As a result, a spike in ammonia prices may not affect corn supply—and thus corn futures—until the next planting cycle. Existing inventories can also buffer short-term supply disruptions, further delaying the price response. Combined with the time needed for market participants to revise expectations and incorporate input cost shocks into futures pricing, these factors help explain the one-month lag observed in our SVAR results.
Additionally, the corn price response to an ammonia price shock is short-lived: it turns negative after the initial increase and undergoes a brief adjustment period before converging to zero. The small magnitude of the response suggests that rising ammonia prices are not quickly or fully passed through to corn prices, implying that corn producers may not receive proportional compensation for increased fertilizer costs. This finding aligns with the competitive nature of the corn market, where producers have limited market power to negotiate higher prices for their products, even amidst rising production costs. Meanwhile, the near-zero response of natural gas is consistent with the fact that ammonia production accounts for only about 6.5% of all U.S. industrial natural gas consumption (USEIA, 2021).
A shock to natural gas prices leads to a delayed increase in corn prices, with an insignificant immediate response. The impact becomes significant in the second month, peaks in the third month, but the magnitude of this response remains minimal before quickly tapering to zero. In contrast, ammonia prices respond immediately to shocks in natural gas prices, underscoring the strong connection between these two markets, as natural gas serves as a key input in ammonia production. This reflects a ripple effect throughout the supply chain. The differences in responses between corn and ammonia prices highlight how changes in natural gas prices permeate production processes, with ammonia prices adjusting more quickly and sharply than corn prices. Notably, all responses are temporary, typically converging to zero within a few months. This transient nature suggests that while all shocks may initially disrupt the markets, they tend to adjust and stabilize quickly.
Table 1 displays the forecast error variance decomposition (FEVD) for ammonia prices, indicating the proportion of the forecast error variance attributed to shocks from each endogenous variable across different time horizons. The FEVD helps assess the relative importance and dynamics of shocks driving fluctuations in ammonia prices. The estimates reveal that ammonia market-specific shocks play a dominant role in influencing the variations in forecast error for ammonia prices. Within the first month of the time horizon, approximately 99% of the forecast error variance of ammonia prices can be attributed to these ammonia market-specific shocks. By the fourth month, although the contribution of ammonia market-specific shocks to the variation in ammonia prices reduces to 89%, these shocks still outweigh the contributions from shocks to corn prices (4%) and natural gas prices (7%). In the 12th month, the contributions of each shock change minimally and remain the same afterward as the system stabilizes, indicating again that all responses are temporary, stabilizing within a year.10
| Months | Corn price (%) | Ammonia price (%) | Natural gas price (%) |
|---|---|---|---|
| 1 | 0.010 | 99.027 | 0.963 |
| 2 | 0.068 | 96.332 | 3.600 |
| 3 | 2.798 | 90.375 | 6.827 |
| 4 | 4.334 | 88.585 | 7.081 |
| 8 | 4.552 | 88.171 | 7.277 |
| 12 | 4.557 | 88.138 | 7.305 |
| 16 | 4.557 | 88.138 | 7.305 |
CONCLUSIONS AND IMPLICATIONS
In this study, we employ a SVAR model to analyze the U.S. fertilizer market. By incorporating three variables—the price of natural gas, the price of corn, and the price of ammonia itself—we disentangle the structural shocks into demand, supply, and ammonia market-specific factors and identify the distinct contributions of these factors to ammonia price fluctuations over time.
Fertilizer affordability is critical for crop production, as high fertilizer costs can restrict farmers' ability to apply optimal nutrient levels, leading to lower yields and jeopardizing food security. Our findings indicate that increases in ammonia prices are not completely transmitted to corn prices, thereby making fertilizer less affordable and squeezing farmers' profit margins. Additionally, we find that a shock to corn prices results in a delayed but more substantial and persistent increase in ammonia prices than in corn prices themselves. This suggests that when corn prices rise—driven, for example, by strong demand for exports or biofuel production—corn producers may not fully benefit from the price increase, as the disproportionate rise in fertilizer costs erodes profitability.
These results align with the narrowing margins between the prices farmers receive from their crops versus the prices they pay for their inputs. The ratio of the prices received index to prices paid index for crop farmers has significantly declined, from 1.26 in January 1994 to 0.65 in October 2024 (USDA-National Agricultural Statistics Service [NASS], 2025). This ongoing profitability squeeze undermines agricultural sustainability. High nitrogen prices may incentivize farmers to shift from high-input cereals to less nutrient-demanding crops (such as soybeans), reduce overall acreage planted (USDA Foreign Agricultural Service [FAS], 2022), or even exit farming altogether, thereby reducing the availability of cereals critical for food security.
In light of these findings, several strategies have been suggested to alleviate the impacts of rising input costs. For instance, the adoption of more efficient fertilizer application technologies and practices, such as precision agriculture, could enhance crop yields without substantially raising input costs (Gebbers & Adamchuk, 2010; USDA-Agricultural Research Service [ARS], 2025; USGAO, 2024). Additionally, there are initiatives that offer financial assistance or access to low-cost financing during periods of high fertilizer prices—such as the Microloan Programs by the USDA and the Crop and Livestock Loan Guaranty Program by the Missouri Department of Agriculture. Furthermore, effective nutrient management and best management practices, including crop rotation and cover cropping, may also reduce reliance on high-cost fertilizer inputs (Dong, 2024).
Our historical decomposition of ammonia prices derived from the SVAR model provides nuanced insights into the factors driving ammonia price fluctuations over recent decades. While ammonia prices reflect a dynamic interplay of various shocks, market-specific shocks have accounted for a larger share of these fluctuations, particularly in recent years. The FEVD consistently shows that ammonia market-specific shocks explain a substantial portion of the forecast error variance in ammonia prices compared to the other two shocks. These ammonia market-specific shocks can arise from various factors, including supply chain interruptions, rising transportation costs, nitrogen production capacity constraints, and the industry's inability to adjust quickly to low inventory levels. Studies (Hobbs, 2021) suggest that diversifying supply sources, improving logistics infrastructure, and adopting automation and digitalization can help mitigate the risks of unexpected disruptions.
Overall, the results of this study contribute to a deeper understanding of the complex dynamics influencing ammonia prices and can inform policymakers' decisions aimed at ensuring stability and resilience in both the fertilizer market and crop production. While our analysis highlights the significance of ammonia market-specific shocks in explaining forecast error variance, it does not incorporate additional variables, such as trade and ending stocks of ammonia, that could further unravel these shocks due to data limitations. Future studies could build upon this work by integrating additional variables to enhance our understanding of nitrogen market dynamics.
FUNDING INFORMATION
This work was funded by U.S. Department of Agriculture, Economic Research Service.


