Single Silicon Nanowire-Based Fluorescent Sensor for Endogenous Hypochlorite in an Individual Cell
Abstract
As a prototype of a single-cell detecting technique, a single silicon nanowire-based (SiNW-based) fluorescent sensor for endogenous hypochlorite in a macrophage is constructed. The fluorescent sensor for hypochlorite is prepared by decorating a near-infrared dye, IR780 onto the surface of SiNWs. The sensor exhibits high sensitivity and linear dependence of the fluorescence intensities on the hypochlorite concentrations. With the help of micromanipulation and laser scanning confocal microscopy, detection of endogenous hypochlorite in a single macrophage is realized by penetrating the single SiNW-based sensor into individual cells. The current SiNW-based sensor will possess potential value in revealing the role of hypochlorite in physiology and pathology. Such single-cell detecting techniques can be expanded to other fields. This work will open a new door to a variety of novel studies by combining the strengths of single-cell detecting techniques with biology.
1 Introduction
Hypochlorous acid (HClO) is an important reactive oxygen species (ROS) and plays a vital role in protecting the body against invasion of pathogens.1 The HClO is weakly acidic and partially dissociates into the hypochlorite ion (ClO−) in physiological pH solutions.2 The endogenous hypochlorite (HClO/ClO−) is generated from the peroxidation of chloride ions by the catalysis of myeloperoxidase (MPO) in leukocytes including neutrophils, monocytes, and macrophages.2, 3 However, the aberrant concentration of the hypochlorite owing to variation in MPO level has been reported to associate with a variety of diseases such as arthritis, cardiovascular diseases, and cancer.4 Thus, it is of vital importance to monitor the hypochlorite.
So far, many fluorescent probes have been reported for selective signaling of the hypochlorite and they possess great merits such as high sensitivity, fast response time, etc.5 Owing to some limitations of these research, most sensors would only be able to investigate large numbers of cells. Based on the assumption that the average response represents typical cells within the population, the traditional cell-based assays just measure the average response of cell populations.6 However, there are significant differences among individuals of the same type of cells.7 So such average cannot accurately reflect the response from an individual cell and may result in a misleading interpretation. The accurate determination of the hypochlorite at single-cell level could reveal the essence of hypochlorite in life activities and enable physiologists and pathologists to explore the causes of hypochlorite-related diseases and obtain more reliable scientific basis for the development and treatment of the diseases.8 Thus, it is highly desirable to fabricate a proper fluorescent sensor which could be used to investigate the dynamic activity of the hypochlorite and reveal the biological role of hypochlorite in a single cell.
Currently, single-cell study at the nanoscale can present in forms such as pillars,9 tubes,10 and wires.11 These materials as probes are gently inserted into a cell and show great advantages12 such as active insertion into the cell at the location as we need, realizing subcellular resolution, label-free for a specific location in the cell, decreasing diffusion distance, etc.13 Modifying a proper molecule on an appropriate anchoring carrier would be a rational strategy to construct sensors for single-cell research. Among the nanomaterials, silicon nanowires (SiNWs) are a competitive alternative as the anchoring substrate.14 Compared with other nanomaterials, SiNWs own many virtues such as nontoxicity, high stability, easy modification, and praiseworthy biocompatibility. Especially, it can be easily fabricated in good straightness, rigidity, and different lengths. Therefore, it is very favorable to utilize the SiNWs as the anchoring substrate to construct a single nanowire-based sensor for biological detection in a single cell.
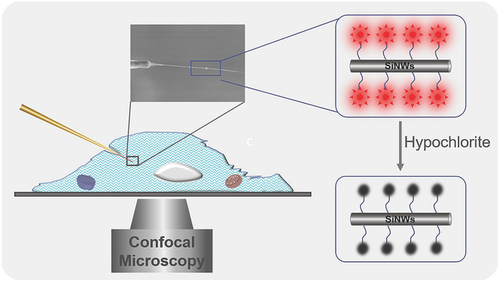
In this study, we have constructed a single SiNW-based fluorescent sensor for hypochlorite and realized its application in an individual cell with the assistance of micromanipulation and confocal microscopy (Figure 1). The sensor was rationally fabricated by decorating a near-infrared fluorescent dye (IR780) onto the SiNWs surface. The response mechanism of IR780 decorated SiNWs to the hypochlorite involves one-electron oxidation15 of the IR780 by the hypochlorite, which could result in the cleavage of the polymethine chain in IR780, and the decrease of the fluorescence of IR780 decorated SiNWs. The present sensor permits facile insertion into a biological cell, realizing the selective response of the hypochlorite in a single cell. As a demonstration of this novel technique, the as-fabricated sensor was successfully utilized for detection of the endogenous hypochlorite in single macrophages. Meanwhile, this approach provides striking advantages of high stability, selectivity, and favorable biocompatibility in single living cells. Moreover, the present single SiNW-based technique can be expanded to other fields. This work will enable a variety of novel studies by merging the virtues of single-cell detecting technique and biology.
2 Results and Discussion
The structure and morphologies of SiNWs (by chemical vapor deposition (CVD)16) are shown in Figure S1a in the Supporting Information. The diameter of silicon core with lattices is 10–20 nm and the oxide sheath are as thick as 2–5 nm (Figure S1a, Supporting Information and its inset). The SiNWs (by CVD) were mainly utilized for the experiment in vitro. SiNWs (by chemical etching (CE) method17) with different lengths can be fabricated by varying the etching time. As shown in Figure S1b–e in the Supporting Information, the diameters of SiNWs range from 100 nm to 400 nm and the lengths of the prepared SiNWs are separately about 30 μm (Figure S1b,c, Supporting Information) and 200 µm (Figure S1d,e, Supporting Information). The short SiNW arrays were used for the arrays experiment and the long SiNW arrays were employed for single-cell study.
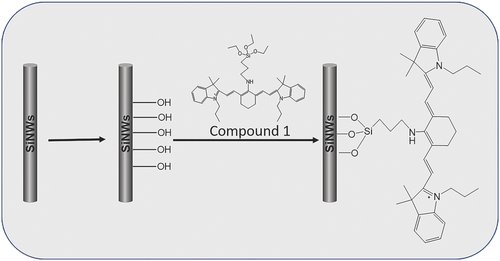
The sensor based on SiNWs (by CVD) was defined as RSiNWs. Scheme 1 illuminates the preparing process of the RSiNWs sensor. The decoration of the SiNWs was characterized by X-ray photoelectron spectroscopy (XPS). As shown in Figure S2a in the Supporting Information, due to the abundant carbon in the Compound 1, a more obvious carbon peak can be observed after the SiNWs were modified with the Compound 1. Moreover, a peak of nitrogen could be observed from this sample (Figure S2b, Supporting Information). However, little carbon and nitrogen were detected from the bare SiNWs. The appearance of obvious nitrogen peak on the modified SiNWs demonstrates that the Compound 1 has been successfully anchored to the surface of the SiNWs.
The sensor was characterized in vitro with the RSiNWs (by CVD) suspension in phosphate buffered saline (PBS). First, the response of the sensor to excess hypochlorite was observed. The RSiNWs were dispersed into 10 × 10−3 m PBS buffer (pH 7.4) to form a 200 µg mL−1 suspended solution. As can be seen in Figure S3 in the Supporting Information, upon addition of the excess hypochlorite to the solution, there was an obvious decrease in the RSiNWs fluorescence intensities. The response time is less than 1 min. The phenomenon demonstrates that RSiNWs respond rapidly to the hypochlorite.
In order to examine the reactivity of the RSiNWs to the hypochlorite in details, the hypochlorite with various concentrations was added to 200 µg mL−1 suspended solution in 10 × 10−3 m PBS buffer (pH 7.4). As depicted in Figure 2a, when hypochlorite was added, the higher the hypochlorite concentrations, the more obviously the fluorescence intensities decreased. The correlation of the RSiNWs fluorescence intensities at 750 nm on the hypochlorite concentrations is shown in the inset of Figure 2a. The fluorescence intensities of the RSiNWs gradually decreased as the hypochlorite concentrations increased and finally declined to equilibrium at the concentration of about 80 × 10−6 m. As can be seen in Figure 2b, the fluorescence intensities of the RSiNWs linearly depend on the concentrations of the hypochlorite within 0–50 × 10−6 m.

Then the responses of the RSiNWs to various ROS, involving H2O2, HO•, TBHP, TBO•, •O2−, NO•, ClO−, were investigated by adding them independently to 200 µg mL−1 suspended system. The RSiNWs fluorescence intensities at 750 nm decreased distinctly after the addition of ClO−, while other ROS exhibited a negligible influence change on the fluorescence intensities (Figure 2c). Such good selectivity maybe comes from suitable oxidized potentials of RSiNWs.15, 18, 19 The responses of the RSiNWs to other analytes (Mg2+, Cu2+, Fe3+, Zn2+, Co2+, Ca2+, Fe2+, Ba2+, Pb2+, Cr3+, Mn2+, Ni2+, K+, Na +, NH4F, Cl−, Br−, NO3−, NO2−, AcO−, SO42−, SO32−, PO43−, S2O82−, H2PO4−, HPO42−, HCO3−, SCN−, S2O32−) were also investigated (Figure S4a,b, Supporting Information). After addition of these analytes, negligible fluorescence changes were observed from the fluorescence spectra. In addition, bovine serum albumin (BSA) had little influence on the response of RSiNWs to hypochlorite in PBS buffer (Figure S4c, Supporting Information). These observations demonstrate that the RSiNWs sensor exhibits a favorable selectivity to the hypochlorite.
With this in mind, in order to realize a device for detection of the hypochlorite, the reaction between the sensor based on the SiNW arrays (RSiNW arrays) and the hypochlorite was analyzed. The RSiNW arrays (by CE) were placed in a glass-bottomed dish containing 1 mL PBS. Then excess hypochlorite (100 × 10−6 m) was added to the solution. The confocal fluorescence images of the RSiNW arrays before and after the treatment with hypochlorite for 20 min were recorded and illustrated in Figure S5 in the Supporting Information. As expected, the hypochlorite could result in a distinct decrease in the fluorescence intensity of the RSiNW arrays. This result reveals that the RSiNW arrays have a favorable response to the hypochlorite. The observation was also confirmed by the Z-series fluorescence images of the RSiNW arrays performed with the laser scanning confocal microscopy. Assuredly, the fluorescence intensities decreased at every step of the Z stack (Figure S6, Supporting Information) after the hypochlorite was added to the system. These Z-series fluorescence images not only confirm the favorable performance of the RSiNW arrays, but also demonstrate that the Compound 1 have been successfully modified on the whole arrays not just its top. The distinct response of the arrays to the hypochlorite implies that the RSiNW arrays could be developed as a device to monitor the hypochlorite.
The hypochlorite can be generated by oxidative reaction in macrophages at a phagosomal pH of 4.5.20 In order to use this sensor in vivo, the response of the sensor was first investigated in different pH solutions. Insignificant effect of pH from 3.95 to 7.4 on the fluorescence of the sensor was detected (Figure S7, Supporting Information). This is because the alkoxy groups of the sensor do not undergo hydrolysis and can maintain satisfiable stability in this pH range.21 This result suggests that the sensor can work well under physiological conditions.
It is known that the hypochlorite is the MPO-derived oxidant in living organisms. In other words, the hypochlorite can be generated by the MPO/H2O2/Cl− enzymatic system.22 Therefore, RSiNW arrays were employed to detect the hypochlorite produced in the enzymatic system. As depicted in Figure S8a,b in the Supporting Information, after addition of the MPO and H2O2, the fluorescence intensities of the RSiNW arrays showed an invisible change. However, the subsequent addition of Cl− could distinctly decrease the fluorescence intensities of the RSiNW arrays (Figure S8c, Supporting Information). These results demonstrate that the sensor owns a sensitive response to the hypochlorite that was generated by the MPO/H2O2/Cl− enzymatic reaction. It is indicated that present sensor has the capability to detect the hypochlorite in the living organism.
Considering the virtues of the CE-fabricated SiNWs such as good rigidity and straightness, the sensor based on the long SiNWs (single RSiNW sensor) was utilized to detect the hypochlorite in single biological cells. The fluorescence images of the single RSiNW sensor were obtained after the single RSiNW sensor was incubated with different concentrations of hypochlorite for 30 min, and the results were shown in Figure 3a–f. Similar to the observation of RSiNWs suspension (by CVD), the fluorescence intensities of the single RSiNW sensor decreased with the increase of the hypochlorite concentrations. The fluorescence intensities along scanning in the direction from S to E in Figure 3a–f were integrated and compared in Figure 3g. The fluorescence intensity of the single RSiNW sensor obviously decreased after it reacted with hypochlorite and was negatively related to the hypochlorite concentrations. These data denote the potential feasibility of the single RSiNW sensor for intracellular hypochlorite.

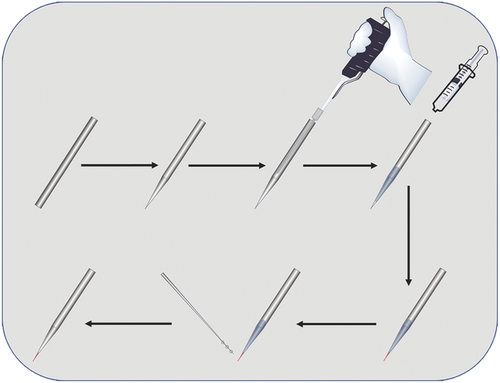
To apply the single RSiNW sensor in a single cell, the single RSiNW sensor was loaded to the tip of the micropipette (Figure 4). As shown in Figure 4, the assembly was realized by injecting the sensor suspension into the micropipette and then a syringe was used to put some pressure on the micropipette until suitable length of a single RSiNW sensor was revealed at the tip. At last, the micropipette was fixed by epoxy. The morphology of the as-prepared single RSiNW sensor was shown in Figure 5a,b. Once built, the sensor can be installed to the micromanipulator and carefully inserted into HeLa cells. As shown in Movie S1 in the Supporting Information, although the HeLa cell was penetrated by the sensor and it elastically deformed upon insertion and extraction, the morphology of the HeLa cell remained unchanged. As shown in Figure 5c, the bright field image indicated that the single RSiNW sensor was inserted into the HeLa cell. And Figure 5d exhibited the confocal fluorescence image of the HeLa cells inserted by the single RSiNW sensor. The green fluorescence (500–550 nm, Figure 5e) came from the 3, 3′-dioctadecyloxacarbocyanine perchlorate (DIO)-stained cell membrane and the red fluorescence (670–750 nm, Figure 5f) resulted from the single RSiNW sensor. Then 5 × 10⁻⁶ m NaClO as the hypochlorite source was added to the solution and the system was incubated for 30 min. Figure 5g–i showed the confocal fluorescence images of the HeLa cells inserted by the single RSiNW sensor after the incubation with 5 × 10⁻⁶ m NaClO for 30 min. It is obvious that the significant change in fluorescence intensity can be observed (Figure 5d,g). However, the green fluorescence has little change (Figure 5e,h) but the intensity of the red fluorescence has a distinct decrease (Figure 5f,i) owing to the oxidation of the single RSiNW sensor by the hypochlorite. Figure 5j shows the change in the integrated red fluorescence intensities of scanning along the direction from S to E in Figure 5f,i. By selecting five different locations and integrating their fluorescence intensities, the error bars were obtained. Similar to the observations on the single RSiNW sensor in vitro (Figure 3g), the fluorescence intensity of the single RSiNW sensor inserted into the HeLa cell obviously decreased after incubation with the hypochlorite. These results indicate that the single RSiNW sensor has a distinct response to the hypochlorite in HeLa cells and owns a potential application to determine the intracellular hypochlorite.
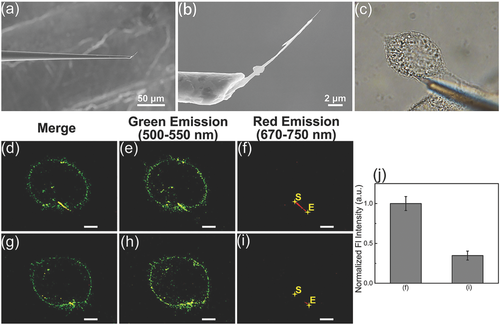
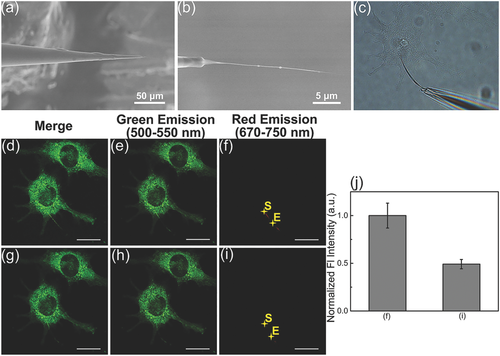
Treated with lipopolysaccharide (LPS) and phorbol myristate acetate (PMA), the RAW264.7 cell is able to produce the hypochlorite.23 Here, as a demonstration of the sensor application for a single cell, the RAW264.7 cell was employed to investigate the response of the single RSiNW sensor to the endogenous hypochlorite. After the RAW264.7 was treated with 1 µg mL−1 LPS for 24 h and subsequently by PMA for 2 h, the as-treated cells were stained by the DIO. Then the single RSiNW sensor (Figure 6a,b) was inserted into the stained RAW264.7 with the help of the microoperation. Figure 6c showed the bright field image of the RAW264.7 cell inserted by the single RSiNW sensor. The penetration of the sensor into the cell can also be further confirmed by the 3D imaging (Movie S2, Supporting Information) and Z-series fluorescence images (Figure S9 and Movie S3, Supporting Information). As shown in Figure 6d–f, the confocal fluorescence image, the green (500–550 nm) and red (670–750 nm) fluorescence images of the initial RAW264.7 cells were observed after the single RSiNW sensor was pierced into the cell. Similar to the observation on the HeLa cells, the green fluorescence (Figure 6e) came from the DIO-stained cell membrane and the red fluorescence (Figure 6f) resulted from the single RSiNW sensor. After 30 min, the change of the fluorescence intensities was observed and the results were shown in Figure 6g. Specifically, there was an obvious decrease of the red fluorescence (Figure 6i) while no significant change can be observed from the green fluorescence (Figure 6h). The normalized integrated fluorescence intensities along the direction from S to E in Figure 6f,i were shown in Figure 6j. The error bars were obtained by selecting five different locations and integrating their fluorescence intensities. Analogous to the observation of the exogenous hypochlorite in HeLa cells, the red fluorescence intensity of the single RSiNW sensor inserted in the treated RAW264.7 for 30 min distinctly decreased by the endogenous hypochlorite. These observations demonstrate that the single RSiNW sensor can be used to detect the endogenous hypochlorite at the single-cell level.
3 Conclusion
In conclusion, the fluorescent sensors based on SiNWs for the selective signaling of the hypochlorite were fabricated by rationally modifying a near-infrared dye, IR780 on the surface of the SiNWs. The sensors exhibited high sensitivity and linear dependence of the fluorescence intensities on the hypochlorite concentrations within 0–50 × 10−6 m. Significantly, detecting the endogenous hypochlorite at single-cell level was realized by facilely inserting the single RSiNW sensor into the living cell. The present sensor as a novel tool can be used to track the activity of the intracellular hypochlorite in real time. This approach would pave a broad way for further development of other single-cell probes.
4. Experimental Section
Reagents and Materials: 3-Aminopropyltriethoxysilane (APTES), IR780 were purchased from J&K Scientific Ltd. LPS, PMA, and DIO were bought from Sigma-Aldrich. Other reagents were purchased from Beijing Chemical Regent Co. All reagents and chemicals were AR grade. ClO− used in the paper came from NaClO.
Instruments and Spectroscopic Measurements: Hitachi S-4800FEG scanning electron microscope (SEM), JEOL-2100F transmission electron microscopy (TEM; acceleration voltage = 200 kV); ThermoFisher Scientific ESCALAB 250Xi XPS (voltage = 15 kV); Hitachi U-3900 spectrophotometer for absorption spectra; Hitachi F-4600 spectrophotometer for fluorescence spectra; Nikon A1 laser scanning confocal microscope for fluorescence images. Microoperation was realized by an MP-285 micromanipulator. The micropipette was prepared by a Sutter P97 micropipette puller. The single RSiNW sensor was fixed under the monitoring via a home-made micromanipulation system, which could trace the movement and position of the single RSiNW sensor and capture its bright field images. Furthermore, the light path of this micromanipulation system was coaxial with the light path of the Nikon A1 laser scanning confocal microscope which was used to capture the fluorescence images.
Fabrication of SiNWs and SiNW Arrays: A typical CVD method as the previous report was used for the preparation of SiNWs.16 The structure and morphologies of SiNWs were recorded by TEM. SiNW arrays were prepared according to silver-assisted CE method.17 First, Si (n-type, ⟨100⟩) strips were cleaned by acetone, ethanol, and deionized water for 10 min separately. Then the strips were put into the solution of 5 × 10⁻³ m silver nitrate and 4.6 m HF for 8 min to have silver seeded. After that, they were transported to the etching solution which consisted of 0.2 m H2O2 and 4.6 m HF at 50 °C. The lengths of SiNWs could be regulated according to the etching time. The short SiNW arrays etched for 20 min were used for the array experiment and the long SiNW arrays etched for 2 h were employed for single-cell study. At last, the strips were put in the chloroazotic acid for the removal of silver. The long SiNW arrays were ultrasonicated in the ethanol to drop off the SiNWs from the Si substrate to provide long single SiNW for single-cell research. The morphologies of SiNW arrays were recorded by SEM.
Synthesis of Compound 1 (Scheme S1, Supporting Information): IR780 (133 mg, 0.2 mmol) and APTES (190 µL, 0.8 mmol) were added to 50 mL anhydrous DMF. And then the solution was stirred at 120 °C for 30 min under nitrogen. The solvent was evaporated and the crude product was purified by column chromatography on silica gel (DCM/MeOH = 10:1), affording the product (Compound 1; 37 mg, 25%) as blue powder. 1H NMR (400 MHz, MeOD) δ 8.15 (s, 1H), 7.97 (s, 1H), 7.86 – 7.51 (m, 4H), 7.34 (s, 1H), 7.32 – 7.16 (m, 2H), 7.08 (dd, 2H), 5.44 – 5.21 (m, 2H), 3.82 (dd, 4H), 3.69 – 3.38 (m, 4H), 2.59 – 2.45 (m, 2H), 2.25 – 2.11 (m, 2H), 2.09 – 1.96 (m, 2H), 1.73 (dt, 12H), 1.47 – 1.40 (m, 2H), 1.38 – 1.23 (m, 9H), 1.23 – 1.09 (m, 4H), 0.99 (dd, 5H), 0.88 (dd, 4H), 0.76 – 0.62 (m, 2H), 0.12 – 0.03 (m, 2H). FIMS + p MS (Figure S10, Supporting Information): m/z calculated M+ for C45H66N3O3Si+ 724.49; found, 724.4844. The UV–vis absorption and fluorescence spectra of Compound 1 are shown in Figure S11 in the Supporting Information.
Modification of SiNWs: The as-fabricated SiNWs should be hydroxylated at first for the following modification. The hydroxylation process was identical with the previous report of our group.16 The decoration steps of SiNWs was shown in Scheme 1. The dried hydroxylated SiNWs were added to 50 mL distilled anhydrous toluene under N2. Then residual water was removed by segregator, and there left 10 mL solvent in the flask. After that, 5 mg Compound 1 was added to the leaving distilled toluene. The suspension was heated to 90 °C and stirred for 24 h under N2. After the reaction, the product was collected by filtration and repeatedly washed with ethanol. The product was defined as RSiNWs. Same modifying procedures were used for the SiNW arrays. The modified SiNW arrays were named as RSiNW arrays and the decorated long SiNWs were named as the single RSiNW sensor.
Process of Loading the Single RSiNW Sensor (Figure 4): First, capillary (Sutter, BF100-50-10, melting point: 545 °C) was utilized to fabricate the micropipette by Sutter P-97 micropipette puller. The parameters were set as follows: Heat: 545 °C, Pull: 0, Velocity: 30, Delay: 1, Pressure: 500. Second, the single RSiNW sensor were dispersed in the ethanol. A drop of the suspension was injected into the micropipette from one end by a pipettor with 20 µL pipette tip. And then, the suspension was pushed from the end to the tip of the micropipette by a syringe. The pressing course was stopped until a suitable length of a single RSiNW sensor was revealed at the tip. Finally, epoxy was utilized to fix the single RSiNW sensor at the tip of micropipette with the assistance of microoperation. The as-prepared single RSiNW sensor device was placed for 24 h to guarantee the firmness of the sensor. This protocol ensured stable connection, and high production efficiency for preparing one single RSiNW sensor with a success rate at about 85%. The morphology of the as-fabricated device was characterized by SEM. Before the SEM observation, the micropipette was sputter-coated with Au. More details about the fabrication can be seen in the Supporting Information.
Cell Culture: The cells were incubated at 37 °C in 5% CO2. Before the in vivo experiments, cells were seeded in the glass-bottomed cell culture dishes and cultured in growth medium in 5% CO2 at 37 °C. HeLa cells were stained by DIO before the use. When RAW 264.7 cells were used, further treatment was needed. RAW264.7 cells seeded in the glass-bottomed cell culture dishes were incubated with 1 µg mL−1 LPS for 24 h and then treated with PMA for 2 h. Before the observation, 3 µL 1 µg mL−1 DIO was dropped into the culture and incubated for 10 min for cell membrane staining. After the incubation, the media was washed with PBS buffer for five times and eventually incubated in 1 mL PBS buffer.
Selectivity Study: The ROS was generated according to the literatures.18, 24 A solution of 200 µg mL−1 RSiNWs was prepared in PBS buffer. In order to investigate the selectivity of the RSiNWs, various reactive species (H2O2, HO•, TBHP, TBO•, •O2−, NO•, ClO−; final concentration: 50 × 10−6 m) were, respectively, added to the solution, and their fluorescence spectra were performed with 620 nm as the excitation wavelength after 1 min of incubation at room temperature. RSiNWs were also treated with other substances to further check the selectivity. Various analytes (final concentration: 10 × 10−3 m) were represented by Mg(NO3)2, CuCl2, FeCl3, ZnCl2, CoCl2, CaCl2, FeCl2, BaCl2, PbCl2, CrCl3, MnCl2, NiCl2, KCl, NaCl, NH4F, KBr, NaNO3, NaNO2, CH3COOK, Na2SO4, Na2SO3, Na3PO4, K2S2O8, NaH2PO4, Na2HPO4, NaHCO3, NaSCN, and Na2S2O3.
Statistical Analysis: Statistical analysis was performed using Origin software program produced by OriginLab Corporation. Movies were operated using Format factory produced by Free Time.
Acknowledgements
This work was supported by National Key R&D Program of China (2016YFA0200800), NSFC (51672284), Beijing Natural Science Foundation (2181002), and Chinese Academy of Sciences (1A1111KYSB20180017, QYZDJ-SSW-JSC032, XDB17000000).
Conflict of Interest
The authors declare no conflict of interest.


