Chip-Based Heat Stimulation for Modulating Signal Propagation in HL-1 Cell Networks
Abstract
Signal propagation in cardiac cell networks can be modulated by heat stimulation. Here, the response of a connected HL-1 cardiomyocyte cell network to the application of confined heat stimuli using Ca2+ imaging is investigated. Localized temperature gradients are generated by resistive heating via microwire arrays on a chip surface, which serves as a substrate for growing a confluent cell network. It is demonstrated that upon heat stimulation, the velocity of the propagating Ca2+ wave in the network is locally increased, leading to a deformation of the wavefront. Furthermore, evidence of a change in the signal propagation direction caused by a relocation of the pacemaker cell is shown. This effect might be used in future applications, where heat is employed as an alternative modality for cell stimulation protocols.
1 Introduction
The healthy body temperature of endotherms falls within a rather narrow window. Lowering or increasing the temperature may cause metabolic and functional problems in cardiac activity.1 Cardiac muscle contraction depends on intracellular Ca2+ dynamics.2 The Ca2+ release from the sarcoplasmic reticulum increases the cytosolic Ca2+ concentration and triggers a propagating Ca2+ transient. When the Ca2+ concentration is high enough, contraction of the cardiac muscle cell occurs. Once the intracellular Ca2+ concentration decreases again, the cardiac muscle cell relaxes.3, 4 Cardiac Ca2+ signaling relies on a few critical molecular players like ryanodine receptors, voltage-gated Ca2+ channels, and Ca2+ pumps, which are affected by temperature changes.5-8 However, assessing the effects of local temperature inhomogeneities at the cellular level is still difficult.9, 10 So far, most investigations on the effect of temperature on Ca2+ transients in cardiac myocytes employ ambient temperature control.11-13 This way, a global response is observed potentially masking a possible influence of local temperature effects. Heating cells in only a localized area can be achieved using a focused infrared laser.14-16 This approach has been demonstrated for the excitation of action potentials in muscle and nerve cells.17, 18 However, it requires the alignment of microscope setups that are difficult to parallelize and cannot be easily applied in long-term or high-throughput studies.19 Alternatively, electromagnetically excited nanoparticles have been applied for localized heating in several reports.20-22 However, heat dissipation for a large number of nanoparticles dispersed in a macroscopic region of tissue produces a global rise in temperature.23 Moreover, the toxicity of nanoparticles usually imposes a high risk of cell damage.24
Recently, microsystems have created new opportunities for applying spatially and temporally controlled stimuli and recording cellular activity.25-30 Examples demonstrate the application of microchip devices for electrical stimulation and studies of signal propagation in cardiac myocyte networks.31-35 Previously, we have used microwire array chips to induce thermal lesions in cell cultures, effectively separating network connectivity.36 Here, we present the application of microwire arrays for the introduction of localized hyperthermia to modulate signal propagation in cardiomyocyte networks. The heating of individual microwires allows generating highly localized temperature gradients. We apply this method to study dynamic changes in intracellular Ca2+ signals in response to local heat stimuli. We demonstrate that heating can lead to localized effects on Ca2+ signal propagation influencing the propagation speed, direction, and the position of the pacemaker cell.
2 Results and Discussion
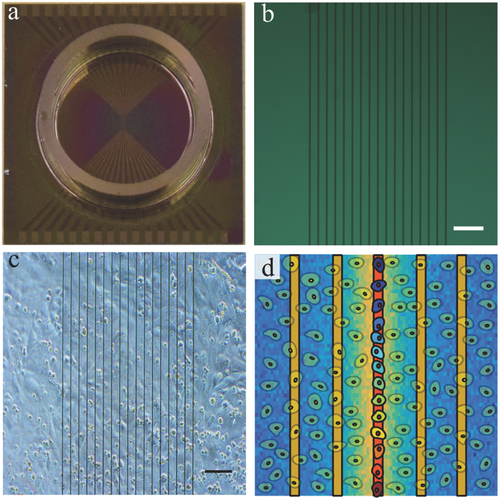
HL-1 cardiomyocytes have proven to be useful for studying many aspects of cardiac biology in vitro.37 In order to investigate the effect of localized heat stimulation on cardiomyocytes, a layer of HL-1 cells was grown on a microwire array and thermal stimulation was applied to induce confined heating on the cell network. Figure 1a,b shows an exemplary microwire array chip that was used in the experiments. HL-1 cells that were plated on microwire chips formed confluent layers after 2–4 d. The cells began to spontaneously generate contractile activity (beating) ≈1 d after reaching confluency. Figure 1c shows a confluent culture of cardiac cells growing on the microwire array. A schematic of a thermal stimulation experiment affecting a linear region in the cell network is illustrated in Figure 1d. To evaluate the effects of local heating on spatiotemporal Ca2+ dynamics, Ca2+ imaging and Ca2+ propagation analyses were performed.
2.1 Effect of Localized Heat Stimulation on Ca2+ Signal Propagation
In this study, we focused on the influence of localized heat stimulation on the propagation of Ca2+ signals in HL-1 cell cultures. Heat was generated by applying electrical power to an individual microwire on the chip. We performed finite element simulations (Comsol Multiphysics) to assess the temporal change in the temperature during stimulation (see the Supporting Information). Figure S1 (Supporting Information) shows the time-dependent temperature profile on top of the stimulating wire. The temperature profile corresponds to the power being turned on and off (Figure S1a, Supporting Information). Figure S1b (Supporting Information) shows the temperature profile on the surface of the chip. As expected, the temperature exhibits a sharp gradient in the vicinity of the microwire and quickly reaches steady state within ≈100 ms after applying a power of 0.7 W (see Figure S1c, Supporting Information). The temperature rapidly reaches ambient temperature at 21 °C within ≈100 ms after switching off the power (Figure S1d, Supporting Information). We evaluated the dependence of the cardiac cells' activity on temperature by performing optical recordings during heat stimulation. To visualize the Ca2+ signal propagation in the cardiac cell network, cells were stained with a Ca2+-sensitive fluorescence dye (Fluo-4, AM). Ca2+ imaging videos of spontaneous as well as thermally stimulated activity were recorded. Figure S2 (Supporting Information) shows representative frames of the fluorescent signal captured with and without thermal stimulation.
In order to evaluate the influence of heat on the Ca2+ signal propagation, the Ca2+ imaging video was analyzed by performing a cross-correlation of the local fluorescence intensity as can be seen for three exemplary cell culture experiments in Figure 2a. The colors in the images indicate the time delay between the occurrences of the Ca2+ signal at particular positions within the network. The signal propagates in the direction from blue to red. In these experiments, the Ca2+ imaging videos were recorded for 1 min without stimulation (left column) and 30 s with thermal stimulation (right column). As evident from Figure 2a, the change of Ca2+ wave propagation upon heat stimulation is clearly visible.
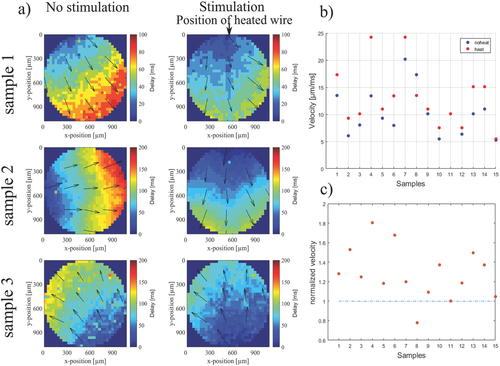
We analyzed the signal propagation velocity by dividing the spatial extension by the difference of maximum and minimum delay values within a circular region (Figure 2b). Using this approach, the difference in the propagation direction of the signal was intentionally neglected. Although the absolute velocities as well as the relative changes in velocity (Figure 2c) vary significantly between different cell culture experiments, we observe an increase of Ca2+ wave propagation velocity upon heating in ≈87% of all the samples investigated (n = 15).
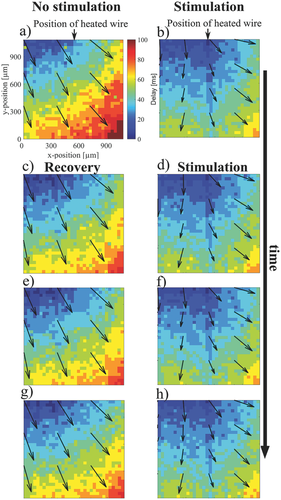
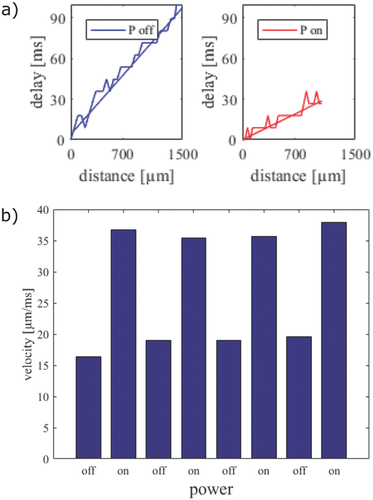
While these results give a qualitative indication on the effect of heat stimulation on HL-1 cells, they do not provide a quantitative measure of the local propagation velocity within heated zones compared to nonheated zones. To investigate the influence of the stimulus on the local propagation velocity of the Ca2+ signals, we therefore analyzed correlation plots of multiple stimulation experiments shown in Figure 3. In these experiments, Ca2+ imaging videos from the same cells were recorded during repetitive stimulation and subsequent recovery phases. The change in the Ca2+ propagation pattern was reversible upon successive application of thermal stimuli as can be seen by comparing the patterns in the recovery phase (Figure 3, left column) with the patterns during stimulation conditions (Figure 3, right column). Overall, the original propagation pattern was observed during recovery phase in 73% (n = 15) of the experiments. The time delay of the signals in the different experiments clearly indicates that the Ca2+ signal propagates faster during thermal stimulation as described above. As we were interested in the propagation velocity within high-temperature zones, we now evaluated the delay time along the propagation direction of the Ca2+ signal with and without heating. Figure 4a shows the delay time versus the distance of signal propagation, evaluated along the diagonal of the frame without thermal stimulation (blue trace) and along the y-axis in the frame with thermal activation (red trace). The data were fitted using a linear function assuming a constant speed along the propagation direction. The inverse slope of this fit yields the propagation speed of the Ca2+ signal. As can be seen, the slope without thermal stimulation is steeper than the one with stimulation. Quantitative values of the propagation velocity for repetitive experiments with and without stimulation are shown in Figure 4b. During heat activation, the propagation speeds are higher than 35 µm ms−1, whereas without heating, the propagation speeds range between 16 and 20 µm ms−1. We attribute the slight increase of signal velocity in the recovery phase to a minor global rise in temperature due to repeated heat stimulation. Interestingly, as the propagation appears to be affected in particular in the vicinity of the heated region, this results in a deformation of the signal wavefront. In order to investigate the effect of local velocity changes in the heated area, we compared the propagation speed within the network along regions of different temperatures. The result is shown in Figure S3 (Supporting Information). The red trace indicates the Ca2+ signal propagation directly on the heated wire and the blue trace indicates the Ca2+ signal propagation at a distance of 300 µm from the heated wire. Both traces were evaluated along the vertical axis. The observed difference in propagation speed of the Ca2+ signals is in the range of 10 µm ms−1. This demonstrates that microscopic heating can induce local variations of Ca2+ signal propagation speed within a connected network.
2.2 Effect of Localized Heat Stimulation on the Pacemaker Position
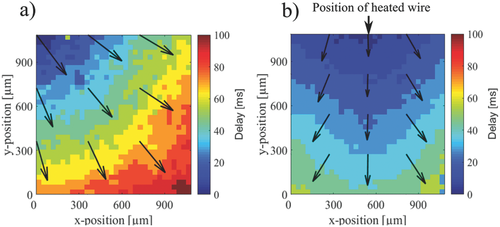
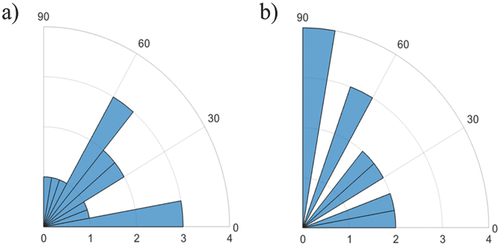
The observed alterations in the propagation direction of the Ca2+ wave upon thermal stimulations might be caused by two effects: First, the local change in propagation velocity can cause an effective shift of the propagation direction along the wire. Second, the position of the pacemaker of the cell layer can be directly affected by the thermal stimulation leading to an alteration of the propagation direction. Such a scenario is shown in Figure 5. In Figure 5a, we see the propagation pattern without thermal stimulation. Here, the origin of the intrinsic Ca2+ signal is in the top left corner and the signal propagates to the bottom right corner. When applying thermal stimulation, the signal origin in the field of view relocates to a position on the microwire and the propagation direction shifts along the y-direction (Figure 5b). A shift in signal origin toward heated regions was detected in about 27% (n = 15) of the experiments. Possibly, the mechanism of changing the pacemaker location can be explained by a local modulation of the kinetics of cellular processes affecting the beating pattern. This causes a cell on the wire to become more active than the network's current pacemaker, which leads to a change in the signal origin. While not directly related, the effect is similar to electrical stimulation where a cell beating faster than the intrinsic pacemaker can “hijack” the network and become the new pacemaker cell.38, 39 One might assume that the heat stimulation along a linear region would generate a signal pattern parallel to the heated microwire. However, contrary to electrical stimulation, which unequivocally forces the stimulated cells to fire, heat exposure as applied in this study, does not directly stimulate the cells in the high-temperature zone. An increase of the beating frequency has been previously observed for global temperature stimulation.40 To assess if, correspondingly, the Ca2+ signal direction is influenced by local heat activation, we compared the average angle distribution of spontaneous signal propagation directions with those during local heat stimulation. As can be seen in Figure 6, the Ca2+ signal directions tend to be shifted by the local heat stimulation clustering along the direction of the heated wire (90°). Yet, further experiments on geometrically defined cell-network structures using primary cardiomyocytes and ambient temperatures around 37 °C should be conducted to assess the required conditions for pacemaker relocation during heat stimulation. Such an approach might make it possible to elucidate the underlying mechanisms for heat-controlled pacemaker activation.
3 Conclusion
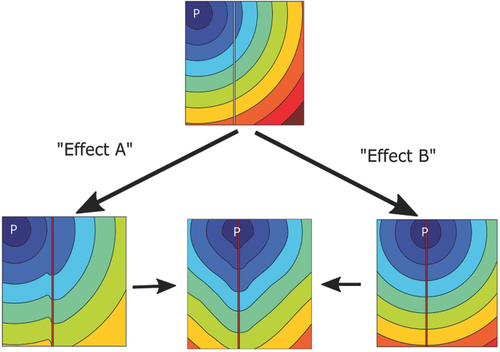
Microwire arrays are effective tools for applying localized thermal stimulation to cells in culture. We conclude that a localized temperature stimulation can cause two possible phenomena that modulate the signal propagation in HL-1 cell networks as depicted in the schematic of Figure 7. First, the Ca2+ wave pattern can be disturbed in the heated region due to localized changes in the propagation velocity (Effect A). Second, another pacemaker cell within the heated region can be thermally activated (Effect B). The combination of these two effects can be seen in the bottom center of the schematic, which is the disturbance of the signal wavefront together with the relocation of the pacemaker into the heated region. We believe that heat stimulation in structured networks or tissues will allow more specific studies on pacemaker selection and local Ca2+ effects. This can be achieved by employing nanofabrication technologies to modify the geometry of the structured heating zones and confining cell growth to specific regions, for example, within a microfluidic compartment.41
4 Experimental Section
Microfabrication of Microwire Array: Microwire arrays were fabricated in the clean room of the Helmholtz Nanoelectronic Facility. The arrays consist of 17 wires with a width of 2.5 µm that were structured and isolated using standard microfabrication technology. The fabrication process is briefly described as follows. A thermally oxidized 4 in. silicon wafer of 500 µm thickness was used as a substrate. First, a double-layer resist (LOR3B; Microchem, Newton, MA and AZ nLOF 2020; MicroChemicals, Ulm, Germany) was spin-coated onto the wafer and the microwires (interwire spacing of 28 µm) were patterned using optical lithography. After exposure and development (MIF326, Microresist Technology, Berlin, Germany), a metal stack (10 nm Ti/300 nm Au/10 nm Ti) was deposited by electron-beam vapor deposition. The titanium layers served to facilitate adhesion of the gold structures to the substrate and the following passivation layer. After structuring the microwire array, a polyimide layer (PI2545, HD Microsystems GmbH, Germany) was spin-coated (6000 rpm, 30 s) to passivate the chip for cell-culture conditions. For electrical connection of the chip to the power supply system, a second photolithography was performed to locally remove the passivation layer on the outer contact pads.
Cell Culture: The HL-1 cell line used in this experiment was derived from mouse cardiomyocyte tumor.37 The HL-1 cardiac muscle cells show spontaneous action potentials and subsequent contraction after the cells reach confluency. Cells were cultured in T25 flasks at 37 °C and 5% CO2 in Claycomb Medium (51800C, Sigma) supplemented with FBS (10%, ThermoFischer Scientific), penicillin-streptomycin (100 µg mL−1, ThermoFischer Scientific), norepinephrine (0.1 × 10⁻³ m, Sigma), and l-glutamine (2 × 10⁻³ m, ThermoFischer Scientific) in a humidified incubator. After the cells reached confluency and started beating, they were cultured on the microwire chips. Before plating the cells, the microwire chips were sterilized with UV light for 1 h. The chips' surface was then incubated in a mixture of fibronectin (5 µg mL−1, Sigma) and gelatin (0.2 mg mL−1, Sigma) for ≈60 min. Then 500 µL of cell suspension was seeded on the chips and incubated under normal conditions (37 °C, 5% CO2). Cells were plated to reach confluency on DIV2.
Thermal Stimulation and Ca2+ Imaging: Thermal stimulation was applied to the cells via resistive heating. The heating was generated by applying a power of 0.7 W on an individual wire for 30 s using a custom LabView software.36 Thermal stimulation was applied to the cells in normal growth medium. The electrical power was applied to one microwire for 30 s (P = 0.7 W). The resting time between each stimulation pulse was 1 min. In order to observe the dependence of cell activity on local heating, HL-1 cells were stained with a Ca2+ sensitive dye (4 × 10⁻⁶ m Fluo-4 AM, ThermoFisher) for 15–30 min. The medium was then exchanged and the sample was transferred to the measurement setup. While performing thermal stimulation, the Ca2+ fluorescence signal was recorded via an emCCD camera (Hamamatsu C9100-13). The Ca2+ signal relative to the basal fluorescence was evaluated. The signal at an individual pixel was calculated by subtracting the average fluorescence of the corresponding frame and dividing the result by the pixel's average intensity over time. As the temperature was modulated during the experiment, the effect of temperature on the Ca2+-sensitive fluorescent probe (Fluo-4) needs to be considered. It is known that the dissociation constant of Fluo-4 decreases with increasing temperature.42 This effect may change the intensity and the temporal characteristics of the fluorescence signal. However, the signal propagation based on the temporal correlation of the signals was measured (see the Supporting Information for details). Thus, the changing properties of the indicator with increasing temperature should be negligible in these experiments.
Statistical Analysis: The images were captured with a resolution of 512 × 512 pixels using 4 × 4 binning and sequential subtraction via the HOKAWO software of the emCCD camera. Data processing was performed using MATLAB. Where applicable, the data are represented as mean values ± standard deviation and the sample size is given in parenthesis.
Acknowledgements
The authors thank Marko Banzet for help with the fabrication of the microwire arrays. The authors acknowledge funding by the Bernstein Center for Computational Neuroscience Munich (Grant No. 01GQ1004A, BMBF).
Conflict of Interest
The authors declare no conflict of interest.


