Proteomic networks of gray and white matter reveal tissue-specific changes in human tauopathy
Abstract
Objective
To define tauopathy-associated changes in the human gray and white matter proteome.
Method
We applied tandem mass tagged labeling and mass spectrometry, consensus, and ratio weighted gene correlation network analysis (WGCNA) to gray and white matter sampled from postmortem human dorsolateral prefrontal cortex. The sampled tissues included control as well as Alzheimer's disease, corticobasal degeneration, progressive supranuclear palsy, frontotemporal degeneration with tau pathology, and chronic traumatic encephalopathy.
Results
Only eight proteins were unique to gray matter while six were unique to white matter. Comparison of the gray and white matter proteome revealed an enrichment of microglial proteins in the white matter. Consensus WGCNA sorted over 6700 protein isoforms into 46 consensus modules across the gray and white matter proteomic networks. Consensus network modules demonstrated unique and shared disease-associated microglial and endothelial protein changes. Ratio WGCNA sorted over 6500 protein ratios (white:gray) into 33 modules. Modules associated with mitochondrial proteins and processes demonstrated higher white:gray ratios in diseased tissues relative to control, driven by mitochondrial protein downregulation in gray and upregulation in white.
Interpretation
The dataset is a valuable resource for understanding proteomic changes in human tauopathy gray and white matter. The identification of unique and shared disease-associated changes across gray and white matter emphasizes the utility of examining both tissue types. Future studies of microglial, endothelial, and mitochondrial changes in white matter may provide novel insights into tauopathy-associated changes in human brain.
Introduction
Tauopathies are neurodegenerative diseases characterized by abnormal accumulation and hyperphosphorylation of tau. As a major underlying cause of dementia, tauopathies like Alzheimer's disease (AD), frontotemporal degeneration (FTD-tau), corticobasal degeneration (CBD), progressive supranuclear palsy (PSP), and chronic traumatic encephalopathy (CTE) represent a global public health concern. Tau accumulation can vary by cell type and region, and symptoms can include changes in memory, personality, executive function, language, and motor skills.1-3 Given this heterogeneity, studies that include multiple tauopathies may provide clarity on the variable nature of tauopathy.
Advances in proteomic profiling and bioinformatics have deepened our understanding of how the brain changes in neurodegenerative disease. Mitochondrial dysfunction,4, 5 glial reactivity,4, 6 the spliceosome,7, 8 and the matrisome9 are just a few of the processes and pathways that proteomic studies have further implicated in neurodegenerative disease. These studies have primarily used tissue from gray matter (GM), the area of the brain concentrated with neuronal cell bodies. However, tau-mediated neurodegeneration also impacts white matter (WM), the area of the brain in which axons are concentrated. White matter degeneration is associated with tau deposition in AD10 and tau accumulates in WM in a disease-specific manner.11 Thus, proteomic studies that include WM may provide a more complete understanding of how tauopathy impacts the brain.
With this work, we aimed to identify and compare how the GM and WM proteomes change in tauopathy. We dissected GM and WM from human dorsolateral prefrontal cortex (DLPFC) and employed tandem mass tagged (TMT) labelling and mass spectrometry. Using differential expression, clustering, cellular deconvolution, and weighted gene correlation network analyses (WGCNA), we defined GM and WM tissue-specific, disease-associated proteomic changes in human tauopathy.
Methods
Collection of human postmortem brain
Human brain tissues were obtained and processed as previously described, under proper Institutional Review Board protocols.12 Samples of fresh frozen dorsolateral prefrontal cortex (DLPFC) were obtained from the Emory Goizueta Alzheimer's Disease Research Center Neuropathology Brain Bank in Atlanta, Georgia and from the Veteran's Affairs-Boston University Concussion Legacy Foundation Brain Bank in Boston Massachusetts. Specimens were selected for this study based on demographics and neuropathological diagnosis (Tables 1 and 2). Seven FTD-tau cases had familial MAPT mutations and two were sporadic with Pick's pathology.
| Overall, N = 63 | Control, N = 12 | AD, N = 12 | CBD, N = 4 | FTD, N = 9 | PSP, N = 5 | CTE I, N = 5 | CTE II, N = 5 | CTE III, N = 5 | CTE IV, N = 6 | p-valuea | |
|---|---|---|---|---|---|---|---|---|---|---|---|
| PMI (h), median (IQR) | 15 (7–42) | 6 (6–8) | 7 (6–13) | 7 (4–12) | 15 (7–18) | 15 (11–23) | 48 (24–48) | 48 (36–48) | 48 (48–72) | 53 (48–68) | <0.001 |
| Age at death (years), median (IQR) | 65 (60–72) | 60 (55–74) | 68 (61–70) | 67 (64–75) | 64 (60–65) | 75 (70–83) | 30 (27–60) | 70 (60–70) | 60 (40–70) | 73 (63–79) | 0.12 |
| Sex, n (%) | 0.032 | ||||||||||
| Female | 17 (27) | 6 (50) | 6 (50) | 0 (0) | 4 (44) | 1 (20) | 0 (0) | 0 (0) | 0 (0) | 0 (0) | |
| Male | 46 (73) | 6 (50) | 6 (50) | 4 (100) | 5 (56) | 4 (80) | 5 (100) | 5 (100) | 5 (100) | 6 (100) |
- a Kruskal–Wallis rank sum test; Fisher's exact test. p-values <0.05 are bold to indicate statistical significance.
| Overall, N = 61 | Control, N = 12 | AD, N = 12 | CBD, N = 4 | FTD, N = 9 | PSP, N = 4 | CTE I, N = 4 | CTE II, N = 5 | CTE III, N = 5 | CTE IV, N = 6 | p-valuea | |
|---|---|---|---|---|---|---|---|---|---|---|---|
| PMI (h), median (IQR) | 13 (7–37) | 6 (6–8) | 7 (6–13) | 7 (4–12) | 15 (7–18) | 13 (11–27) | 36 (24–48) | 48 (36–48) | 48 (48–72) | 53 (48–68) | <0.001 |
| Age at death (years), median (IQR) | 65 (60–71) | 60 (55–74) | 68 (61–70) | 67 (64–75) | 64 (60–65) | 73 (68–77) | 45 (28–63) | 70 (60–70) | 60 (40–70) | 73 (63–79) | 0.33 |
| Sex, n (%) | 0.042 | ||||||||||
| Female | 17 (28) | 6 (50) | 6 (50) | 0 (0) | 4 (44) | 1 (25) | 0 (0) | 0 (0) | 0 (0) | 0 (0) | |
| Male | 44 (72) | 6 (50) | 6 (50) | 4 (100) | 5 (56) | 3 (75) | 4 (100) | 5 (100) | 5 (100) | 6 (100) |
- a Kruskal–Wallis rank sum test; Fisher's exact test. p-values <0.05 are bold to indicate statistical significance.
Sample processing, tandem mass tag (TMT) labeling, high pH fractionation, and liquid chromatography tandem mass spectrometry
GM and WM were dissected from DLPFC from the following groups: control, AD, CBD, PSP, FTD-tau, and CTE (stages I-IV). Approximately 100 mg of GM and WM was dissected with a razor blade from fresh frozen DLPFC. Clean razor blades were used for each sample to avoid cross contamination. Tissues were individually homogenized in 500 μL of urea lysis buffer (8M urea, 100 mM NaHPO4, pH 8.5), including 5 μL (100× stock) HALT protease and phosphatase inhibitor cocktail (Pierce) with a Bullet Blender (Next Advance) according to manufacturer protocols. Each tissue piece was added to Urea lysis buffer in a 1.5 mL Rino tube (Next Advance) harboring 750 mg stainless steel beads (0.9–2 mm in diameter) and blended (2 × 5 min at 4°C). Protein supernatants were transferred to 1.5 mL Eppendorf tubes and sonicated (Sonic Dismembrator, Fisher Scientific) 3 × 5 s with 15 s intervals of rest at 30% amplitude to disrupt nucleic acids and subsequently vortexed. Protein concentration was determined by the bicinchoninic acid (BCA) method, and samples were frozen in aliquots at −80°C. Protein homogenates (100 μg) were diluted with 50 mM NH4HCO3 to a final concentration of <2M urea and treated with 1 mM dithiothreitol (DTT) at 25°C for 30 min, followed by 5 mM iodoacetimide (IAA) at 25°C for 30 min in the dark. Protein was digested with 1:100 (w/w) lysyl endopeptidase (Wako) at 25°C for 2 h and further digested overnight with 1:50 (w/w) trypsin (Promega) at 25°C. Resulting peptides were desalted with a Sep-Pak C18 column (Waters) and dried under vacuum.
Extended methods for TMT labeling, high pH fractionation, and liquid chromatography tandem mass spectrometry are outlined in File S1.
Proteomic data analysis
An overview of data processing and normalization steps is visualized in Figure S1A. Raw files were searched using Thermo's Proteome Discoverer suite (version 2.3.0.522) with Sequest HT. Spectra were searched against a human Uniprot database downloaded April 2015 (90,293 target sequences). Search parameters included 20 ppm precursor mass window, 0.05 Da product mass window, dynamic modifications methione (+15.995 Da), deamidated asparagine and glutamine (+0.984 Da), phosphorylated serine, threonine and tyrosine (+79.966 Da), and static modifications for carbamidomethyl cysteines (+57.021 Da) and N-terminal and Lysine-tagged TMT (+229.26340 Da). Percolator was used to filter PSMs to 0.1%. Peptides were grouped using strict parsimony, and only razor and unique peptides were used for protein level quantitation. Reporter ions were quantified from MS2 scans using an integration tolerance of 20 ppm with the most confident centroid setting. Only unique and razor (i.e., parsimonious) peptides were considered for quantification. MS/MS spectra were identified using the UniprotKB Human proteome database. Peptides were assembled into proteins to determine abundances based on extracted ion intensities, and gene symbol redundancy was managed as previously described.13 Data were normalized using global internal standard (GIS) samples.
The Tunable Approach for Median Polish of Ratio (TAMPOR)14 method was applied to remove variability due to batch and remove proteins with >50% missingness. Data from GM and WM samples were split into two matrices. WGCNA network connectivity outliers were eliminated (|Z.k| > 3 SD from mean). Samples removed from the GM matrix were also removed from the WM matrix, and vice versa. Nonparametric bootstrap regression removed any residual covariance due to TMT batch according to a linear mixed model that also included (protected) diagnosis/CTE stage. The variancePartition package in R15 was used to visualize the decrease in covariance due to TMT batch after TAMPOR and bootstrap regression (Fig. S1B–E). Due to the low covariance attributed to age, sex, and postmortem interval (PMI) and the prevalence of young, male samples with longer PMIs in the CTE samples, we elected to not regress for these factors (Fig. S1E, Tables 1 and 2). The GM and WM matrices were joined, and proteins with >50% missingness were removed. The resulting data matrix was the basis for downstream analyses.
For consensus WGCNA (cWGCNA) analysis, the data were split into individual matrices (GM and WM) and proteins common to both matrices were retained. The power at which approximate scale free topology was determined at the elbow of the curve of power versus R-squared approaching an asymptote ideally with R2 = 0.8 and with overall connectivity reduced to around 100; this power was 9.0. We used the blockwiseConsensusModules function with the following parameters: deepsplit = 4, minModuleSize = 20, mergeCutHeight = 0.07, TOMDenom = “mean”, corType = “bicor,” networkType = “signed,” pamStage = TRUE, pamRespectsDendro = TRUE, and reassignThresh = 0.05.
In parallel, ratios of WM to GM protein abundances were calculated as input for a WGCNA analysis. Batch corrected and regressed data were split into individual GM and WM matrices. For each pair of samples, the GM abundance was subtracted from the WM abundance to create a WM:GM ratio. The power at which approximate scale free topology was determined at the elbow of the curve of power versus R-squared approaching an asymptote ideally with R2 = 0.8 and with overall connectivity reduced to around 100; this power was 8.5. We used the blockwiseModules function with the same parameters as was used for cWGCNA analysis. Additional cleanup was used to ensure that resulting network module members had an intramodule kME values of at least 0.28.
Cell subtype analysis with brain cell type proteome and transcriptome as reference16 was used to identify cell type markers in the WGCNA modules (both consensus and ratio). This analysis was also modified to identify WGCNA modules enriched with mitochondrial markers generated from Human MitoCarta3.017 and tissue-specific microglial markers.18 Gene ontology (GO) pathway analyses were performed using the GOparallel function.19 Hypergeometric overlap with Fisher's exact test for enrichment was used to assess enrichment of WGCNA modules or lists of differentially abundant proteins with GO terms. GO terms were derived from lists curated by the Bader Lab at the University of Toronto as described in Reimand et al.20 The database (https://baderlab.org/GeneSets) was accessed on March 1, 2023, and those GO terms were used for all GO analyses in this work. Redundant GO terms were pruned using the ontologyIndex package.21
Differential abundance was calculated with two approaches. (1) To compare GM and WM protein abundance within each disease group: GM abundance was subtracted from WM abundance for each pair of samples (one GM and one WM sample per subject) to calculate the mean of the differences, with paired t-tests and Benjamini–Hochberg FDR adjustment of p-values for multiple tests to determine statistical significance. For each protein, a sample pair was removed from the paired analysis if one of the samples was missing data. If there were not more than two pairs of samples, then that protein was also removed from the analysis. (2) To compare protein abundances between disease groups to control within GM or WM: Average control protein abundance was subtracted from average disease protein abundance, with one-way ANOVA plus Tukey's honestly significant difference (Tukey HSD) to determine statistical significance, using the parANOVA function.22
K-Means analysis was performed on samples and proteins. The number of sample clusters was designated as 2 based on a priori knowledge that the samples were derived from GM and WM. For the proteins, we reduced the dataset to proteins with no missing data (n = 4700) and used the within cluster sums of squares method within the fviz_nbclust function in the factoextra R package23 to determine to optimal number of clusters as 4. We used a random seed of 1969 and set centers equal to 4 and nstart equal to 25 in the kmeans function in the stats R package.24
Cell type deconvolution was performed using the EnsDeconv R package.25 TAMPOR and batch-regressed non-log2 transformed data were the input. The parameters for deconvolution were set with the get_params function: data_type = “singlecell-rna”, data_name = names(testdata$ref_list), n_markers = 50, Marker.Method = c(“t”, “wilcox”, “combined”, “none”, “regression”), TNormalization = “none”, CNormalization = “none”, and dmeths = c(“DCQ”, “CIBERSORT”, “ICeDT”, “FARDEEP”, “EPIC”, “hspe”). Venn diagrams were created with the ggvenn package.26
Results
Cell-type-specific proteins are differentially expressed in GM and WM DLPFC proteomes
Our prior work leveraged TMT labeling and LC–MS/MS to compare the proteomes of control and tauopathy DLPFC and temporal lobe cortex.12 These and other proteomic studies of neurodegeneration have been biased toward GM, though WM changes are known components of disease pathogenesis.11, 27-30 Thus, we aimed to identify and compare GM and WM proteomic alterations in human tauopathy to more fully understand tau-mediated neurodegeneration. We hypothesized that WM would share many changes with GM, while also demonstrating unique disease-associated changes. We dissected GM and WM from human control (n = 12), AD (n = 12), CBD (n = 4), PSP (n = 5), FTD-tau (n = 9), CTE I (n = 5), CTE II (n = 5), CTE III (n = 5), and CTE IV (n = 6) DLPFC. From a total of 126 samples (2 samples – GM and WM – per subject) across 14 TMT batches, LC–MS/MS identified over 9000 high confidence unique protein isoforms.
We found that 89.3% of the proteome or 8542 proteins were detected in at least one sample of both GM and WM (Fig. 1A). In total, 615 proteins were measured in at least one GM sample and zero samples of WM (Fig. 1A). In total, 412 proteins were measured in at least one WM sample and zero GM samples (Fig. 1A). Interestingly, just 8 proteins (ARC, NSG2, CSMD2, LRFN2, LRRTM1, PCDH7, CDH9, and KHDRBS2) were measured in all 63 GM samples and zero WM samples. Only 6 proteins (TMC7, SRCIN1, HHIP, GNG8, SLC27A6, and GJB1) were measured in all 63 WM samples and zero GM samples (Fig. 1B), all of which are enriched in oligodendroglial cell types at the transcript level.31, 32
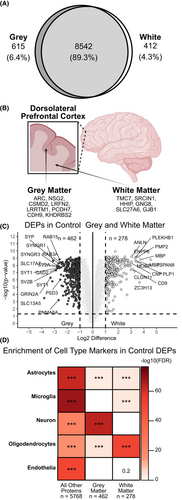
After removal of sample outliers and proteins with high missingness across samples, 122 samples (from 61 subjects) and 6728 unique protein isoforms were selected for downstream analysis. We used a paired differential expression analysis to compare GM and WM. Proteins with an FDR p-value <0.05 and an absolute log2 difference ≥1 were differentially expressed. In total, 462 proteins were upregulated in control GM while 278 were upregulated in control WM (Fig. 1C). Cell type analysis demonstrated enrichment of neuronal proteins in upregulated GM proteins and enrichment of oligodendrocyte proteins in upregulated WM proteins. Microglial proteins were enriched in upregulated WM proteins, but not upregulated GM proteins (Fig. 1D). This pattern of differential expression and cell type enrichment was similar for GM versus WM comparisons in all other disease groups (Figs. S2 and S3). Endothelial proteins were significantly enriched in WM FTD-tau samples but not other WM samples (Fig. S3A).
Given the enrichment of microglial proteins in WM, we compared our results with an existing transcriptome of human microglia derived from occipital cortex and corpus callosum from control and subjects with multiple sclerosis (MS).18 With a similar analysis,18 we restricted the comparison to proteins with an absolute mean difference greater than or equal to 2. Upregulated WM proteins across all GM versus WM comparisons in our dataset were enriched for upregulated WM-specific microglial markers identified in the comparison dataset18 (Fig. S3B). Cellular deconvolution analysis identified a higher proportion of microglia in WM than GM and endothelia in FTD-tau WM than all of other groups. The deconvolution results also aligned well with GM and WM differential expression and cell type analyses, further demonstrating the strength of this approach and dataset (Fig. S4).
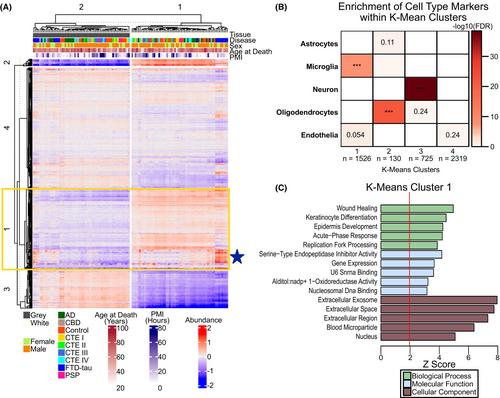
We then used k-means clustering analysis on the 122 samples, specifying the number of clusters, k, as 2, given our a priori knowledge that the samples were derived from either GM or WM. Reassuringly, the GM and WM samples formed two distinct clusters. Further hierarchical clustering of the samples within their respective k-means clusters showed that the FTD-tau samples were most similar to one another. We also used k-means clustering analysis (k = 4) on proteins with no missingness across all samples (n = 4700) (Fig. 2A). Cluster 1 (n = 1526 proteins) was significantly enriched with microglial proteins with a trending enrichment in endothelial proteins (Fig. 2B) whose top gene ontologies were associated with inflammation-associated terms such as Wound Healing and Acute-Phase Response (Fig. 2C). Notably, the FTD-tau samples had increased expression of Cluster 1 proteins, particularly in WM (Fig. 2A, blue star). Cluster 2 was enriched for oligodendroglial proteins while Cluster 3 was enriched for neuronal proteins (Fig. 2B). Top GO terms for Cluster 2 were associated with cytoskeleton and myelin while top GO terms for Clusters 3 and 4 were associated with mitochondria and translation, respectively (File S2). Differential expression, cell type and cellular deconvolution, and k-means analyses collectively demonstrated an enrichment of microglial proteins in WM and endothelial proteins in FTD-tau WM.
Consensus WGCNA reveals unique disease-associated endothelial and microglial protein changes in WM
WGCNA is an unsupervised systems biology approach to characterize proteomic changes based on protein expression profiles through pairwise correlations of proteins. Modules consist of proteins whose expression profiles are highly correlated and often biologically related in function. We previously applied WGCNA in a cohort of GM-matter biased samples and identified an enrichment of astrocytic proteins in FTD-tau and stage-specific molecular phenotypes in CTE.12 Given the notable difference in protein expression and cell type enrichment between the GM and WM tissues (Figs. 1 and 2), we treated the GM and WM samples as separate networks and used cWGCNA to identify consensus modules between the two networks. We identified 46 consensus modules across the GM and WM proteomes (Fig. 3A). Inter-module correlation was well preserved across both networks (Fig. 3B,C) with a mean preservation for each eigenprotein of 0.82 (Fig. 3D). M22, a heterogeneous module, was the most preserved while M11, a module of actin-related and tRNA aminoacylation proteins, was the least preserved (Fig. 3D).
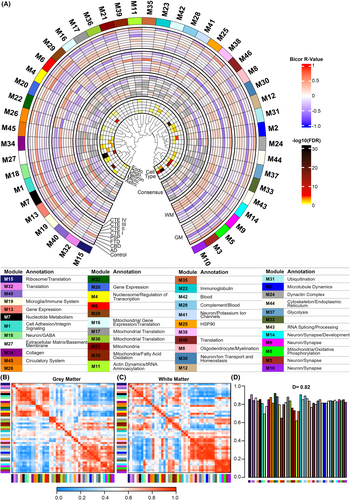
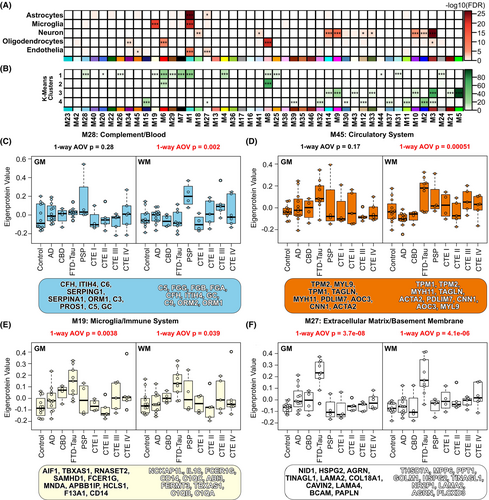
Enrichment of microglial proteins in WM and endothelial proteins in FTD-tau WM identified in our differential expression analyses drove us to examine consensus modules that may reflect these findings. After identifying consensus modules enriched for cell-type-specific proteins (Fig. 4A), cluster-specific proteins from our k-means analysis (Fig. 4B), and GO terms associated with microglial and endothelial processes (File S2), we identified four consensus modules of interest. Module 28 (M28) was enriched with Cluster 1 proteins as well as complement and blood-related proteins which are associated with microglial processes (Fig. 4C). M28 eigenprotein values demonstrated WM disease-associated changes (one-way ANOVA, p = 0.002). PSP (t-test, p = 0.00093) and CTE III (t-test, p = 0.021) M28 eigenprotein values were significantly higher than control. Module 45 (M45) was enriched with endothelial proteins associated with the circulatory system (Fig. 4D) and demonstrated WM disease-associated changes (one-way ANOVA, p = 0.00051). AD M45 eigenprotein values were significantly lower than control (t-test, p = 0.044) while FTD-tau M45 eigenprotein values were significantly higher (t-test, p = 0.0061). Module 19 (M19) was enriched with Cluster 1 and microglial proteins and demonstrated both GM (one-way ANOVA, p = 0.0038) and WM (one-way ANOVA, p = 0.039) matter disease-associated changes (Fig. 4E). GM CBD (t-test, p = 0.02) and FTD-tau (t-test, p = 0.00023) M19 eigenprotein values were higher than control, while only FTD-tau (t-test, p = 0.0015) M19 eigenprotein values were higher than control in WM. Finally, Module 27 (M27) was enriched with endothelial and astrocytic proteins and demonstrated disease-associated changes in both GM (one-way ANOVA, p = 3.7e−08) and WM (one-way ANOVA, p = 4.1e−06) matter (Fig. 4F). Specifically, AD (t-test, p = 0.021) and FTD-tau (t-test, p = 6.5e−07) M27 eigenprotein values were higher than control in GM, while CTE IV (t-test, p = 0.0085) and FTD-tau (t-test, p = 1.8e−05) M27 eigenprotein values were higher than control in WM. Enriched GO terms for M27 indicate that proteins in this module are involved in extracellular matrix and basement membrane processes. Collectively, these results demonstrate both unique and shared disease-associated microglial and endothelial protein changes across GM and WM.
WGCNA of WM:GM ratio reveals disease-associated alterations in mitochondrial proteins
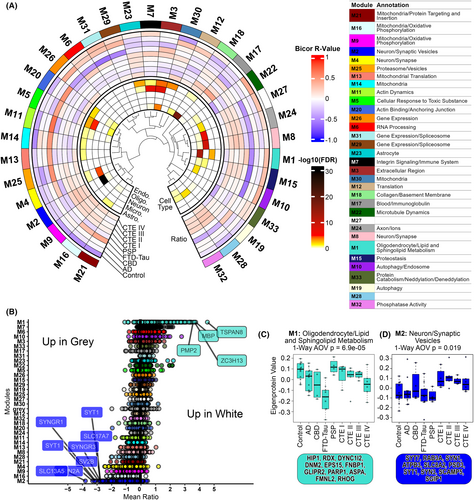
Recently, gray to white matter signal ratio was identified as a novel metric of neurodegeneration and was associated with tau deposition.33 To assess if the ratio of proteins across GM and WM was dysregulated in disease, we calculated a ratio by subtracting GM abundance from WM abundance. WGCNA of the resulting 6573 ratios revealed 33 modules (Fig. 5A). Module 1 (M1) proteins had the highest ratios, indicating higher expression in WM than GM (Fig. 5B,C). Top GO terms were associated with myelin sheath and sphingolipid metabolism (File S4). Module 2 (M2) proteins had the lowest ratios (Fig. 5B,C), indicating higher expression in GM than WM. Top GO terms were associated with synaptic vesicles. Thus, the modules with the most extreme ratios were associated with the primary cellular components of GM and WM. Furthermore, disease-associated changes in M1 eigenprotein values demonstrated a marked decrease of oligodendroglial proteins in AD (t-test, p = 0.046), CBD (t-test, p = 0.035), FTD-tau (t-test, p = 1.4e−05), and CTE IV (t-test, p = 0.017) relative to control (Fig. 5C).
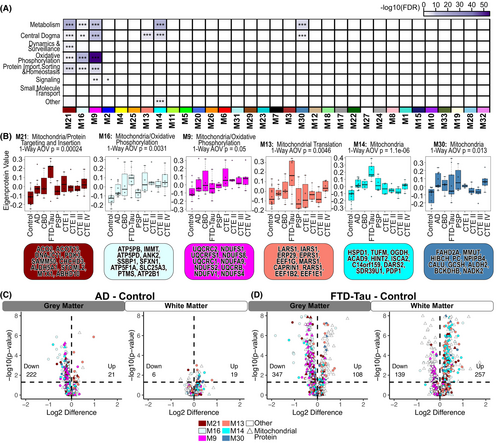
The ratio network approach revealed six mitochondria-associated modules which demonstrated elevated WM:GM ratios in one or more disease groups relative to control: modules (M) 21, 16, 9, 13, 14, and 30 (File S6). Most of these modules were comprised of proteins involved in multiple Mitocarta-defined17 mitochondrial pathways such as metabolism, central dogma, oxidative phosphorylation, and protein import, sorting and homeostasis. Notably, M13 was only enriched for mitochondrial central dogma proteins while M14 and M30 were enriched for mitochondrial metabolism and central dogma proteins (Fig. 6A,B). An elevated WM:GM ratio may be driven by both a decrease in protein expression in GM and/or an increase in WM. Thus, we examined differential expression patterns of all proteins in the six mitochondrial modules of interest and all mitochondrial proteins as defined in Mitocarta 3.0,17 comparing each disease group to control. Indeed, most of these proteins were downregulated in GM and upregulated in WM (Fig. 6C,D). FTD-tau samples demonstrated the most differentially expressed proteins, mitochondrial and otherwise (Figs. S5 and S6). Notably, this diverging pattern of mitochondrial expression in GM and WM in diseased tissues was not evident in the consensus network mitochondrial modules (File S5). The ratio network approach identified reciprocal proteomic changes across GM and WM that were not readily detectable through conventional WGCNA.
Discussion
Tauopathies and dementia are a global health concern, yet there is a paucity in research to define how tauopathy impacts WM. To better inform our understanding of disease, we used quantitative proteomics to identify and compare changes in GM and WM human tauopathy tissues. Initial comparison of GM and WM showed that most of the proteome is shared, though there are select proteins that are tissue specific. Comparison of GM and WM demonstrated enrichment of microglial proteins in WM, which was validated in an orthogonal dataset.18 K-means clustering analysis and cWGCNA of GM and WM networks demonstrated tissue-specific, disease-associated changes in microglial and endothelial proteins. Ratio WGCNA identified a nonspecific, disease-associated dysregulation of white:gray ratio in mitochondrial proteins. Together, our results highlight the value of examining both GM and WM to better understand disease-associated changes in tauopathy.
We identified eight (GM) and six (WM) proteins that were only detected in one tissue type. While this tissue specificity of a select few proteins may be tool or technique dependent, they may be useful as markers of GM or WM in tissue preparations. Comparison of GM and WM revealed an enrichment of microglial proteins in white matter, regardless of disease status, and an enrichment of endothelial proteins in FTD-tau WM. Enrichment of microglial proteins in WM may be driven by tissue-specific molecular profiles or tissue-specific differences in microglial density. Indeed, prior work has demonstrated higher density of microglia in WM regions compared to GM.34, 35 However, unique molecular signatures have also been attributed to microglia in WM in mice and humans in the contexts of aging36 and disease, including MS18 and AD.37 It is likely that both a difference in microglia cell count and molecular phenotype in WM drive our findings.
The results of our K-means clustering and cWGCNA analyses identified shared and unique disease-associated changes in microglial and endothelial pathways and processes, where FTD-tau samples were often the extreme. Prior work has also demonstrated increased astrocyte, microglia, and endothelial transcripts and proteins in FTD-tau relative to control and other tauopathies.12, 38-40 Proteins associated with microglia, innate immunity, the extracellular matrix, and the basement membrane were dysregulated in both GM and WM while proteins associated with complement, blood, and the circulatory system were dysregulated in WM. These WM-specific changes appear to be targeted to vasculature. WM vascularization is less dense than GM and vulnerable to chronic hypoperfusion.41 This difference in density could make the WM more vulnerable to disease-associated changes in vascular-associated proteins. Recent work demonstrated that capillaries in WM are wider than capillaries in GM, and this width increases in neurodegenerative disease,42 which may explain the unique WM increases in consensus modules M28 and M45.
Ratio WGCNA identified, in an unbiased manner, a dysregulation of mitochondrial proteins. Proteomic studies of predominantly GM samples previously demonstrated dysregulation (often a decrease) of mitochondrial proteins in neurodegenerative disease.4, 5, 43, 44 For this study, mitochondrial protein dysregulation was driven by disease-associated downregulation in GM and upregulation in WM. Interestingly, mitochondrial protein expression in multiple sclerosis GM and WM lesions also demonstrated an opposite or reciprocal pattern of expression.45 It was postulated that mitochondrial proteins were decreased in GM lesions and increased in WM due to both neuronal loss and defective retrograde transport of damaged mitochondria back to the cell body.45 However, the increase in mitochondrial proteins in WM could also be explained by altered mitochondrial dynamics in glial cells, which comprise a larger proportion of the cells in WM than GM.46
There are important limitations of this study to consider. Primarily, the sample size is low. The FTD-tau group predominantly consisted of samples from subjects with MAPT mutations which could lead to higher in-group homogeneity compared to other disease groups, driving significant findings. The dissection of GM and WM from each sample was performed by hand, which is less precise than other techniques such as laser-capture microdissection.47 Future studies may benefit from spatial biology as a more precise method of defining tissue/region-specific molecular changes.36 Finally, there is potential for bias in selecting which findings to highlight from the many WGCNA modules that demonstrate tissue-specific and/or disease-specific changes. Our system-based approach also yielded several prospective avenues of research outside the scope of the present manuscript including WM-specific, disease-associated changes in collagen and extracellular matrix proteins (Files S3 and S5) and disease-associated WM:GM ratio changes in cytoskeletal proteins (Files S4 and S6).
This work provides improved understanding of GM and WM proteomic changes in tauopathy, both shared and distinct. This dataset is a resource for investigators to explore novel insights on GM and WM proteomic differences in control and tauopathy conditions. Studies that measure or modify WM microglia, endothelia, or mitochondria in neurodegenerative disease models may also reveal new biomarker and therapeutic opportunities, although it is unclear if these changes are markers of disease or directly impacting pathophysiology of tauopathy. Future human brain proteomic studies will benefit from separating GM and WM to uncover unique and reciprocal disease-associated changes.
Author Contributions
A.G.J. analyzed data and drafted the manuscript. E.B.D. supervised and guided data analysis. J.A.W. and D.D. performed proteomic experiments. N.T.S. supervised proteomic experiments and provided feedback on final manuscript. C.M.H. planned the experiments, performed dissections, edited the final manuscript, and supervised the work.
Acknowledgements
We acknowledge the Goizueta Alzheimer's Disease Research Center (P30AG066511) and the Boston CTE Center and Boston ADRC (P30AG072978) for their neuropathological services and sample repository. We are grateful for the individuals and families whose specimen donations supported this work. This study was supported in part by the Emory Integrated Proteomics Core (EIPC), which is subsidized by the Emory University School of Medicine and is one of the Emory Integrated Core Facilities. Additional support was provided by the Georgia Clinical & Translational Science Alliance of the National Institutes of Health under Award Number UL1TR002378. This work was also supported by the Department of Defense (DoD-PRARP AZ150143). The content is solely the responsibility of the authors and does not necessarily reflect the official views of the National Institutes of Health. We thank Dr. Cheyenne Hurst for providing sample R scripts.
Conflicts of Interest
CMH is PI or Sub-I on several industry sponsored grants where funding is awarded to his institution for executing study sites. CMH is also chair of the American Academy of Neurology Research Program Subcommittee for which he receives support for travel to the meeting. NTS and DMD are co-founders and Chief Scientific Officer (NTS) and Chief Operations Officer (DMD) of Emtherapro, Inc., for which they receive consulting fees and royalties are awarded to their institution.
Open Research
Data Availability Statement
The shiny R package was used to create an interactive app for exploration of this dataset. The app can be accessed at https://telomere.biochem.emory.edu/greywhite/. Scripts used for data analysis can be found at https://github.com/ashlyngjohnson/grey_white_tauopathy. Raw data files are stored on Synapse (syn27144976) and can be accessed at https://www.synapse.org/#!Synapse:syn27144976.


