Non-neurological factors associated with serum neurofilament levels in the United States population
Abstract
Objective
To model interdependencies of serum neurofilament light chain (sNfL), a clinically useful biomarker of axonal injury in neurological diseases, with demographic, anthropometric, physiological, and disease biomarkers in the United States population.
Methods
sNfL and 80 biomarkers were obtained from the National Health and Nutrition Examination Survey (n = 2071, age: 20–75 years). Body habitus and composition, electrolytes, blood cell, metabolic, liver, and kidney function biomarkers, and common diseases were assessed with weighted regression adjusted for age, sex, and race/ethnicity. Salient biomarkers were modeled with ensemble learning; a Bayesian network structure was obtained for interdependencies.
Results
Age was strongly associated with sNfL. sNfL levels were 13% higher in men versus women. Mexican Americans had 18.5% lower sNfL versus Non-Hispanic Whites. sNfL was similar in pregnant versus nonpregnant women. Lymphocyte, and neutrophil numbers, and phosphorus, and chloride levels were associated with sNfL. Multiple liver function (e.g., albumin and gamma-glutamyltransferase), renal function (e.g., creatinine and urea), and carbohydrate/lipid metabolism markers (e.g., glucose and triglycerides) were associated with sNfL. A 50% greater creatinine was associated with 26.8% greater sNfL. Diabetes, kidney disease, congestive heart failure, and stroke were associated with sNfL. The ensemble learning algorithm predicted high sNfL outliers with 5.06%–9.16% test error. Bayesian network modeling indicated sNfL had neighbor dependencies with age, creatinine, albumin, and chloride.
Interpretation
sNfL is associated with age, kidney and liver function, diabetes, blood cell subsets, and electrolytes. sNfL may be a useful biomarker for biological age of the whole body and major organ systems including the brain.
Introduction
Serum neurofilament light chain (sNfL) levels are a novel state-of-the-art biomarker for neurodegeneration.1 Neurofilaments are cytoskeletal proteins present in neurons that are released when neuronal cell damage occurs and diffuse into blood. sNfL can be measured in plasma and serum samples using single molecule array immunoassay (SIMOA), which is 100-fold more sensitive than ELISA.1
The extensive body of clinical research studies on sNfL in multiple sclerosis (MS) has established that sNfL is a specific biomarker for neuronal cell damage. sNfL levels can distinguish MS patients from healthy controls, and MS patients with contrast-enhancing lesions from those without contrast-enhancing lesions.2 sNfL levels are greater in clinically isolated syndrome patients who are fast converters to clinically definite MS versus non-converters.3 sNfL is a predictor of brain atrophy and disability worsening.4 In 2022, sNfL assays were approved by the Food and Drug Administration for identifying relapsing MS patients at high risk for disease activity.5
Concomitantly, changes in sNfL have been shown to correlate with disease progression in several other neurological diseases including Parkinson's disease, Alzheimer's disease, Huntington's disease, and traumatic brain injury.6, 7 There is also a growing body of studies of sNfL in non-neurological settings. sNfL was increased in COVID-19 patients on mechanical ventilation, and associated with unfavorable outcomes.8 Increased sNfL has recently been linked to environmental exposures to the herbicide glyphosate and to phthalates, which are additives in plastics.9, 10
There has been ongoing interest in utilizing sNfL in geriatrics given the risk of cognitive decline during aging in the presence of comorbidities.11-14 sNfL levels correlated with brain changes in normal aging in a cohort of 335 subjects (mean age: 64.9 years)15 without overt neurological disease. sNfL is also associated with all-cause mortality.16, 17
However, given the emergent research showing that aging, pathological and toxicological exposures, and individual-specific factors can contribute to sNfL levels, a broader examination of sNfL could be clinically useful for guiding decision-making. The goal of this research is to systematically model sNfL associations with physiological biomarkers of major organ system functions and disease states in a racially diverse and representative United States population.
Methods
Study design
Datasets
Data were obtained from the 2013 to 2014 cycle of the National Health and Nutrition Examination Survey (NHANES).
NHANES is conducted by the National Center for Health Statistics (NCHS) and contains data from laboratory measurements, physical screening, and survey questionnaires from a representative sample of the United States population.18
sNfL was reported in a half-sample of subjects aged 20–75 years who had consented to future use of their samples.
The nhanesA data retrieval R package was used for downloading NHANES data files.
NHANES sNfL assay methodology
The sNfL assay was an immunoassay from Siemens Healthineers (Erlangen, Germany) on the Attelica high-throughput, automated platform (Siemens Healthineers, Erlangen, Germany). The methodology uses acridinium ester labeled anti-NfL antibodies, paramagnetic particles capture, and chemiluminescent detection. See https://wwwn.cdc.gov/Nchs/Nhanes/2013-2014/SSSNFL_H.htm for details.
Quality control samples with low, medium, and high sNfL concentration were included in the assay procedures. The lower () and upper limits () of quantitation were 3.9 and 500 pg/mL.
Data preprocessing
Subjects without sNfL levels were excluded. sNfL levels < were set to a value of or 2.8 pg/mL.
NHANES biomarkers
Eighty predictors (Table S1) were assessed in statistical and machine learning analysis.
Computed biomarkers
Twenty-seven biomarkers were derived from other biomarkers using equations19 provided in the Supplementary File.
The computed biomarkers included: body mass index (), normalized waist circumference (), plasma volume (), estimated glomerular filtration rate (), homeostatic model assessment-insulin resistance (HOMA-IR) and HOMA-beta cell, (a measure of liver function), fatty liver index (), hepatic steatosis index (HSI), urine flow rate (), average systolic (SBP), and diastolic blood pressure (DBP).
Renal disease was assessed with kidney disease and dialysis binary status variables. Hepatic diseases were assessed with current liver disease, past liver disease, active hepatitis B, and active hepatitis C status variables. Diabetes was assessed with diabetes, diabetes or prediabetes, and insulin use status variables. Cardiac diseases were assessed with heart attack, congestive heart failure, coronary artery disease, and angina pectoris status variables.
Data analysis
The R statistical program was used for all statistical analyses and machine learning modeling. Results were visualized using the ggplot2 R package.
The age decades variable was defined by age cut points of [0, 10), [10, 20), [20, 30), [30, 40), [40, 50), [50, 60), [60, 70), [70, 80), and [80, Inf) years. The age groups variable was defined by age cut points [0, 20), [20, 40), [40, 60), [60, 80), and [80, Inf) years. Tertiles of biomarkers were computed for graphing.
All continuous biomarkers and sNfL levels were logarithm (base 10) transformed for regression analysis. The regression analysis assessed logarithm-transformed sNfL levels with age, sex, race, and the individual biomarkers as predictors. The regression analysis base model assessed logarithm-transformed sNfL levels with age, sex, and race as predictors. The regression analysis of logarithm-transformed sNfL levels with the pregnancy status variable had age and race as predictors.
The Benjamini–Hochberg method was used to obtain adjusted regression p-values () to keep false discovery rates from multiple testing to ≤0.05.
Generalized eta-squared () effect size values were computed with the rstatix package; ≥ 0.01, 0.06, and 0.14 are considered small, medium, and large effects, respectively. Associations with ≤ 0.05 and values < 0.01 were labeled weak associations.
Machine learning modeling
Decision tree-based models were built with the XGBoost ensemble learning algorithm20 implemented in the xgboost R package.
All continuous variables (e.g., log-transformed values of age and continuous biomarkers) were scaled using ordered quantile technique in the bestNormalize R package.21 Ordered quantile scaling produces normally distributed variables with zero mean and unit standard deviation.
Based on the estimated mean and standard deviation, outliers had sNfL > 35.2 pg/mL.
The height variable was excluded since height does not vary in adults, and the LDL-C variable was excluded because total cholesterol and apolipoprotein B, the signature lipoprotein of LDL particles, were not associated.
The data were 80:20 split into training and test sets. The XGBoost hyperparameter values were obtained from a grid search with fivefold cross validation (maximum depth , number of trees , learning rate parameter eta , subsample , colsample_bytree minimum split loss parameter gamma = 0, minimum child weight = 1, maximum delta step = 0).
The optimal values of maximum depth = 3, eta = 1, subsample = 0.75, colsample_bytree = 0.9, and number of trees of 20 were identified from the grid search based on Cohen's kappa.
Shapely additive explanation values (SHAP) were used to assess the contribution pattern for each predictor. The test error was evaluated on 10 independent training-test data splits.
The ordered quantile normalized values of sNfL and the top 20 features from XGBoost based on variable importance values were selected as the input for Bayesian network (BN) modeling. Inward arcs to the age variable were blacklisted. The hill-climbing (HC) algorithm was used for BN structural learning and parameter learning was done with maximum likelihood estimation.22 The bnlearn R package was used for BN modeling.23
Results
Demographic characteristics
Demographic characteristics are summarized in Table 1. The unfiltered NHANES dataset contained 10175 participants with 5262 participants in the 20–75 years age range.
| n (%) | |
|---|---|
| Sample size n | 2071 |
| Gender | |
| Male (%) | 990 (47.8) |
| Female (%) | 1081 (52.2%) |
| Age, yearsa | 46.9 ± 15.4 (20–75) |
| Age groups | |
| 20 years ≤ age < 40 years | 716 (34.6%) |
| 40 years ≤ age < 60 years | 813 (39.3%) |
| 60 years ≤ age < 80 years | 542 (26.2%) |
| Missing | 0 |
| Race | |
| Mexican American | 292 (14.1%) |
| Other Hispanic | 196 (9.46%) |
| Non-Hispanic White | 910 (43.9%) |
| Non-Hispanic Black | 373 (18.0%) |
| Non-Hispanic Asian | 247 (11.9%) |
| Other race (including multiracial) | 53 (2.56%) |
| Missing | 0 |
| Education level | |
| Less than 9th grade | 155 (7.48%) |
| 9–11th gradeb | 296 (14.3%) |
| High school graduate or GED | 431 (20.8%) |
| Some college or AA degree | 652 (31.5%) |
| College graduate or above | 534 (25.8%) |
| Refused | 1 |
| Missing | 2 |
| Ratio of family income to poverty | |
| Low: ratio ≤ 1 | 470 (24.4%) |
| Intermediate: 1 < ratio < 5 | 1097 (57.0%) |
| High: ratio ≥ 5 | 358 (18.6%) |
| Missing | 146 |
- a Age, year is expressed as mean ± standard deviation (minimum–maximum).
- b Education group 9–11th grade includes 12th grade with no diploma.
Serum neurofilament levels were available in 2071 participants (age range: 20–75 years). None of the sNfL measurements were ; 36 subjects (1.74%) had levels . The frequency of high sNfL outliers (sNfL > 35.2 pg/mL) was 148 of 2071 (7.15%) subjects.
Table S1 summarizes the characteristics of the biomarkers in the study sample.
sNfL levels are associated with age, sex, and race
The [20, 40) year Age Group had 716 (34.6%) subjects, the [40, 60) year Age Group had 813 (39.3%) subjects, and the [60, 80) year age group had 542 (26.2%) subjects.
The base regression model assessed log-transformed sNfL levels as the dependent variable with age, sex, and race as predictors. Age had the strongest associations with sNfL ( = 0.24, p < 0.001). Race ( = 0.012, p < 0.001) and sex ( = 0.012, p < 0.001) were also associated.
From the regression coefficients, the increase in sNfL per year of age in the study sample, which was comprised of 20-75-year-olds, was 2.19%. The sNfL increase was 1.85% per year in the [20, 40) year age group, 2.73% in the [40–60) year age group, and 2.02% in the [60–80) year age group. The results for age, sex, and race are summarized in Fig. 1A–C.
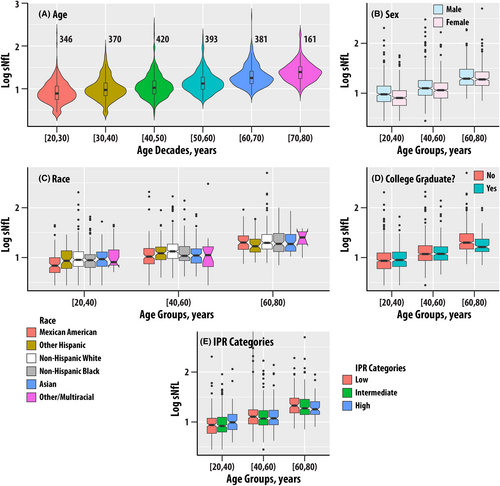
The estimated marginal mean sNfL levels were 13% higher in men compared to women (BH adjusted p < 0.001). The sNfL levels differed in the [20–40) and [40–60) years age groups but were similar for the [60–80) years age group. The pairwise estimated marginal mean for the Mexican American group was 18.5% lower compared to the non-Hispanic White group ( < 0.001). The remaining pairwise comparisons were not significant.
The education variable (DMDEDUC2) was not associated with sNfL (Table S2, Fig. 1D). However, the group that did not graduate college had 6.8% higher sNfL than the college graduate or higher group; the effect sizes were small ( = 0.003, p = 0.02, = 0.046) as the differences emerged in the [60–80) years age group.
The ratio of family income to poverty (IPR, = 0.002, p = 0.043, = 0.09) and IPR Categories ( = 0.14) were not associated with sNfL (Table S2, Fig. 1E).
sNfL associations with body habitus, pregnancy, and body composition measures
Body weight, BMI, BMI categories, and normalized waist circumference were not associated with sNfL (Table S2). Height was weakly associated with sNfL ( = 0.003, p = 0.014, = 0.035).
Eighteen women had a positive lab pregnancy test or self-reported pregnant status, 468 were not pregnant, and 11 were categorized as “Cannot ascertain if the participant is pregnant.” Pregnancy status was not associated with sNfL.
A subset of NHANES 2013–2014 participants also had body composition and bone mineral density (BMD) measures from dual X-ray absorptiometry (DEXA) imaging. Total body fat, total lean body mass, total bone mineral content, and percent body fat were not associated with sNfL (Table S2). Femoral neck BMD ( = 0.007, p = 0.004, = 0.012) and pelvis BMD ( = 0.004, p = 0.019, = 0.045) were weakly associated with sNfL; sNfL was not associated with lumbar spine or Ward's triangle BMD. Figure S1 summarizes the dependence of sNfL on the tertiles of femoral neck and pelvis BMD by age groups in males and females. The median values of sNfL were higher in the lowest BMD tertiles.
sNfL associations with blood cell subsets
The associations of sNfL with blood cell subsets from the complete blood count with five-part differential test (Table S2) were assessed.
Red cell count, hematocrit, hemoglobin, plasma volume, and platelet count were not associated with sNfL. White blood cell, lymphocyte, monocyte, and segmented neutrophil number were associated with sNfL. The values ranged from 0.014 to 0.021 (All p < 0.001, All < 0.001). The box plots in Fig. S2A–D summarize the dependence of sNfL on tertiles of white blood cell, lymphocyte, monocyte, and segmented neutrophil number for the three age groups.
sNfL associations with electrolytes
The associations of sNfL with blood electrolytes levels from the comprehensive metabolic panel were assessed (Table S2).
Blood sodium ion levels ( = 0.013, p < 0.001, < 0.001) were associated with sNfL; potassium, calcium and iron ion levels were not associated (Table S2). Blood phosphate ( = 0.011, p < 0.001, < 0.001) and chloride ( = 0.029, p < 0.001, < 0.001) ion levels were associated with sNfL; bicarbonate ion levels were not associated. Blood osmolality was not associated with sNfL. Figure S2E–G summarize the dependence of sNfL on tertiles of sodium, chloride, and phosphate ion levels for the three age groups.
sNfL associations with liver function markers and liver disease
The associations of sNfL with liver function markers and enzymes from the comprehensive metabolite panel were assessed (Table S2). Albumin levels, alanine aminotransferase, aspartyl aminotransferase, alkaline phosphatase, and gamma glutamyltransferase activities were associated with sNfL; the values ranged from 0.003 for alanine aminotransferase to 0.030 for albumin (All p < 0.001, All < 0.001, See Fig. S3A–E). Bilirubin was not associated with sNfL.
The R-value, which is used to distinguish cholestatic from hepatocellular liver injury, FLI, and HSI were not associated with sNfL.
Active hepatitis C was weakly associated with sNfL ( = 0.004, p = 0.002, = 0.006, Fig. S3F). However, current liver disease and active hepatitis B were not associated.
sNfL associations with energy metabolism markers, diabetes, cardiovascular diseases, and stroke
The associations of sNfL with markers of carbohydrate, lipid, and cholesterol metabolism from the standard biochemistry profile were assessed (Table S2).
Carbohydrate metabolism and diabetes
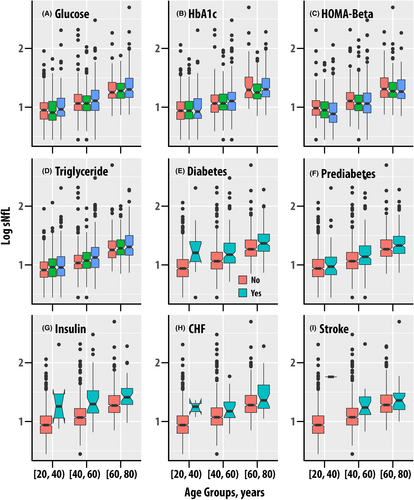
Fasting glucose ( = 0.020, p < 0.001, < 0.001, Fig. 2A), glycohemoglobin ( = 0.018, p < 0.001, < 0.001, Fig. 2B), and HOMA-Beta ( = 0.003, p = 0.012, = 0.031, Fig. 2C) were associated with sNfL; fasting insulin and HOMA-IR were not associated with sNfL. Diabetes ( = 0.024, Fig. 2E), prediabetes or diabetes ( = 0.008, Fig. 2F), and insulin use ( = 0.028, Fig. 2G) were also associated with sNfL (p < 0.001, < 0.001 for all).
Triglycerides and cholesterol metabolism
Triglyceride levels were associated with sNfL ( = 0.007, p < 0.001, < 0.001). LDL cholesterol was associated with sNfL but apolipoprotein B (ApoB), which is present on LDL particles was not associated. Total cholesterol and HDL cholesterol were also not associated with sNfL.
Cardiovascular disease and stroke
Systolic and diastolic blood pressure were not associated with sNfL. Congestive heart failure was weakly associated ( = 0.004, p = 0.003, = 0.009, Fig. 2H), coronary heart disease exhibited a weak borderline association ( = 0.003, p = 0.023, = 0.050), and heart attack was not associated with sNfL. Stroke was associated with increased sNfL ( = 0.003, p = 0.009, = 0.024, Fig. 4I).
sNfL associations with blood and urinary renal function markers and kidney disease
The associations of sNfL with serum and urine creatinine, EGFR, blood urea nitrogen, urine flow, urine albumin, and urine albumin to creatinine ratio were assessed (Table S2). Serum creatinine ( = 0.047, p < 0.001, < 0.001, Fig. 3A) and the derived EGFR ( = 0.055, p < 0.001, < 0.001, Fig. 3B) exhibited the strongest associations with sNfL behind age. A 50% increase in serum creatinine, which is considered clinically meaningful in acute kidney injury,24 corresponds to a 26.8% increase in sNfL. Blood urea nitrogen ( = 0.011, p < 0.001, < 0.001, Fig. 3C) and uric acid ( = 0.005, p < 0.001, = 0.003, Fig. 3D) were also associated with sNfL.
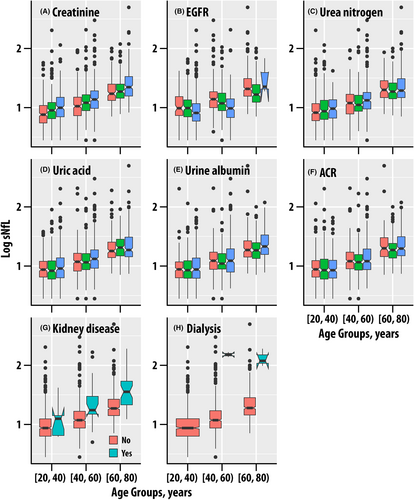
While sNfL was not associated with urine creatinine, it was associated with urine albumin ( = 0.025, p < 0.001, < 0.001, Fig. 3E) and urine albumin-to-creatinine ratio ( = 0.031, p < 0.001, < 0.001, Fig. 3F) were associated; urine flow rate exhibited a weak borderline association ( = 0.003, p = 0.023, = 0.050).
These results confirm the previously reported associations of sNfL with renal function in older adults.12
Serum Klotho levels, which have been linked to both aging and kidney failure,25 were not associated with sNfL.
Kidney disease
Participants with kidney disease ( = 0.020, Fig. 3H) and those on dialysis ( = 0.025) had higher sNfL (p < 0.001, < 0.001 for both). We note that the number of dialysis subjects was small (n = 5, Table S2) but had elevated sNfL (Fig. 3I).
Machine learning modeling with ensemble learning and Bayesian networks
The XGBoost ensemble learning algorithm was used to build a joint model of all the biomarkers identified as significant by false discovery rate criterion ( ≤ 0.05) with occurrence of sNfL outliers.
The prediction test error of the final XGBoost ensemble model with maximum depth of 3 and 200 iterations for the test independent training-test data splits ranged from 5.06% to 9.16%.
The top 20 variables with the highest variable importance values (Fig. 4A) were: age (RIDAGEYR), urine albumin-to-creatinine ratio (URDACT), urine albumin (URXUMA), estimated glomerular filtration rate (EGFR), HOMA-BETA, alkaline phosphatase (LBXSAPSI), fasting glucose (LBXGLU), neutrophil count (LBDNENO), triglycerides (LBXTR), uric acid (LBXSUA), serum albumin (LBXSAL), gamma glutamyl transferase (LBXSGTSI), blood urea nitrogen (LBXSBU), serum creatinine (LBXSCR), white blood cell count (LBXWBCSI), lymphocyte count (LBDLYMNO), phosphorus (LBXSPH), aspartyl aminotransferase (LBXSASSI), alanine aminotransferase LBXSATSI, and chloride (LBXSCLSI).
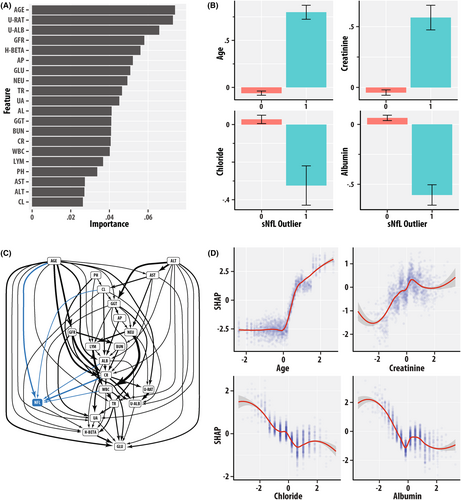
The bar graphs in Fig. 4B show the values of the ordered quantile normalized values of age (RIDAGEYR), serum creatinine (LBXSCR), serum albumin (LBXSAL), and serum chloride (LBXCLSI) as a function of the sNfL outlier binary status variable. The group with sNfL outlier positive status had greater mean age and lower chloride and serum albumin. Figure S4 is a panel of bar graphs for the ordered quantile normalized 20 variables with the highest values of variable importance.
Figure 4C is a directed acyclic graph (DAG) of the BN model, which distills the inter-dependence patterns among variables from their correlations. The DAG is a succinct topologically ordered representation of variables as nodes and inter-dependencies as edges. Variables with higher topological order can be considered to precede lower order variables in the implied causative chain. The states of parent nodes can be viewed as potentially “causative” of the states of the child nodes. Figure 4C highlights the importance of age given its numerous parent inter-dependencies with biomarker variables of renal, hepatic, blood cell, electrolyte, and energy homeostasis. sNfL had child arc dependencies with the ordered quantile normalized values of age (RIDAGEYR, AGE), serum creatinine (LBXSCR, CR), albumin (LBXSAL, ALB), and chloride (LBXCLSI, CL), and had a parent arc dependency to HOMA-BETA (H-BETA). The presence of child arcs to sNfL indicates that age, renal and hepatic function, and electrolyte biomarkers jointly influence sNfL levels.
The SHAP values “dose–response” curves in Fig. 4D summarize the sensitivity of sNfL outlier predictions to the ordered quantile normalized values of age (RIDAGEYR), serum creatinine (LBXSCR), serum albumin (LBXSAL), and chloride (LBXCLSI). SHAP values are higher at greater age and creatinine but are lower at greater chloride and albumin values.
Discussion
The research investigated the associations of sNfL with a diverse group of biomarkers that are routinely obtained in clinical settings. In addition to the expected changes with age, sNfL levels were found to be associated with sex, race/ethnicity, white blood cell subsets, certain electrolytes, liver, and kidney function biomarkers. Ensemble learning with XGBoost was used to identify salient features associated with sNfL, and Bayesian network modeling was used to develop a structural model for the interdependencies.
The strength of using NHANES data over clinical samples is that it is a nationally representative sample. However, it should be noted that the NHANES 2013–2014 design included an oversampling of Asians, and that NHANES is limited to the civilian population; it does not include military personnel, institutionalized subjects in prisons, drug rehabilitation, and psychiatric facilities. NHANES also does not have a longitudinal time course for individual subjects, which would be useful for demonstrating pathways of causation.26 The BN model that we developed did not account for time to obtain insights into the interdependencies between variables.
Another limitation is that while the NHANES study enrolled children, the eligible subset with sNfL measurements consisted of 20- to 75-year-olds. Geis et al. found that sNfL increased 3.2% in children between 0 and12 years and 2.7% from 13 to 18 years. In this research, sNfL increases of 1.85%, 2.73%, and 2.02% per year were found in the [20, 40), [40, 60), and [60, 80) year age groups, respectively. Khalil et al. found annual increases of 0.9% in the 40–50 year, 2.7% in the 50–60 year, and 4.2%–4.3% in the >60 years age groups.15 These deviations may be due to methodology differences: Khalil et al. used spline interpolation on sNfL versus age whereas this research used linear regression on logarithm-transformed sNfL versus age to obtain rates within each age group stratum.
From the regression analyses adjusted for age, race/ethnicity, and sex, a 50% increase in serum creatinine was associated with a 26.8% increase in sNfL. The findings with renal disease are now supported by findings from several groups. Akamine et al. reported associations of sNfL in a study of 45 controls and 188 diabetes mellitus patients ≥60 years of age.12 Tang et al. investigated adjusting for renal function in the context of sNfL measurements in older adults in the Alzheimer's Disease Neuroimaging Initiative.13 Renal function was also reported to be associated with sNfL in a Swiss study of atrial fibrillation (mean age 73.3 years).11 In COVID-19 patients on mechanical ventilation, sNfL was associated with unfavorable outcomes and also with serum creatinine.8 Our work has systematically extended the sNfL associations to a broader range of blood and urinary renal function markers and a more diverse and representative United States population. We were also able to assess Klotho, a proposed aging biomarker candidate that has also been linked to kidney failure.25 Klotho was found to be associated with age (data not shown) but was not associated with sNfL in the regression analyses.
Ensemble learning can identify the nonlinear trends and interactions between multiple variables and outcome without a pre-specified model. Ensemble learning was integrated with BN27 to identify structural models to help identify candidate molecular mechanisms mediating the sNfL levels. This hybrid approach has been previously shown to be effective for modeling the dynamics and orchestration of metabolic biomarkers during aging.26 The BN DAG contains information that complements the variable importance plots from ensemble learning. For example, urine albumin-creatinine ratio (URDACT, U-RAT), urine albumin (URXUMA, U-ALB), and HOMA-BETA were highly ranked by the ensemble learning algorithm but did not have a direct edge with sNfL in the BN DAG. This is possibly because the BN considered the contribution of other mediator variables, for example, age, creatinine, EGFR, and albumin, which occurred higher in the topological ordering. While a DAG provides a useful framework for delineating causality, the DAG structure is not unique because other DAGs from the set of equivalence class of representations can also model the joint distribution of the variables.
The premise that sNfL may be a promising candidate for assessing the biological age of whole and major organ systems including the brain is supported by several lines of evidence in this research considered together with other recent findings. First, sNfL has been linked to all-cause mortality by two studies, which reported a 2.45-fold greater hazard ratio of death per unit of natural logarithm of sNfL within a median follow-up of 73 months.16, 17 sNfL has been linked to cognitive decline, which is also a hallmark of aging, in a subset of NHANES participants 40–65 years old.17 Frailty is another hallmark of advanced age. sNfL was associated with frailty and pre-frailty on Fried's criteria28 at baseline in the Multidomain Alzheimer Preventive Trial (n = 507, mean age 76.7); however, it did not predict incident frailty at 60-month follow-up. sNfL was associated with sarcopenia and muscle strength in adults of 65–92 years old.14 Although we were not able to assess frailty, the associations of sNfL with femoral neck BMD and the lack of associations with lean body mass may warrant follow-up and possibly age-stratified analyses in a larger sample.
The results indicate that utilization of sNfL in neurology decision-making may require consideration of physiological factors and non-neurological comorbidities. While sNfL has emerged as valuable biomarker for axonal injury in neurological diseases, it is also a promising approach for assessing biological age of the whole body and major organ systems including the brain.
Acknowledgments
This is unfunded research. Funding for the Ramanathan laboratory from MS190096 from Department of Defense Congressionally Directed Medical Research Programs, USAMRDC, Multiple Sclerosis Research Program is gratefully acknowledged. The funder had no role in the design of the study or the data analysis.
Funding Information
This is unfunded research.
Author Contributions
Conception and design of the study, data analysis, and manuscript preparation: Murali Ramanathan.
Conflict of Interest Statement
Dr. Murali Ramanathan has received research funding from the National Multiple Sclerosis Society, Department of Defense, and National Institute of Neurological Diseases and Stroke. He receives royalty from a self-published textbook.
Open Research
Data Availability Statement
The data underlying this research are publicly available from NHANES.


