The central pattern of weakness of ALS: Morphological correlates in whole-body muscle MRI
Abstract
Objective
Monosynaptically cortically innervated α-motoneurons are early and strongly involved in amyotrophic lateral sclerosis (ALS). Consequently, the muscles that receive the strongest direct corticomotoneuronal input are the clinically most affected. To objectify this concept in vivo through morphological image correlates, whole-body magnetic resonance imaging (MRI) with muscle signal analysis was performed in patients with ALS compared to healthy controls.
Methods
Modified Dixon-based whole-body MRI was acquired in patients with ALS (n = 33) and matched healthy controls (n = 30). Manual labeling of limb muscle MRI was performed, and a specific subset of nine muscles, selected as pairs of muscle groups with different corticomotoneuronal input, was analyzed per subject based on their volume, fat fraction, and functional remaining muscle area (fRMA).
Results
Statistical analysis of 978 muscles in total revealed significantly decreased volumes, decreased fRMA, and increased fat fraction in the muscles of patients with ALS compared to controls. The clinical degree of pareses of directly innervated muscles was significantly worse than that of less directly innervated muscles in each comparison. The muscles receiving stronger direct corticomotoneuronal input showed more pronounced morphological involvement compared to those with less monosynaptic corticomotoneuronal input (fRMA, significant in three pairwise comparisons).
Interpretation
In conclusion, whole-body MRI-based muscle analysis provided additional evidence for a characteristic pattern of pareses in ALS. This technical approach (parameterization and quantification of muscle alterations from MRI) to patients with ALS could pave the way for the future establishment of a diagnostic algorithm of muscle MRI for ALS and may serve as a biomarker.
Introduction
In sporadic amyotrophic lateral sclerosis (ALS), corticofugal tracts appear to be affected in a stereotypical pattern and, notably, involve targets receiving monosynaptic projections from the cortex, suggesting that these direct connections may preferentially propagate the disease process.1 This is particularly true for bulbar and spinal α-motoneurons, the excitation of which is directly influenced by descending corticospinal and corticobulbar projections.2 Clinically, this pattern of pathology in sporadic ALS implies that muscle groups supplied by α-motoneurons with strong corticomotoneuronal connections should be more prone to early involvement by the ALS disease process than muscle groups whose α-motoneurons receive less direct corticofugal connections.3-5 Clinically, the majority of motor deficits following damage to the central motor pathways like in ALS occur in the extremities. These deficits display characteristic patterns of pareses with weakness of the thumb abductors, the hand extensors, the elbow flexors (biceps) and, in the lower limbs, the knee flexors and plantar extensors. Indeed, the muscle groups that receive marked direct cortical input were found to be clinically more affected compared to muscle groups with indirect innervation, in particular, the comparison of plantar flexors versus extensors and elbow extensors (triceps muscles) versus thumb abductors demonstrated pronounced differences in the degrees of strength.3 Because the pattern of paresis is consistent with the knowledge on the human physiology of the corticospinal tract6, the propagation pattern3 appears to be congruent with the hypothesis of monosynaptic transmission of phosphorylated 43 kDa TAR DNA-binding protein (pTDP-43) in ALS.1, 7
The value of muscle magnetic resonance imaging (MRI) in the diagnostic procedures of myopathies has been extensively explored,8-10 and T1-weighted muscle MRI has already been applied to distinguish ALS/MND patients from controls.11, 12 To establish a technical imaging marker for the “corticospinal” clinical paresis pattern and to objectify differences between muscle groups in vivo, whole-body MRI with Dixon technique was performed with consecutive analysis of the musculature in patients with ALS compared to healthy controls. The analyses were intended to provide insight into the pattern of muscle affection and its association with the underlying central nervous system pathophysiology of ALS, as well as to contribute to the development of muscle MR imaging as a biomarker of ALS.
Material and Methods
Subject characteristics
A total of 33 patients with possible, probable or definitive ALS according to the revised version of the El Escorial World Federation of Neurology criteria13 were recruited at the Department of Neurology, University of Ulm, Germany. Clinical features including age, sex, and site of onset together with scores of the revised ALS functional rating scale (ALS-FRS-R)14 and progression rate are summarized in Table 1. All patients had a negative family history for motor neuron diseases. All patients had been screened for ALS-associated gene mutations, and none of the patients had been found to have an ALS-associated gene mutation. The MRI data were compared with 30 age-matched controls. Gross pathology could be excluded by clinicoradiological reading of the MRI. All subjects provided written informed consent. The study was approved by the Ethics Committee of the University of Ulm, Germany (reference number #11/21).
| ALS | Controls | p-values (t-test) | |
|---|---|---|---|
| Number (m/f) | 33 (22/11) | 30 (17/13) | 0.58 |
| Age/years | 59.9 ± 11.3 | 52.6 ± 4.0 | 0.0016* |
| Height/cm | 173 ± 8 | 176 ± 10 | 0.21 |
| Weight/kg | 69.5 ± 11.1 | 76.5 ± 16.2 | 0.051 |
| Onset (spinal/bulbar) | 30/3 | ||
| Disease duration/months | 23.2 ± 17.2 | ||
| ALSFRS-R | 36.2 ± 6.0 | ||
| Progression rate × year | 6.1 ± 4.2 |
- Progression rate was calculated by (progression rate) = (48 – ALSFRS-R)/(disease duration).
- ALSFRS-R, ALS functional rating scale (revised).14
- * p < 0.05.
Magnetic resonance imaging acquisition
MRI scans were obtained on a 3.0 Tesla Philips™ Achieva system with 32 receive channels. A modified Dixon sequence (mDixon)15, 16 with three recorded echoes was used, consisting of 540 axial slices of 3.0 mm thickness, 0.75 mm × 0.75 mm in-plane resolution (740 × 740 matrix), covering the whole body from throat to feet; echo time (TE) was 1.1 ms, repetition time (TR) was 6.4 ms. Hands and feet were separately recorded with a higher resolution protocol of 0.6 mm thickness, 0.50 mm × 0.50 mm in-plane resolution (704 × 704 matrix); TE was 2.3 ms, TR was 10.7 ms. The total acquisition time was 30 min.
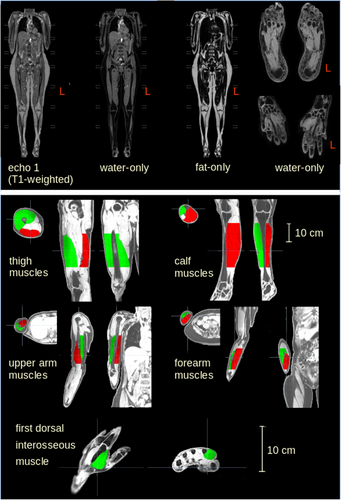
Whole body data were received from scanner-internal reconstructed 3-D images with a resolution of 0.69 × 0.69 × 1.5 mm3 (matrix 155 × 768 × 2129). After reconstruction of the echo-signals, each dataset consisted of T1-weighted data, water-only data, fat-only data, and fat-fraction data.
Data analysis

Muscle tissue selection
The optimal threshold values for the intensity range for detecting muscle tissue were determined manually. The results were tested for stability and reached a variability of <5%. Thus, it was possible to differentiate between the different types of tissue such as subcutaneous fat and muscle. This procedure enabled the subsequent manual labeling of only the muscular tissue. To determine the muscle volume and the muscular structure parameters, selected areas of the muscle groups were determined using anatomical landmarks: the thigh was determined from the small trochanter to the upper edge of the patella; the calf was determined from the lower edge of the patella to the upper ankle joint; the upper arm was determined from the surgical neck of the humerus to the head of radius; the forearm was determined from the head of radius to the wrist joint (Fig. 1). The analysis procedure refrained from marking the entire muscle, as marking peripheral muscular structures such as the tendon insertions proved to be methodologically more complicated and thus more prone to error. The aim of this selective choice of muscle regions to be analyzed was therefore to prioritize the muscle belly in the analysis; only the first dorsal interosseous muscle was completely marked due to its smaller volumetric size. The differentiation between muscle and other tissue types proved most accurate in the water-only image of the mDixon sequence so that all muscles were labeled in this sequence in the first step and the labeling masks were subsequently transferred to the fat-only and T1-weighted sequence.
Comparison of directly and indirectly innervated muscles
Based on the previous clinical study,3 muscle counterparts of directly and indirectly innervated muscles were compared: some comparisons involved muscle groups acting at the same joint (elbow extensor and flexor, hand flexors and extensors, knee extensors and flexors as well as plantar flexors and extensors), other comparisons compared upper limb muscle groups known to receive some of the strongest corticomotoneuronal projections (thumb abductors and hand extensors) with those that receive less corticomotoneuronal input (elbow extensors).
Muscle power grade
The clinical muscle power grade was measured using the UK Medical Research Council (MRC) scoring system19 after physical examination and testing of strength in muscles or muscle groups as previously defined with respect to their corticomotoneuronal projections.
Statistics
For the comparisons at the group level, Student's t-test (in case of normally distributed data) or Mann–Whitney U-test were used. Significance was defined at α-level 0.05; the Benjamini–Hochberg method (false discovery rate) was used for correction for multiple comparisons.
Results
Artifact-related exclusion of individual muscles
Due to artifacts based on B0 inhomogeneities, especially in the lateral portions of the upper extremities, not all muscles of the entire patient and subject cohort could be evaluated. In addition, the lower extremity as well as the first dorsal interosseous muscle were affected by artifacts in a few cases. Hence, 156 muscles affected by B0 inhomogeneities had to be excluded from further analysis so that in summary, 978 muscles contributed to the analysis.
Corrections for height and sex
The regression analysis with the target muscle volume showed that the height of the healthy controls had an influence on the volume of muscles studied. Furthermore, MRI parameters showed an association with sex. Thus, all results parameters were corrected for height and sex.
Association of MRI findings and ALSFRS-R
The Supplementary Figure shows a visual comparison of an MRI recording of the thigh between a control and a patient with ALS (panel A), and the panels B–D of the Supplementary Figure depict the association of the MRI parameters of ALS patients and ALSFRS-R. The ALSFRS-R score of the patients correlated positively with the MRI-based parameters volume (p = 0.005, r = 0.39) and fRMA (p = 0.003, r = 0.43), respectively, and negatively with the fat fraction (p = 0.006, r = −0.50).
Comparison of MRI-based parameters
Figure 2 shows the comparisons of the MRI analysis of muscle volume, fat fraction, and the fRMA by z-scores between patients with ALS and the healthy control group. Both muscle volumes and fRMA values showed a reduction in all muscle groups in the ALS patients compared to controls, whereas the fat fraction showed an increase in all muscle groups in ALS.

Muscle power grade
- Clinically severely affected MRC-score 0–2 (n = 88).
- Clinically affected MRC-score 3–4 (n = 260).
- Clinically unaffected MRC-score 5 (n = 246).
Figure 2 shows the z-normalized association of MRC-scores with the MRI parameters muscle volume, fat fraction, and fRMA of ALS patients compared to the healthy controls. Muscle volume and fRMA showed a reduction in ALS patients compared to controls which was associated with lower MRC-scores, whereas the fat fraction showed an increase with lower MRC-scores.
Comparison between muscles with direct and indirect corticomotoneuronal input
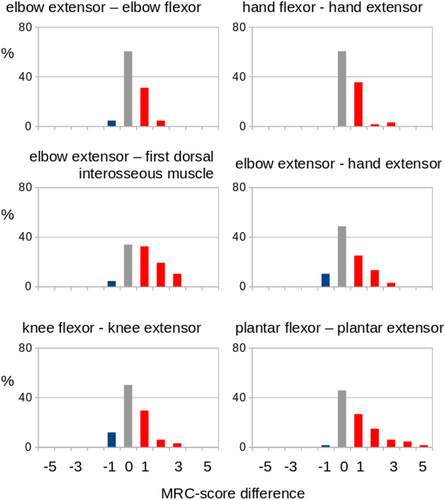
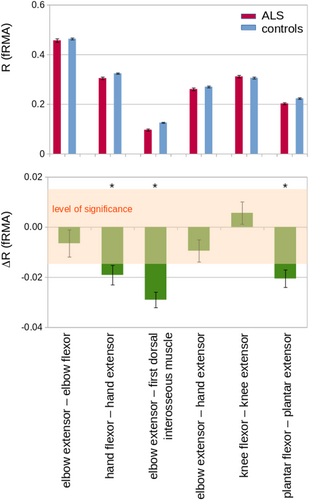
According to the previous data,3 counterparts of muscles with more direct and indirect corticomotoneuronal input were compared, as detailed in the Methods. Figure 3 shows the MRC-score comparison of muscle counterparts of directly and indirectly innervated muscles. The directly innervated muscle showed a more marked involvement (lower MRC-scores) compared to the indirectly innervated muscles. In order to compare the differences in MRI-based parameters of directly and indirectly innervated muscles (following Eq. 3), R was defined for the respective MRI parameter of the directly (PA) and indirectly (PB) innervated muscle. Only muscle pairs containing at least one clinically affected muscle were included. By this approach, muscles receiving strong direct corticomotoneuronal innervation were shown to have more marked morphological alterations compared to indirectly innervated muscles (Fig. 4). Table 2 summarizes the results: the first dorsal interosseous muscle was more strongly affected than the elbow extensor (triceps) in each examined MRI parameter; the volumes as well as the fRMA of the plantar extensors was significantly lower compared to its more indirectly innervated comparator muscle, the plantar flexors; the fRMA values showed more affection of the hand extensors compared to the hand flexors. The analyses of the other MRI-based parameters in the comparisons between the muscle groups achieved no significant results, but trends (in favor of the more directly innervated muscles) for the comparisons of elbow flexors versus elbow extensors and of hand extensors versus elbow extensors, respectively.


| #Muscle group comparison | Muscle pairs (directly vs. indirectly innervated) | ΔR (volume) | ΔR (fat fraction) | ΔR (fRMA) |
|---|---|---|---|---|
| 1 | Elbow extensor (triceps) – elbow flexor (biceps) | −0.01 | 0.03 | −0.01 |
| 2 | Hand flexors – hand extensors | −0.01 | −0.04 | −0.02* |
| 3 | Elbow extensor (triceps) – first dorsal interosseous muscle | −0.02* | 0.11* | −0.03* |
| 4 | Elbow extensor (triceps) – hand extensors | 0.00 | 0.00 | −0.01 |
| 5 | Knee flexors – knee extensors | 0.01 | −0.10 | 0.01 |
| 6 | Plantar flexors – plantar extensors | −0.02* | 0.04 | −0.02* |
- Values marked with * correspond to statistically significantly more marked involvement of the muscles with direct corticomotoneuronal input in ALS patients, p < 0.05 corrected for multiple comparisons.
- fRMA, functional remaining muscle area.
Discussion
In this study, MRI signal-based quantification of muscle affectations was applied to patients with ALS according to a standardized protocol in order to analyze the pattern of muscle affection and its potential association with the underlying central nervous system pathoanatomy of ALS. MRI parameters (i.e., volume, fat fraction, and fRMA) were identified as altered in all investigated muscle groups and correlated with clinically evident pareses/MRC scores as well as with the ALSFRS-R. In confirmation of the previous clinical study,3 counterpart pairs of directly and indirectly innervated muscles showed significant differences in MRC scores. For the MRI-based parameters analyzed in the current study, the differences between the counterparts of muscles with direct and indirect corticomotoneuronal input tended to be particularly pronounced (e.g., plantar extensors vs. plantar flexors and first dorsal interosseous muscles vs. elbow extensors). Consistent with the hypothesis, significant fRMA differences between directly and indirectly innervated muscles were identified in three of six muscle pairs (i.e., the directly innervated muscles were more markedly affected), while two of the remaining muscle pairs showed a trend (Table 2, Fig. 4). In all of these comparisons, the relatively small sample size have to be taken into account, especially when compared to previous purely clinical studies which addressed the related clinical research question.3
At the methodological level, the technical approach to assess muscle involvement in the motoneuron disorder ALS was able to provide quantitative data of volume reduction and fatty degeneration by use of the standardized acquisition protocol and data post-processing. The combined parameter fMRA was observed to be particularly suitable for revealing muscular alterations. Given the associations with the clinical paresis (MRC grading) or, at a more general level of the disease process, with the ALS-FRS-R, these findings can be regarded as a correlate of the clinically relevant process. Our study has thus established the general approach to visualize patterns of muscle involvement in motoneuron disorders, with the advantage of the noninvasive application, the anatomical visualization, and the quantification of the damage. Despite the increasing general availability of MRI scanning, cost considerations and the burden of the data acquisition in supine position—although the MRI acquisition time of 30 min was tolerable for all ALS patients in the study—will prevent that the MRI approach will replace the standardized electrophysiological investigation of muscle damage.
With respect to the specific hypothesis of the current study—that the pattern of muscle weakness in ALS reflects the known pattern of corticomotoneuronal influence on different muscle groups—our data are in agreement with a previous clinical study in 436 ALS patients.3 The combined parameter fMRA could demonstrate that three of the investigated counterpart muscle pairs (i.e., hand flexors vs. hand extensors, elbow extensor [triceps]—first dorsal interosseous muscles, and plantar flexors—plantar extensors) exhibited significant differences in the extent of the changes so that these more distal muscle groups seem to be the ones with the most prominent differential involvement according to the MRI data. The nonsignificant result in the comparison of elbow extensor versus flexor is likely to be caused by the low sample size, given that the clinical observation has been clearly seen in two independent studies, also called “split elbow.”3, 4 While this comparison and the comparison of hand extensor versus elbow extensor showed a statistical trend, the comparison knee extensor versus knee flexor could not demonstrate a clear-cut pattern. It is important to note that also in the clinical study,3 the evidence for a difference in this pairwise comparison was the lowest and requires further investigation. Pragmatically speaking, these more proximal muscle groups of the lower limbs are also often clinically not predominantly affected in ALS. As a reduction in the number of investigated muscles in muscle MRI studies goes along with a reduction of the acquisition time, future studies in ALS might regard these muscles as potentially dispensable.
On the one hand, this prospective study had strengths in the methods, that is, the standardized MRI protocol and the dedicated postprocessing cascade with different readout parameters in well-defined patients and matched controls, as well as the hypothesis-guided approach. On the other hand, the study has also limitations. The subject number was low compared to studies without MRI in the study protocol such as the clinical assessment with more than a hundred times more patients.3 This limited subject number might have contributed to the lack of significant effects in the analysis of the two muscle pairs which showed trend effects. Further studies in larger ALS patient cohorts should be performed accordingly. In addition, ALS patients and controls were not age-matched; however, no association of any parameter to age was found. Furthermore, semiautomatic labeling, as used in our analysis, is a time-consuming procedure, whereas artificial intelligence-based methods would save significant data processing time, as already used in body composition analyses.20
The current study focuses on the role of muscle MRI to differentiate healthy controls from ALS. As the quantitative analysis strategy/parameterization of findings has been shown to be successful, this paves the way to further studies with the ultimate goal to distinguish ALS from ALS mimics or myopathies and the role of muscle MRI therein. For instance, one of the differential diagnoses of ALS, inclusion body myositis (IBM), is associated with prominent paresis of the hand flexors21, whereas MRI parameters showed a more pronounced damage to the hand extensors compared to the hand flexors in the ALS patients in the current study. Thus, the inclusion of an image-based detection of tissue alterations in specific muscle groups could potentially add to the differentiation of ALS from its mimics.
In summary, this study on parameterization and quantification of muscle alterations from MRI was the first to demonstrate muscle MRI-based evidence for a characteristic pattern of pareses in ALS and might serve as a pilot study for the MRI-based detection of specific muscular alterations in patients with ALS and their differentiation from healthy controls which may enable the future development of muscle MRI as a biomarker in ALS. The findings were in accordance with the neuroanatomical staging of corticofugal involvement in the disease: muscles receiving strong direct corticomotoneuronal innervation were more severely affected than the corresponding counterpart muscles with more polysynaptic corticomotoneuronal innervation, in support of the concept that ALS specifically affects muscle groups with strong corticomotoneuronal connections.
Acknowledgments
The authors would like to thank the Ulm University Center for Translational Imaging MoMAN for its support. The team of the Department of Diagnostic and Interventional Radiology, University of Ulm, Germany is thankfully acknowledged for the clinical reading of the body MRI scans. Open Access funding enabled and organized by Projekt DEAL.
Author Contributions
NW: Data analysis, subject recruiting, and revising the manuscript for intellectual content. HPM: Data analysis, data curation, and drafting of manuscript. PM: Data acquisition and revised the manuscript for intellectual content. VR: Data acquisition and revised the manuscript for intellectual content. ACL: Design and conceptualization of study and revised the manuscript for intellectual content. JK: Study supervision, design, and conceptualization of study, and drafting of manuscript.
Conflict of Interest
None for all authors.
Funding Information
No funding.
Open Research
Data Availability Statement
We report how we determined our sample size, all data exclusions, all inclusion/exclusion criteria, whether inclusion/exclusion criteria were established prior to data analysis, all manipulations, and all measures in the study. Due to confidentiality barriers for clinical and research data (regulations of the University and Rehabilitation clinics Ulm and ethics statement), data are not archived in a public repositories. Data sharing requests can be addressed to the corresponding author and require a formal data sharing agreement. Data sharing agreements must include details on how the data will be stored, who will have access to the data and intended use of the data, and agreements as to the allocation of intellectual property. No part of the study procedures was preregistered prior to the research being conducted.


