18F-FDG uptake in denervated muscles of patients with peripheral nerve injury
Funding information
This work was supported by a grant from the National Research Foundation of Korea (NRF), which is funded by the Korean government (Ministry of Science, ICT & Future Planning) (No.2015R1C1A1A02037192).
Abstract
Objective
We aimed to investigate the clinical significance of increased uptake in 18F-fluorodeoxyglucose positron emission tomography in patients with peripheral nerve lesions.
Methods
We selected patients with unilateral peripheral nerve lesions confirmed with electromyography who had undergone 18F-fluorodeoxyglucose positron emission tomography covering the lesions. In the denervated muscles and their contralateral corresponding pairs, a mean (SUVmean) and maximum standardized uptake value (SUVmax) were obtained from 18F-fluorodeoxyglucose positron emission tomography images. We analyzed the difference in these values between the denervated and normal muscles. The lesion-to-normal ratio of the SUVmean (LNRmean) between each muscle pair was also obtained. Subgroup analysis was performed to find whether these three parameters were related to severity, abundance of abnormal spontaneous activity, and etiology.
Results
Twenty-three patients with 38 denervated muscles were included. Compared to their normal counterparts, the denervated muscles showed significantly higher SUVmax (1.33 ± 0.49 vs. 1.10 ± 0.37, n = 38, P < 0.001) and SUVmean (0.91 ± 0.31 vs. 0.77 ± 0.28, n = 38, P < 0.001). The muscles with severe neuropathy showed significantly higher LNRmean than those with mild neuropathy (1.30 ± 0.36, n = 19 vs. 1.11 ± 0.24, n = 19; P = 0.046), and the muscles with traumatic neuropathy showed significantly higher LNRmean than those with nontraumatic neuropathy (1.32 ± 0.28, n = 13 vs. 1.14 ± 0.33, n = 23; P = 0.015).
Interpretation
Denervated muscles with peripheral nerve injury showed higher uptake than normal muscles in 18F-fluorodeoxyglucose positron emission tomography, and this was associated with severity and etiology.
Introduction
Peripheral nerve injury is a common neuromuscular disorder manifesting as pain, numbness, or paralysis. It can be caused by trauma, including iatrogenic injury, and nontraumatic conditions such as compression, tumor, or other systemic diseases. Although localized neuropathy rarely causes mortality, it certainly affects the function in daily living.1
Clinicians can determine the location and severity of nerve injury using electrophysiological methods, such as nerve conduction studies (NCS) and needle electromyography (EMG).2 In denervated myocytes, resting membrane potential is increased to the threshold level of activation and lead to abnormal spontaneous activity (ASA).3 It can be detected in the form of fibrillation potential or positive sharp waves, known as denervation potentials, in EMG.4
However, needle EMG has several disadvantages, notably invasiveness and pain.5 Moreover, interpretation of the findings is rather subjective.6 To avoid these problems, magnetic resonance imaging and ultrasonography have been used to assess nerve damage.7-9 However, these radiological examinations rely largely on nonspecific morphological changes, such as edema and fibrotic changes.10, 11 Recently, magnetic resonance neurography has been used to visually demonstrate peripheral nerve pathologies more precisely, but most imaging techniques still remain complementary.12-14 Therefore, we designed a functional imaging study to characterize the electrophysiological change after nerve injury.
Behera et al reported that denervated muscles showed increased uptake in 18F-fluorodeoxyglucose (FDG) positron emission tomography (PET) in an animal model.15 We clarified this phenomenon in a controlled animal study.16 Our recent study investigated its mechanisms and temporal characteristics to explore its potential as a diagnostic tool for peripheral nerve injury.17 We also reported a human case series of patients with iatrogenic spinal accessory neuropathy who showed increased uptake in the trapezius muscles in FDG-PET.18
FDG-PET is widely used to assess musculoskeletal tumors.19, 20 However, since physiological muscle contraction can become a source of false-positives,21 the uptake signal of muscle is often ignored during interpretation. Since previous findings have implied that glucose hypermetabolism is a universal phenomenon in denervated muscles, it must be confirmed in clinical settings and explored as the basis for a new diagnostic method.
In this study, we ascertained whether denervated muscles showed higher FDG-PET uptake than normal muscles in patients with peripheral nerve lesion, and whether the increased uptake was correlated with clinical parameters.
Subjects and Methods
Patients
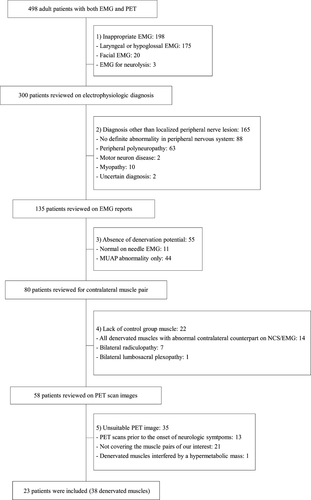
We reviewed the medical records of our EMG clinic to extract records of patients who had undergone both EMG and PET between 2010 and 2014. The inclusion criteria were (1) age over 18 years at the time of EMG and PET, (2) localized peripheral nerve lesion with denervation potentials, and (3) FDG-PET taken after neurological symptom onset and covering denervated muscles. The exclusion criteria were (1) EMG of the facial, laryngeal, or tongue muscles only, (2) diagnoses other than localized peripheral nerve lesion, (3) bilateral neuropathy involving the same myotome on each side, and (4) PET that did not cover the denervated muscles. In each patient, the EMG-confirmed denervated muscles were identified on the FDG-PET image. According to these criteria, 498 patients were screened; 23 patients with 38 denervated muscles were included (Fig. 1). This study was approved by the Institutional Review Board of our hospital, and the requirement for informed consent was waived because of its retrospective nature.
Electrophysiological Study
In all studies, Medelec Synergy Plinth (Oxford Instruments, UK) or Nicolet EDX (Natus Neurology Inc., USA) portable electrodiagnostic systems was used. In the NCS, onset latency and amplitude of compound muscle action potential (CMAP), and sensory nerve action potential, were measured in the peripheral nerves of the upper or lower limbs.
In EMG, a monopolar electrode (Disposable Monopolar Needles; Natus Neurology, USA) was used. If ASA was detected in two of four needle sampling directions, it was graded as 1+. If it was detected in three of four sampling directions, it was graded as 2+. If ASA was detected in all sampling directions, it was graded as 3+. If the EMG baseline was obliterated by ASA at all sites, it was graded as 4+.4, 22 The morphology, recruitment, and interference patterns of motor unit action potentials (MUAPs) were evaluated from volitional muscle activity. The electrophysiological diagnosis was based on the distribution of neurological abnormalities, considering the NCS and EMG results. The severity of neuropathy was graded as either mild or severe based on electrophysiological findings. Specifically, injury of a nerve innervating the muscle was graded as “severe” only if CMAP were undetectable, or only if none or single MUAP was observed during maximal volitional activity. All electrophysiological studies were performed and interpreted by experienced electromyographers.
FDG-PET
In 22 patients, FDG-PET images were acquired using dedicated PET/CT scanners (Biograph True point 40 with V and Biograph mCT 40; Siemens, Germany), combining a full-ring PET scanner with 2 mm resolution and a 40-slice spiral CT scanner. In one patient, a PET/MR scanner was used (Biograph mMR, Siemens, Germany), combining a full-ring PET with a 3.0-T MR scanner. Before FDG-PET, patients were required to fast for at least 8 h, avoid exercise, and discontinue drugs that can affect the result. Patients’ blood sugar was tested before FDG injection, and the study was rescheduled if the level was higher than 11.1 mmol/L. An FDG dose of 5.18 MBq/kg was intravenously administered. Sixty minutes after FDG injection, emission scans were acquired while the patients lay supine in the scanner. The routine protocol covered the region from the base of the skull to the upper thighs; the lower legs were selectively covered in indicated patients. An FDG-PET examination time of 2 min per bed position, with 5–7 bed positions, was used. The acquired images were reconstructed using iterative ordered-subset expectation maximization True-X algorithms. The size of the reconstructed voxel was 3.12 mm × 3.12 mm × 4.98 mm.
Comparison with a standardized uptake value
On the PET images of each patient, we localized the muscles that showed denervation potentials upon EMG. The axial cut containing the most hypermetabolic area of the muscle was determined by visual assessment, and this region of interest (ROI) was manually drawn along the circumference of the muscle in that image (Fig. 2). In each ROI, the standardized uptake value (SUV) was provided as both a maximal and average value. The axial images of the slices just superior and inferior to the most hypermetabolic area were subjected to the same process, for a total of three ROIs in each denervated muscle. Among the maximal SUVs of the three ROIs in each muscle, the highest value was defined as the maximal uptake value (SUVmax) of the muscle. The mean SUV of the three ROIs in each muscle was defined as the mean uptake value (SUVmean) of the muscle.
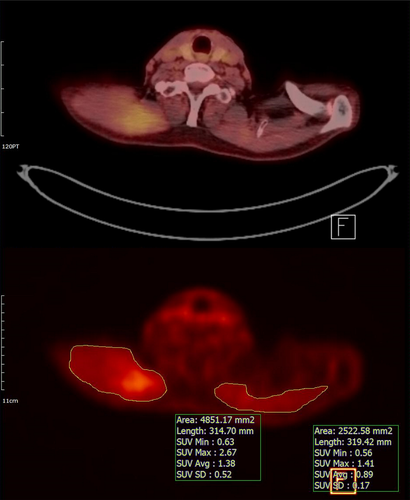
For each denervated muscle, the anatomically corresponding muscle on the contralateral side was selected as a control. The SUVmax and SUVmean of each control were also obtained. The SUVmax and SUVmean of the denervated and the control muscles were collected to confirm the hypothesis: denervated muscles show higher SUV than control muscles. We also obtained the lesion-to-normal ratio of the SUVmean (LNRmean) between the denervated muscles and their contralateral controls.
Subgroup analysis
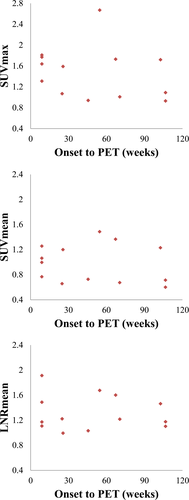
Patients were classified into subgroups according to neuropathy severity, ASA abundance, and neuropathy etiology. Neuropathy severity was recorded as either severe or mild. ASA abundance was graded from 1+ to 4+ based on EMG findings. We categorized the etiology of neuropathy in each patient into one of three groups: traumatic, nontraumatic, or undetermined. Traumatic etiology included definite traumatic events involving peripheral nerve lesions. Nontraumatic etiology included entrapment neuropathy, herniated intervertebral discs, tumor invasion, viral infection, and radiotherapy-induced neuropathy. If we could not determine whether the nerve lesion was caused by trauma, it was classified as having undetermined etiology. For each parameter, subgroup analyses of the SUVmax, SUVmean, and LNRmean were performed to determine statistical differences. Furthermore, the time interval between the onset of neurological symptoms and the date of PET was calculated when available, to plot PET uptake variables against time to elucidate their relationship.
Statistical analysis
The datasets of the denervated and control groups were checked using Shapiro–Wilk analysis. It showed nonnormal distribution, so the SUVmax and SUVmean were compared using Wilcoxon signed-rank test. Between subgroups, the SUVmax, SUVmean, and LNRmean were compared using either the Mann–Whitney or Kruskal–Wallis test. Spearman’s correlation analysis was performed to find the relationship between ASA abundance and PET parameters (SUVmax, SUVmean, and LNRmean), and between the time interval from the onset of symptoms to PET and the PET parameters. Statistical significance was defined as a P-value < 0.05.
Results
Patient characteristics
Totally, 23 patients were analyzed, with 38 muscles that showed ASA in EMG and were covered by PET. Clinical data of the included patients are summarized in Table 1 and 2. All patients with traumatic injury had partial axonotmesis; none had complete axonotmesis. The mean time interval from EMG to PET was 13 ± 29 weeks. The time interval from the onset of neurological symptoms to the date of PET was more than 1 month in all but one patient, and more than 6 months in 14 patients. The exact date of neuropathy onset was identified in nine patients, all of whom had traumatic etiology. All but two patients had been diagnosed with cancer before they underwent PET; two patients were diagnosed with cancer by the PET (Table 2).
| No. | Sex | Age | Chief complaint | Onset of EMG (weeks) | EMG to PETa (weeks) | Nerve lesion | Severity | Etiologyb | Specific cause | Analyzed muscles |
|---|---|---|---|---|---|---|---|---|---|---|
| 1 | M | 84 | Arm weakness | 12 | 18 | Brachial plexopathy | Severe | Non-traumatic | Viral infection | D, IST, LS |
| 2 | F | 66 | Leg weakness | 4 | 0 | L3 radiculopathy | Mild | Non-traumatic | Collapsed L4 vertebra | IP, AL, RF, L3, L5 PSP |
| 3 | F | 69 | Arm weakness | 4 | −5 | Brachial plexopathy | Mild | Non-traumatic | Tumor, 1st rib | D, SST |
| 4 | F | 59 | Buttock tingling | 5 | 19 | S1-S4 radiculopathy | Severe | Traumatic | Iatrogenic | BF |
| 5 | M | 66 | Shoulder weakness | 45 | 22 | CN XI neuropathy | Severe | Traumatic | Iatrogenic | TPZ |
| 6 | F | 50 | Leg weakness | 17 | 85 | CN XI neuropathy | Mild | Traumatic | Iatrogenic | TPZ |
| 7 | M | 64 | Leg weakness | 18 | −9 | Lumbosacral plexopathy | Severe | Traumatic | Fall down | BF |
| Arm weakness | C6 radiculopathy | Mild | D, BB, TB | |||||||
| 8 | F | 48 | Leg weakness | 52 | −6 | Lumbosacral plexopathy | Mild | Undetermined | Not definite | Gmed |
| 9 | F | 54 | Leg weakness | 52 | −10 | Lumbosacral plexopathy | Severe | Non-traumatic | Radiotherapy | Gmed, BF |
| 10 | M | 65 | Shoulder weakness | 18 | 36 | CN XI neuropathy | Mild | Traumatic | Iatrogenic | TPZ |
| 11 | M | 53 | Arm weakness | 67 | 3 | Brachial plexopathy, | Severe | Traumatic | Iatrogenic | BB |
| 12 | F | 41 | Foot drop | 104 | 1 | Sacral plexopathy | Severe | Non-traumatic | Tumor, sciatic foramen | BF |
| 13 | F | 56 | Thigh pain | 12 | 1 | Obturator neuropathy | Severe | undetermined | Not definite | AL |
| 14 | F | 56 | Leg weakness | 2 | 43 | Obturator neuropathy | Severe | Traumatic | Iatrogenic | AL |
| 15 | F | 53 | Arm weakness | 16 | −15 | Brachial plexopathy | Mild | Non-traumatic | Tumor, shoulder | D, IST, BB |
| 16 | F | 35 | Leg weakness | 104 | −1 | Sacral plexopathy | Severe | Non-traumatic | Tumor, sacrum | GCM |
| L5 radiculopathy | Mild | PL | ||||||||
| 17 | M | 76 | Leg numbness | 2 | 5 | L5 radiculopathy | Severe | Non-traumatic | L4/5 HIVD | L5 |
| 18 | F | 80 | Hand pain | 8 | −1 | C7 radiculopathy | Mild | Non-traumatic | Tumor, C6-T1 vertebrae | ECRL |
| 19 | F | 61 | Shoulder weakness | 52 | 0 | CN XI neuropathy | Severe | Non-traumatic | Tumor, salivary gland | TPZ |
| 20 | M | 58 | Leg weakness | 40 | 1 | Lumbosacral plexopathy | Severe | Non-traumatic | Tumor, presacral | Gmed |
| 21 | F | 22 | Leg weakness | 28 | −7 | Lumbar plexopathy | Severe | Non-traumatic | Tumor, iliopsoas | VM |
| 22 | F | 54 | Leg numbness | 8 | 99 | CN XI neuropathy | Severe | Traumatic | Iatrogenic | AL, AM |
| 23 | M | 58 | Shoulder weakness | 6 | 20 | CN XI neuropathy | Mild | Traumatic | Iatrogenic | TPZ |
- CN XI, cranial nerve XI; HIVD, herniated intervertebral disc; D, deltoid; IST, infraspinatus; IP, iliopsoas; AL, adductor longus; RF, rectus femoris; PSP, paraspinalis; SST, supraspinatus; BF, biceps femoris; TPZ, trapezius; BB, biceps brachii; TB, triceps brachii; Gmed, gluteus medius; GCM, gastrocnemius (medial head); PL, peroneus longus; ECRL, extensor carpi radialis longus; AM, adductor magnus.
- a Time interval from EMG to PET is provided, and negative values indicate that PET was performed prior to EMG.
- b Nontraumatic etiology includes entrapment neuropathy, radiculopathy with herniated intervertebral discs, tumor invasion, herpes zoster infection, and radiotherapy-induced neuropathy.
| No. | Primary cancer | RT field | Postoperative time at FDG-PET (months) | Post-RT time at FDG-PET (months) | Indication for FDG-PET |
|---|---|---|---|---|---|
| 1 |
Follicular lymphoma (Rt. inguinal node) |
N/A | N/A | N/A | suspected recurrence |
| 2 | Lung cancer | L4 | 44 | 17 | suspected recurrence |
| 3 | Breast cancer, Lt. | C1-T1 | 175 | 64 | response evaluation |
| 4 | Cervical cancer | N/A | 6 | N/A | suspected recurrence |
| 5 | Glottic cancer | Neck | 16 | 13 | surveillance |
| 6 | Thyroid cancer | N/A | 24 | N/A | surveillance |
| 7 | Kidney cancer, Lt. | N/A | 38 | N/A | suspected recurrence |
| 8 | Rectal cancer | N/A | 27 | N/A | response evaluation |
| 9 | Cervical cancer | Pelvis | 69 | 128 | suspected recurrence |
| 10 | Olfactory neuroblastoma | Head | 13 | 11 | surveillance |
| 11 | Thyroid cancer | N/A | 16 | N/A | surveillance |
| 12 | Cervical cancer | Pelvis | 23 | 18 | suspected recurrence |
| 13 | Urethral cancer | N/A | 6 | N/A | suspected recurrence |
| 14 | Ovarian cancer | N/A | 22 | N/A | suspected recurrence |
| 15 |
Multiple myeloma (Spine, ilium) |
N/A | N/A | N/A | suspected recurrence |
| 16 |
Osteosarcoma (Rt. Sacrum) |
Sacrum | 8 | 6 | suspected recurrence |
| 17 | Gastric cancer | N/A | 29 | N/A | suspected recurrence |
| 18 | None | N/A | N/A | N/A |
diagnosis of malignancy (C6-T1 vertebrae) |
| 19 | None | N/A | N/A | N/A | diagnosis of malignancy (submandibular gland) |
| 20 | Rectal cancer | Pelvis | 54 | 54 | suspected recurrence |
| 21 |
Nerve sheath tumor (Rt. femoral nerve) |
N/A | 1 | N/A | RT planning |
| 22 | Endometrial cancer | N/A | 25 | N/A | surveillance |
| 23 | Salivary duct cancer | Head | 6 | 3 | response evaluation |
- RT, radiation therapy; N/A, not applicable.
FDG-PET signal in denervated muscles
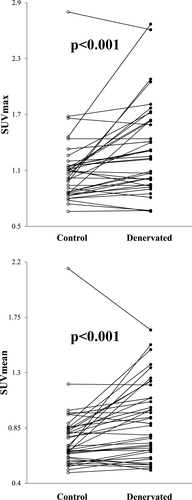
In 38 denervated muscles, the SUVmax was 1.33 ± 0.49 (median: 1.24), while it was 1.10 ± 0.37 (median: 1.07) in control muscles. A Wilcoxon signed-rank test showed significant differences between the two groups. (Z = 3.599, P < 0.001). The SUVmean of the denervated muscles was 0.91 ± 0.31 (median: 0.88), which was higher than that of the control (0.77 ± 0.28; median: 0.69) with statistical significance (Z = 3.857, P < 0.001; Fig. 3). The LNRmean of all 38 muscle pairs was 1.20 ± 0.31.
Subgroup analysis
Neuropathy was severe in 15 patients with 19 denervated muscles and mild in 10 patients with 19 denervated muscles (Table 1). Two patients had concurrent anatomical lesions of varying severity. The LNRmean of the severe subgroup was 1.30 ± 0.36 (median: 1.18) while that of the mild subgroup was 1.11 ± 0.24 (median: 1.07), which was significantly lower (Mann–Whitney test: U = 112.5, P = 0.047). The SUVmax and SUVmean showed no significant differences between the mild and severe subgroups (U = 176.5, P = 0.914 for SUVmax; U = 177, P = 0.925 for SUVmean; Fig. 4A).
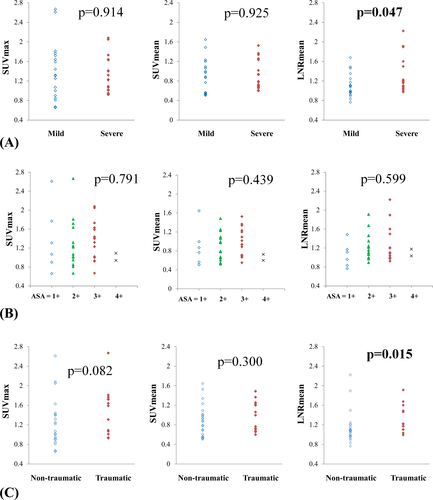
The ASAs were graded as 1+, 2+, 3+, and 4 + in 6, 15, 15, and 2 muscles, respectively. The Kruskal–Wallis test failed to show significant difference among these four subgroups in SUVmax, SUVmean, and LNRmean (H = 1.043, P = 0.791 for SUVmax; H = 2.705, P = 0.439 for SUVmean; H = 1.873, P = 0.599 for LNRmean; Fig. 4B). Spearman correlation analysis showed no significant relationship between ASA and the three variables (rs = 0.021, P = 0.899 for SUVmax; rs = 0.101, P = 0.548 for SUVmean; rs = 0.114, P = 0.496 for LNRmean).
The etiology of neuropathy was traumatic in nine patients with 13 denervated muscles, nontraumatic in 12 patients with 23 denervated muscles, and undetermined in two patients with two denervated muscles (Table 1). The LNRmean of traumatic and nontraumatic neuropathies were 1.32 ± 0.28 (median: 1.22) and 1.14 ± 0.33 (median: 1.07), respectively, and the difference was significant (Mann–Whitney test: U = 76, P = 0.015). No significant difference was found in SUVmax (U = 96.5, P = 0.082) or SUVmean (U = 117.5, P = 0.300) between the two subgroups (Fig. 4C).
The definite onset of neurological symptom was recorded in nine patients with 13 denervated muscles, all of whom had traumatic etiology. We plotted the SUVmax, SUVmean, and LNRmean against the time interval between onset of injury and date of PET (Fig. 5), but there was no demonstrable correlation (rs = −0.393, P = 0.184 for SUVmax; rs = −0.243, P = 0.424 for SUVmean; rs = −0.114, P = 0.710 for LNRmean).
Discussion
In this retrospective study, we used FDG-PET to show that denervated muscles have higher glucose metabolism than do normal muscles. Glucose metabolism showed significant difference, especially in patients with traumatic or severe nerve injury. These findings are in line with those in previous studies, although LNRmean values in this study were smaller than those in former reports. In rat models of complete sciatic nerve injury, the denervated muscles showed about 5 to 10-times higher uptake than contralateral muscles in FDG-PET.16, 17, 23 In a human case series of patients with spinal accessory neuropathy, their denervated trapezius muscles showed about 2 to 3-times higher mean uptake than the unaffected side in FDG-PET.18 However, the present study only showed an approximately 20% difference between the denervated and normal muscles in SUVs, perhaps because of heterogeneity between the studies. In the rat model, the duration and severity of nerve injury were significantly associated with LNRmean.17 The human case series investigated patients with iatrogenic accessory neuropathy who underwent PET less than 9 months after surgery.18 In the present study, the severity and etiology of nerve injury, as well as the timing of FDG-PET, varied widely among patients. Therefore, patients with mild, nontraumatic, or chronic-onset nerve lesions might have skewed the effect size.
In subgroup analysis, neuropathy severity affected the SUVs in denervated muscle. The neuropathy severity was determined based on both the CMAP amplitude and the MUAP activation patterns, which reflect the viability of axons.22 However, it is difficult to quantify severity accurately, because CMAP amplitude is not obtainable in all muscles, and the MUAP interpretation depends on the examiner’s experience and patient’s cooperation. In addition, it is technically difficult to evaluate the nerve injury severity in all muscular branches. In contrast, PET quantifies glucose metabolism in individual muscles using continuous variables. Therefore, it is interesting that we found a significant relationship between electrophysiologically graded severity and PET uptake values, considering the different characteristics of these two methodologies.
In contrast to severity, the ASA abundance was not significantly correlated with LNRmean (Fig. 4B). It takes several days for ASA to appear in the affected muscles, and it often disappears after several weeks3, 24 ASA is detectable using concentric or monopolar needle electrodes, which have a small recording area of 0.08 mm2 and 0.17 mm2, respectively.4 An electromyographer grades the abundance of ASA based on its appearance during multidirectional needling. Since ASA grading depends on these temporal, spatial, and examiner-dependent factors, it can be difficult to find a direct correlation with PET uptake values, unless such factors are well-controlled.
Traumatic etiology affected LNRmean in the present study. However it should be noted that the temporal course of nontraumatic neuropathy differs from that of traumatic injury. The patients with nontraumatic neuropathy in this study mostly had insidious-onset symptoms rather than acute damage. In cases of tumor infiltration or radiation therapy-induced neuropathy, neural damage progresses slowly.25, 26 Thus, the denervation-induced molecular changes may also be prolonged, taking a course different from that in traumatic neuropathies. However, due to the retrospective nature and small sample size of this study, we cannot differentiate the effect of trauma from that of time. Further prospective, controlled study is required to evaluate the effect of time on glucose uptake.
The present study had several limitations. Firstly, the time interval between EMG and PET, and that between nerve injury and PET, varied among the patients. Therefore, electrophysiological data may not reflect the actual state at the time of PET. Moreover, the postinjury time was heterogeneous and ranged from one week to two years. The underlying mechanisms of increased FDG uptake between patients who underwent FDG-PET one week and two years after injury might be different. Because a temporal course of glucose hypermetabolism in humans has not been reported yet, we aimed to assess the longitudinal temporal characteristics of this phenomenon by including patients across various postinjury time periods. However, a prospective study with controlled postinjury time is necessary for further investigation. Secondly, the muscles checked in the motor NCS were distal limb muscles, which were mostly not covered in the routine FDG-PET protocol. To more accurately establish the relationship between severity and SUVs, denervated muscles with CMAP recordings should be covered in PET. Thirdly, FDG-PET can lead to false positivity because of several factors. Physiological glucose uptake during normal muscle contraction is one such factor.21 If the patients failed to fully rest before PET, their control muscles may have shown significant glucose uptake. In denervated muscles, surgery or radiotherapy could alter the FDG uptake.27 However, the sites of the surgical procedures and radiation were distant from the denervated muscles in our patients. Therefore, direct effect of surgery or radiation is less likely to be the source of increased FDG uptake. Fourthly, the process of SUV measurement is a potential source of error because of the subjective manual delineation of the ROIs. In some images, the muscle boundaries were not clear so the delineated ROIs may have included adjacent muscles. Identification of the spatial pattern of denervated muscles is essential to localize a nerve lesion.9, 14 Therefore, error in ROI delineation are crucial problem to be solved to establish PET as a new diagnostic modality for nerve injury. Solutions to this problem could be a prospective study with predetermined optimal voxel size and the use of standardized image software, which were not available in this retrospective study. In addition, relatively small sample sizes and effect sizes were another limitation. Moreover, it should be noted that the present study followed an unblinded approach, which did not permit the deduction of any inferences on the diagnostic value or performance of FDG-PET to identify cases of denervated muscles in patients with peripheral nerve lesions.
This study revealed that denervated muscles in peripheral nerve lesions showed higher SUVs than healthy muscles in FDG-PET, and it was associated with severity and etiology of nerve injury. The ultimate goal of our study is to use FDG-PET as a novel diagnostic tool for patients with peripheral nerve injury, but there are still many limitations. Further prospective controlled studies, particularly at the acute stage of denervation, are needed to establish the value of FDG-PET as new diagnostic tool for peripheral nerve lesions.
Acknowledgments
This work was supported by a grant from the National Research Foundation of Korea (NRF), which is funded by the Korean government (Ministry of Science, ICT & Future Planning) (No.2015R1C1A1A02037192).
Author Contribution
S.H.L., B.M.O., H.C., and S.U.L. created the concept, designed, and supervised the study. J.S.C., S.H.L., H.G.S., B.M.O., H.C., G.J.C., and S.U.L. analyzed and interpreted data. J.S.C. and S.H.L. conducted experiments and drafted the manuscript. All authors read and approved the final version of the manuscript.
Conflicts of Interest
Nothing to report.


