A multidisciplinary analysis of the Crypt of the Holy Spirit in Monopoli (southern Italy)
ABSTRACT
Integrated geophysical surveys were undertaken in the Crypt of the Holy Spirit located in the Monopoli territory (Apulia region, southern Italy). The crypt is a remarkable example of a hypogeal church, sculptured in the rock. It is dated between the 12th and 13th century and underwent several architectural changes during the centuries. Geophysical surveys were performed in order to obtain information about the structural conditions of the crypt and to investigate the probable existence of features of archaeological interest (such as tombs) inside the crypt. Surveys were integrated into a comprehensive project for the restoration and the valorization of the crypt. Seismic (sonic and ultrasonic) and ground-penetrating radar (GPR) methods were used. GPR investigations provided information on possible buried remains. Some of the anomalies were emphasized and enhanced by microwave inversion tomography. Seismic refraction tomography along with GPR was performed on the hypogeal vault of the crypt, to detect possible internal fractures.
The columns of the crypt were investigated by ultrasonic and GPR techniques that demonstrated the presence of cracks and deteriorations. Finally, GPR prospection was performed on a wall in the presbytery. The GPR results allowed us to characterize a detachment phenomenon and to indentify a previous door opening.
INTRODUCTION
The importance, even economical, of research about cultural heritage is by now widely recognized. In particular, the European Union has been financing scientific and technological research projects for the protection, preservation and valorization of cultural heritage since 1984 and many research projects were financed since the first Framework Research Program (e.g., within the programmes ‘Science and Technology for the Protection of the Environment’, ‘Environment and Climate’ and ‘Energy, Environment and Sustainable Development’). In this framework, non-invasive monitoring of buildings and artefacts of historical and/or artistic value is an issue of great interest, because in many cases it allows to achieve both structural and historical information about the monument, avoiding the risk of damaging it. The well-advisedness, if not the urgency, of thinking of a planned monitoring of monuments, at least with regard to particularly important structures, has been further witnessed by some current events: in March 2010, in Rome (Italy) a partial collapse of the Domus Aurea, i.e., the residence of the Roman Emperor Nero, occurred, whereas in November 2010 another collapse occurred in the ancient Roman town of Pompei (Italy). After this general preamble and of course not independently from it, non-invasive architectural heritage monitoring is also widely dealt with in the scientific literature, e.g., with regard to ancient Roman and renaissance monuments (Barone et al. 2010), mediaeval churches (Ranalli et al. 2004; Utsi 2010) and even frescoes, balconies, marble statues and wooden artefacts (Pieraccini et al. 2006; Cosentino et al. 2009; Colla 2010). Of course, the list could be much longer.
Here, we present the case history of the Crypt of the Holy Spirit, in Monopoli (Apulia region, southern Italy). In particular, a project for the restoration and the valorization of this crypt has been financed by the San Domenico Foundation, under the permission of the Superintendence for the Cultural Heritage of the Apulia Region. Within this project, the Institute for Archaeological and Monumental Heritage (IBAM-CNR) has been put in charge of both invasive (petrographic) analyses and non-invasive prospecting (ground-penetrating radar (GPR), ultrasonic and seismic) and has also performed a laser scanning survey of the crypt aimed at its 3D model reconstruction and possibly its remote virtual access. This paper will be focused on non-invasive diagnostic prospecting (Dolce et al. 2010).
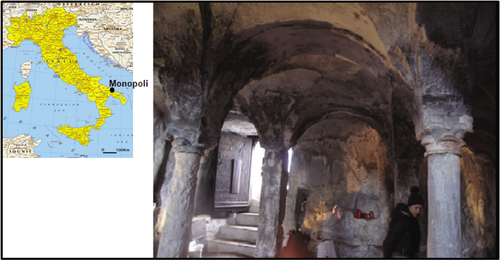
Geographic localization and inner view of the crypt.
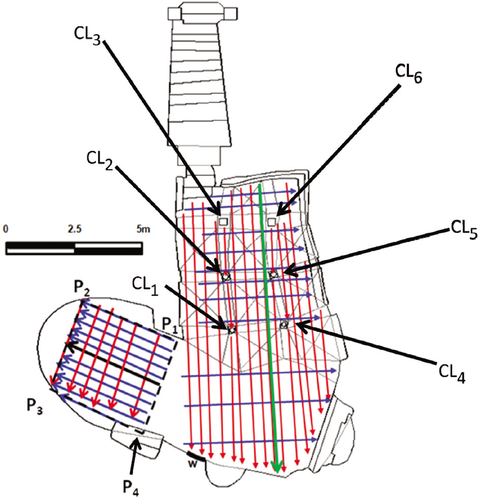
Map of the crypt: the arrows indicate the direction of the GPR scans on the floor. The dashed lines that connect the points P1, P2, P3 and P4 indicate the area where a tomographic inversion was performed. The labels CL1–CL6 identify the columns. The label w indicates the prospected piece of wall.
The crypt is a remarkable example of a hypogeal church, sculptured in rock with crossed vaults, arches, apses and divided into naves by two lines of columns. It is possible to find examples of similar architectures in Apulia (and in particular in the southern part of the Salento Peninsula (Fonseca et al. 1979)), the province of Taranto (Fonseca 1970; Masini 2004), Matera (De Ruggieri 1966), Sicily (Messina 1994) and Cappadocia (Turkey).
The crypt is dated between the 12th and 13th century, and underwent several architectural changes during the centuries. Currently, it consists of three parallel naves along its principal direction, each of which ends with an apse and a lateral nave, angled about 60 degrees with respect to the principal ones. This lateral nave is probably later in date. In Fig. 1 an image of the crypt is provided together with its geographic localization and in Fig. 2 the plan of the crypt with the tracks of the GPR scans is shown. The crypt also contains some wall paintings, mostly covered with a thick layer of white lime wash. However, some evidence of ancient paintings is still visible, both on the walls and on the capitals of the columns.
The non-invasive investigation was divided into two phases. The first one, performed on the floor of the crypt by means of GPR, was aimed at the detection of electromagnetic anomalies due to the presence of natural cavities or to other man-made structures. The second phase was devoted to the physical-mechanical characterization of the constitutive materials of the columns of the internal naves by means of integrated GPR and ultrasonic prospecting. Contextually to the second phase, further investigations (GPR and seismic) were performed on the top of the vaults, in order to assess the internal structure and the thickness of the ceiling rock, which is important in relationship to the stability of the whole ceiling.
THE GPR SURVEY ON THE FLOOR
- data word length: 16 bit;
- samples per scan: 512.
In order to provide an easier interpretation of the evidence, standard processing was performed on the raw data. The most important steps of the post-processing were a background removal on all the traces (Conyers and Goodman 1997; Persico et al. 2008) and a two-dimensional Kirchhoff migration (Yilmaz 1987).
Figure 3 shows one of the GPR processed scans (green arrow in Fig. 2). The profile refers to the acquisition with the antenna at 200 MHz. A general characteristic of the surveyed area is the good penetration depth of the electromagnetic energy, really estimable near the scale-bottom 120 ns. This corresponds to a depth of about 4.5 m, having estimated the mean electromagnetic (EM) wave velocity equal to 0.075 m/ns (i.e., the relative permittivity is estimated equal to 16, which is reasonable, because the soil is essentially a calcarenite with inclusions of ‘terra rossa’). In all the radar profiles, most of the observed anomalies are located between 35–80 ns. In particular, in this range of return times, corresponding to 1.3–3.0 m in depth and at about 2 m and 10 m from the beginning of the scan (see Fig. 3), four anomalies (A1, A2, A3 and A4) are evident. The shape and alignment of these anomalies suggest the presence of buried remains of possible archaeological interest.
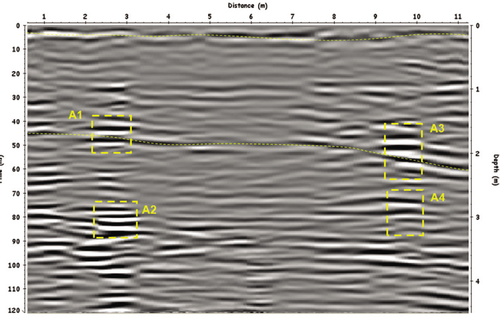
The result of the B-scan at 200 MHz evidenced by means of a green arrow in Fig. 2.
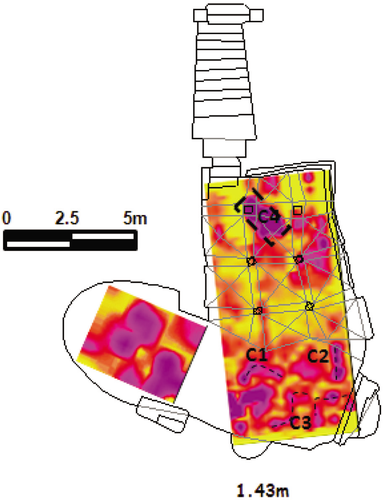
Depth slice at a depth of 1.43 m achieved from the 200 MHz antenna.
In Figs 4 and 5 we present two depth slices of the crypt, built by averaging the amplitudes of the processed data gathered with the antenna at 200 MHz, within consecutive time windows of width Δt = 10 ns. The spatial averaging along the depth can be useful to reduce small-scale heterogeneities and to mitigate some possible spike noise. Finally, the data were interpolated and gridded on a regular mesh. Δt was chosen, as is customary, of the order of the dominant period, i.e., of the order of the period of the central frequency of the antennas. In the case at hand, the nominal central frequency is 200 MHz but we have seen from the data that the actual central frequency is slightly lower than the nominal one, as customarily happens when the antennas work at the air-soil interface, especially for high values of permittivity of the soil. In the case at hand, this corresponds to an average layer thickness of 0.375 m. From the depth slices of Fig. 4, corresponding to a depth of 1.43 m, several meaningful anomalies can be observed, (labelled C1–C4), possibly ascribable to archaeological targets. In particular, the most important anomaly seems to be C4, close to the entrance. Other anomalies are also seen but they do not have a shape that makes us think of archaeological features.
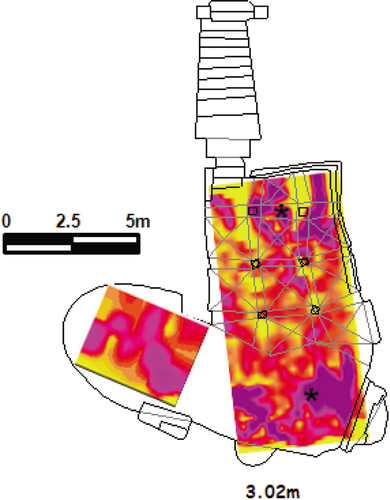
Depth slice of 3.02 m achieved from the 200 MHz antenna. The asterisks label the anomalies A2 and A4 of Fig. 3.
From the depth slices of Fig. 5, at a depth of 3.02 m, several anomalies are visible too. Some of them (see asterisks in Fig. 5) are in agreement with those observed in the slice at the depth of 1.43 m. In particular, there is something that might correspond to a deeper part of anomaly C4 of Fig. 4.
Moreover, the two asterisks correspond to the position of anomalies A2 and A4 in Fig. 3 (let us remind you that the line scan of Fig. 3 is the green arrow in the plan of Fig. 2).
MICROWAVE TOMOGRAPHIC INVERSION OF THE CRYPT FLOOR
In this section we show some results achieved from a tomographic inversion of part of the scans gathered on the floor, with the 600 MHz antennas, in order to achieve more detailed images (in the inverted area, relatively shallow anomalies had been identified from the raw data). The probed area is the rectangle bounded with a dashed line in Fig. 2, where also the four corners P1, P2, P3 and P4 are marked in order to make clear the orientation of the images. The tomographic algorithm is based on a 2D first-order Born model, discretized by means of the method of moments. The model was numerically inverted by means of a truncated singular value decomposition, which also provides some regularization (needed for the reliability of the results). For more details on the algorithm, the interested reader is referred to Soldovieri et al. (2007) and Masini et al. (2010) and references therein. For computational reasons, first the scans were zero padded up to the same length, then the inversion was performed on three adjacent investigation domains for each scan. Finally, the results were joined and the final part (corresponding to most of the zero padding) has been erased. The focusing capabilities of the algorithm are shown in Fig. 6, where both one of the GPR scans (after zero timing and muting of the interface) and the corresponding inversion result are shown. The scan is labelled with a black arrow in Fig. 2. As can be seen, the hyperbolas (denoted by two red circles in Fig. 6) are noticeably focused, which makes us think of little objects. In particular, it is not probable that they are graves, because in that case they would be larger and possibly would show some edge effects.
In Fig. 7, four depth slices achieved from the tomographic inversions are shown. The slices were obtained with an interpolation between the different scans (gathered at 40 cm from each other), so that the scans finally represented were 10 cm apart from each other. The area corresponding to images of Fig. 7 can be identified by means of a dashed rectangle in Fig. 2. In particular, the four corners, marked as P1, P2, P3 and P4 in the upper-left panel in Fig. 7, correspond to the homologous points in Fig. 2, so that there is no ambiguity in the orientation of the images.

The result of the inversion procedure on one of the B-scans at 600 MHz (black arrow in Fig. 2), compared with the corresponding raw data.
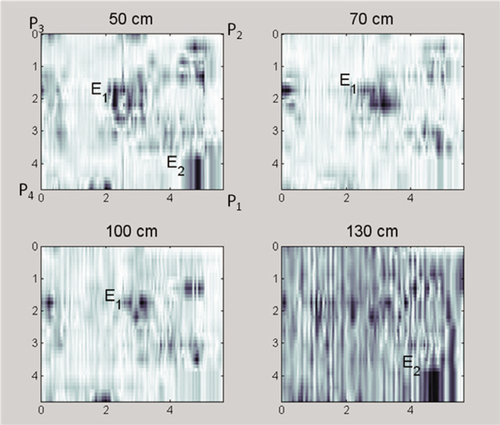
Four horizontal depth slices built up with the inverted data at different depths. The orientation with respect to the crypt is specified by the points P1–P4 that are also marked in Fig. 2.
In Fig. 7 a central anomaly is clearly visible (labelled E1 in the upper-left, upper-right and lower-left panels) and a second lateral anomaly (labelled E2 in the upper-right and lower-right panels) is also visible. Actually, in the zone of anomaly E1 some small discrepancy at floor level is also visible. This makes us suppose that some excavation might were performed in the past at this point and then the hole was filled up again. Anomaly E2 might suggest the presence of a small wall or some ‘squared’ stone: in this case, the top would be visible in the upper left-hand panel and the bottom in the lower right-hand panel.
GPR AND ULTRASONIC PROSPECTING ON THE COLUMNS AND WALLS
In order to investigate the structure of the columns and in particular the possible presence of internal fractures, a GPR survey was carried out with the same GPR system exploited on the floor, equipped this time with a high-frequency antenna with a nominal central frequency equal to 2000 MHz. The antenna was equipped with a survey wheel (with a smaller wheel with respect to the antenna at 200–600 MHz). The resulting spatial step was about 0.64 cm.
- data word length: 16 bit;
- samples per scan: 1024;
- recording time window: 12 ns.
In order to compare the GPR results with acoustical wave results moreover, some ultrasonic tests were performed with a 2-channel, 24-bit MAE digital instrument (model A5000U) equipped with 55 KHz PUNDIT contact probes.
The radar data were processed using the software Reflexw (Sandmeier 2009). The processing steps were the following: amplitude compensation (Leucci et al. 2007); background removal filter; Kirchhoff migration; envelopes. This calculation allowed us to emphasize the high amplitude values related to the backscattered energy. Actually, the employed processing is suitable for plane surfaces rather than cylindrical ones (Nuzzo and Quarta 2010) and for this reason, we have employed a high-frequency antenna, to enlarge the curvature ray of the probed surface with respect to the central wavelength. Even though all the columns were probed, here we show the results relative to only two of them for sake of brevity. The other ones show the same main features.
Figure 8 shows the whole processed data set gathered on column CL1 (whose position is indicated in the little map, also reported within Fig. 8). Figure 8 also shows the ultrasonic velocity profile (which is the dashed graph on the right-hand side of the column) as well as both a linear GPR scan gathered on one side of the column and seven circular scans gathered around it (at seven different altitudes). The circular scans were ‘twisted’ according to the procedure explained in Masini et al. (2010). It is possible to note a good match between the zones with low ultrasonic velocity values (equal to around 2200 m/s) and those showing electromagnetic anomalies at a height of about 60 cm. This enforces the hypothesis that these anomalies are to be ascribed to an internal high alteration degree or presence of fractures. Another interesting feature is the absence of a strong reflection close to the joint of the column with the capital. Usually, an anomaly in this position is expected, due to a metallic hinge between the column and the capital. In the case at hand, it seems that the capital is not hinged in this way to the column. This is probable, because certainly the columns were inserted after the ‘excavation’ of the church and quite probably for aesthetical rather than structural purposes.
We can also note small localized anomalies in the circular scans R7, R11 and R13 (the labelling is consistent with other circular scans performed on other columns), in correspondence with the alleged fractured or damaged zones.
Figure 9 represents quantities analogous to those represented in Fig. 8, with reference to column CL6 (whose position is indicated in the little map, also reported within Fig. 9). The analogy is to be meant mutatis mutandis, because column CL6 is a pillar with a rectangular cross-section, whereas column CL1 has a circular cross-section. In particular, the images of the horizontal cross-sections are achieved by moving the antennas all around the column with regard to Fig. 8, whereas they correspond to a horizontal scan along one of the four faces in the case of Fig. 9. Specifically, Fig. 9 shows the processed data set gathered on the column with a graph of the ultrasonic velocity. Again, the lowest ultrasonic velocity is toward the top of the column and coincides with the position of some internal anomalies, probably ascribable to micro-fractures or to conservation problems.
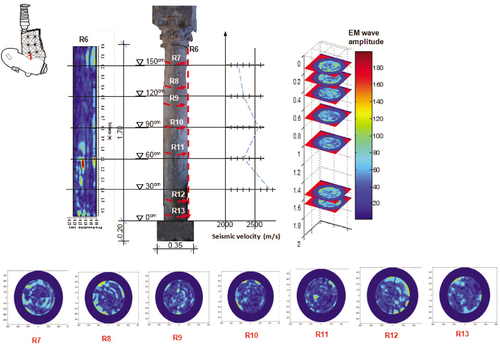
Investigation of column CL1. In the upper part of the image, from the left to the right-hand side: position of the column within the plan of the crypt, GPR image of a vertical cross-section of the column, photograph of the column, graph of the ultrasonic velocities, prospective visualization of the horizontal cross-sections achieved from GPR data, colour scale of all the GPR images. In the lower part of the image: the horizontal cross-sections achieved from the GPR data.
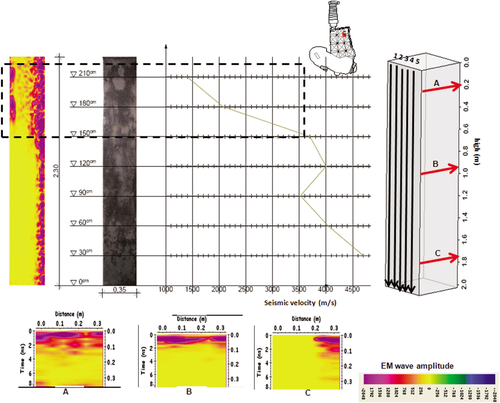
Investigation of column CL6. In the upper part of the image, from the left to the right-hand side: GPR image of a vertical cross-section of the pillar, photograph of the pillar, graph of the ultrasonic velocities, position of the pillar within the plan of the crypt, scheme of the GPR measurements on the pillar. In the lower part of the image: the horizontal cross-sections achieved from the GPR data and the colour scale of all the GPR images.
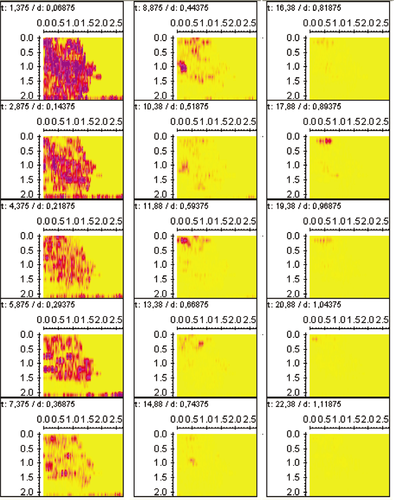
Depth slices in wall w of the crypt.
Finally, part of the wall of the presbytery was investigated by the GPR method (see the position indicated by label ‘w’ in Fig. 2). This wall shows some fractures and also a strong presence of humidity visible on it, as well as evident swelling. This was alleged to compromise the stability of the crypt. The GPR prospecting was performed with the same GPR system, equipped with an antenna at 900 MHz to assure a deeper penetration with respect to the 2 GHz antennas exploited on the columns. The antenna was equipped with an odometer and the resulting spatial step was about 0.64 cm. We recorded 12 parallel (horizontal) profiles along the wall, starting from the level of the floor, with a separation of 15 cm from each other.
In Fig. 10 some depth slices of the prospected wall are reported. First of all, the strong difference between the left-hand side and the right-hand side of the images is due to the different underlying medium, which is an artificial wall on the left-hand side and natural rock on the right-hand side. On the basis of these results, we have worked out that in correspondence to this wall, there was the ancient entrance of the crypt, placed on the opposite side with respect to the current one. Actually, the apse on the left-hand side of the wall (see Fig. 2) is also a built structure, i.e., not excavated in the rock and so it is successive to the closure of the ancient door. This was confirmed by a visual inspection from outside. The ancient entrance was probably walled-up during the 20th century (but we do not know the precise date) and on its external side the wall is partially covered with soil. Moreover, we interpret the high amplitude anomalies in the left-hand part of the image as probably due to the deterioration of the wall and cracking of the stone ashlars. Such a bad state of conservation could have been caused (or at least made worse) by the pressure of the soil behind the wall and by the seepage of water.
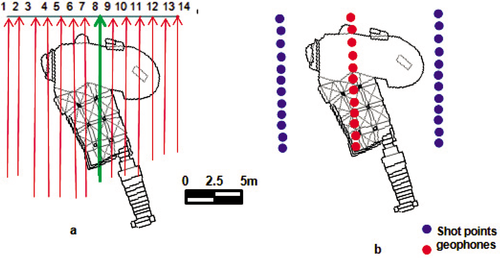
Map of the GPR (panel a) and the seismic (panel b) scans achieved on top of the crypt.

One of the GPR scans on top of the crypt (green arrow in Fig. 13a).

Seismic scan on top of the crypt.
Thus, the wall is actually damaged but, being just the closure of an ancient aperture, this does not influence the stability of the crypt. Notwithstanding, the fall of this wall is definitely a possible event and could be dangerous in itself. Moreover, such a collapse would cause the loss of some paintings depicted on it, currently covered by a thick layer of white lime wash.
EXTERNAL PROSPECTING
In this section we show some results achieved from GPR and seismic prospection performed above the vault of the crypt. The purpose of this prospecting was to investigate possible fractures in the ceiling of the crypt. The GPR data were acquired by both 200 MHz and 600 MHz antennas. Seismic data were acquired using a Geode Ultra-Light Exploration Seismograph with 12 geophones (14 Hz) at 1.3 m intervals. Twelve shot points were exploited at 1.3 m intervals using a 5 kg hammer.
In Fig. 11, the map of the GPR scans is shown, superposed to the plan of the underlying crypt. The results of the scans are all similar, so here we show just one of them. In particular, in Fig. 12, the result corresponding to the green arrow in Fig. 11(a) is shown. The processing applied consisted just of a zero timing and muting of the air-soil interface reflection. Even so, the data allow us to identify the ceiling of the crypt and (above all) they do not show any particular anomaly beyond a first layer, corresponding to the grass and to a superficial layer of terrain. So, the rock seems quite homogeneous. Finally, in Fig. 13, the result of the seismic section is shown too. The results of Fig. 13 are in good agreement with those of Fig. 12 and do not show any particular anomaly in the bedrock.
CONCLUSIONS
In this paper the results of a non-invasive prospecting (GPR, ultrasonic and seismic) regarding the Crypt of the Holy Spirit in Monopoli have been shown. GPR prospecting was performed with different antennas, depending on the kind of probed structure (wall, columns, floor). This non-invasive prospecting was part of a larger work, including some slightly invasive analyses and a laser scan of the crypt, performed by the Institute for Archaeological and Monumental Heritage and preparatory for a restoration project of the crypt.
The multi-sensor approach has enforced the reliability of the diagnosis and has also partially counteracted the effects of the approximations involved in each method, e.g., the fact that the ultrasonic data show a lower sound propagation velocity in correspondence with anomalies revealed by the GPR technique on the columns, makes us confident that these anomalies are probably due to some deterioration of the stone structure of the column, even if the curvature of the column might somehow deliver distorted images of those anomalies. Moreover, the seismic probing of the vaults does not show at all the same resolution of GPR prospecting but provides a parameter (the average propagation velocity) directly related to the quality of the rock in terms of the static of the edifice, which is impossible to work out from the GPR data.
The data suggest that some anomalies are present below the crypt, at least partially ascribable to objects of archaeological interest. The bedrock seems homogeneous and in good state but fractures seem to be present in the columns and in part of the wall. Neither the columns nor the fractured wall are bearing structures but the collapse of the wall is a possible and dangerous event in itself.


