Ground-penetrating radar and microwave tomography to evaluate the crack and joint geometry in historical buildings: some examples from Chania, Crete, Greece
ABSTRACT
Diagnostics of historical buildings is crucial for the definition of a reliable restoration project or in the study of the seismic behaviour of a building. This was one of the objectives of the international project ‘Advanced techniques for Seismic RISK Reduction in Mediterranean Archipelago Regions’ (SE RISK). In particular, in the framework of the project, the present work is concerned with the exploitation of GPR for the inspection of two historical buildings of Crete Island, Greece, the Prefecture of Chania and Venizelo’s House. In particular, the surveys aim at gaining information about the structure of the floors fracture areas and structural joint zones via high-resolution measurements thanks to the use of a 1500 MHz nominal centre frequency antenna. With regard to the Prefecture of Chania, the specific aim of the survey was to detect and localize fracture areas and joint zones thanks to a scanning line acquired orthogonally to the ‘defects visible’ at the surface of the floors. In Venizelo’s House, the aim was to detect and localize fracture areas in the stone masonry.
Besides the classical time data processing, a microwave tomography based approach was applied to the data. The comparison between the two approaches has shown that the results of both the procedures are in good agreement suggesting both the reliability of the standard processing routine and the new microwave approach. In addition, the microwave tomographic approach provides more detailed and higher resolution images allowing an easier data interpretation. The microwave tomographic approach also offers the advantage of performing an automatic procedure, thus mitigating the risk of introducing subjective elements as in the case of the classical approach.
INTRODUCTION
Historical buildings are a particular case of cultural heritage because they represent both a testimony of historical and cultural identity of a community and a civil infrastructure with a clearly specific function (museum, government offices, etc.).
One of the objectives of the international project ‘Advanced Techniques for Seismic RISK Reduction in Mediterranean Archipelago Regions’ (SE RISK) was the diagnostics of historical buildings that is crucial for the planning of a reliable restoration project and the analysis of the seismic behaviour of a building. This is a very hard task because historical buildings show two prominent features that make it difficult to understand their actual structural status. First, they often are affected by cracks in the floors and walls due to the natural sinking of the ground. Also, if the structure is located in a seismic area, it has been subjected to successive and partial reconstructions thus determining great structural complexity and in some cases a lack of information about the geometry and composition of the inner part of the structure. In addition, with regard to the seismic risk, it is important not only to ensure the preservation status of the building but also to keep its functionality and reduce its vulnerability.
In this framework, here we describe an analysis based on ground-penetrating radar (GPR) surveys concerned with two historical buildings of Crete Island (Fig. 1): the Prefecture of Chania and Venizelo’s House, where the aim is detecting and locating areas intersected by fractures and weakness zones.
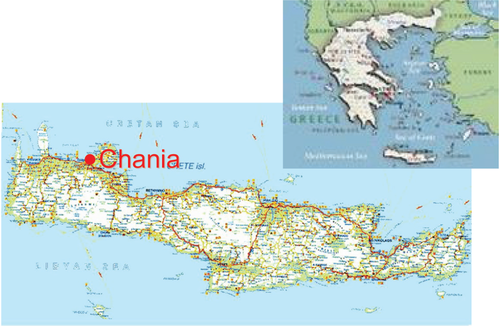
Location of studied areas.
In fact, the presence of visible fractures in the floors and walls of both historical buildings was an indicator of their deterioration status, which has to be taken very seriously into account in the considered area affected by a high seismic risk. Crack detection is an important issue in the field of non-destructive testing. Several techniques can be employed in order to check, localize and characterize fractures in manmade buildings: ultrasonic shear waves (De La Haza et al. 2008), elastic waves (Ohtsu et al. 2008), GPR (Utsi et al. 2008).
The GPR technique is a well-known tool for detecting cavities (Loperte et al. 2004), metal and plastic pipelines, cables, archaeological finds (Bavusi et al. 2009) and for the study of bedrock stratigraphy (Lazzari et al. 2006), groundwater and pollution (Chianese et al. 2005).
Moreover, when high frequencies (1–2 GHz) are used GPR represents a suitable tool for civil engineering diagnostics applications as a non-destructive testing of structures (McCann and Forde 2001). The use of GPR is now a standard practice in historical building diagnostics in order to have information about constructive details and defects (Binda et al. 2008; Cameron et al. 2008); however, the crack detection is a very hard issue requiring the exploitation of all spatial resolution available in the frequency range used. Under appropriate conditions GPR can be exploited for the detection and characterization of areas intersected by fractures. Indeed, fractures filled by air, water or a material different from the host medium appear as discontinuities in the electromagnetic properties and thus they arise a back-scattered field (Grandjean and Gourry 1996). In addition, the capability of GPR in detecting a fracture depends on the relative location and geometry of the fracture with respect to the survey line (Tsoflias et al. 2004) as well as on the exploited work frequency bandwidth. For a vertically oriented fracture, a reflection hyperbola arises due to the bottom of the fracture and to each change in the direction of the fracture with respect to the vertical path (Forest and Utsi 2004). By exploiting this property, it is theoretically possible to detect a fracture by using a common GPR dipole antenna, even the use of specifically designed high vertical resolution antennas is very helpful (Forest and Utsi 2004; Utsi et al. 2008).
Moreover, data processing plays a fundamental role to improve the ‘imaging’ and the focusing of the buried reflectors (Grandjean and Gourry 1996; Leucci et al. 2007).
The classical time-domain approach allows to achieve imaging and a focusing enhancement but it exhibits the drawback that a large number of processing steps are required and this may arise the risk of introducing subjective elements in data processing strictly related to the operator’s expertise. Also, in the classical data processing, the adoption of a rough model of the electromagnetic scattering is performed and this affects the results in terms of imaging the targets (Soldovieri and Solimene 2010).
In the last years microwave tomography approaches have been gaining increasing interest (Soldovieri et al. 2007; Soldovieri and Solimene 2010; Piscitelli et al. 2007; Leucci et al. 2007). Microwave tomography approaches face an inverse scattering problem (Soldovieri et al. 2007; Leone and Soldovieri 2003) and are able to accurately take into account the phenomenon of the electromagnetic scattering at the basis of the remote sensing procedure. In this paper, in order to alleviate the mathematical difficulties of this inverse problem, a linearized electromagnetic scattering model is used, based on the Born approximation (Soldovieri et al. 2007, Leone and Soldovieri 2003). Under the Born approximation, a linear inverse problem is formulated thus allowing some advantages: the inversion problem can be easily regularized and the problem of false solutions avoided because the relevant cost function exhibits a unique minimum (Soldovieri and Solimene 2010). The use of a linear model for the electromagnetic scattering has permitted to develop a practical inversion algorithm for applications where the aim is at performing a qualitative (localization and geometry of the targets) reconstruction of large domains in a fast way, as usually required for the cultural heritage and civil engineering diagnostics and archaeology prospecting.
In this work, both classical and microwave tomography processing were carried out on the same data sets with the aim of enhancing the spatial resolution and evaluating the performances of two processing approaches in the detection and characterization of areas interested by fractures in ancient buildings. Thanks to the combination of high-frequency GPR measurements and the microwave tomography processing approach, it is possible to obtain a fast tool for the non intrusive high-resolution diagnostic of historical buildings.
In fact, the use of the microwave tomography algorithm allows an efficient exploitation of the entire work frequency band but ensuring at the same time the stability of the images with respect to the noise and data uncertainties. Moreover, the microwave tomography approach drives to an automatic procedure thus making very low the risk of introducing subjective elements in the data processing chain. In addition, the microwave tomography approach is able to provide results in a very fast way and so it is suitable for processing a large amount of data when the features of the background scenario and the measurement configuration do not change.
Therefore, the paper is organized as follows. In the section ‘Microwave tomography approach based on the Born approximation’ a brief description of the theoretical principles of the microwave tomography is provided. The section ‘The case of the Prefecture of Chania’ deals with the GPR survey carried out in the historical building of the Prefecture of Chania and presents a comparison between the results achieved by the two approaches. The results point out clearly the improvement in terms of spatial resolution achieved by using the microwave tomography approach. The section ‘The case of Venizelo’s House’ presents a similar analysis related to the GPR survey performed in the correspondence of some fractures in the dry-stone walls of Venizelo’s House. Different from previous examples, dry-stone walls are a medium very hard to investigate by GPR, due to the presence of a large number of scatterers represented by the stones. The section ‘Conclusions’ deals with conclusive considerations about the performance of the two processing methods.
THE MICROWAVE TOMOGRAPHY APPROACH BASED ON THE BORN APPROXIMATION
The microwave tomographic approach based on the Born approximation has already been presented in many papers (Leone and Soldovieri 2003; Soldovieri et al. 2007), here the approach is briefly recalled. The geometry of the problem is presented in Fig. 2 and is concerned with a half-space homogeneous scenario and two-dimensional geometry. The adopted measurement configuration is usually the multi-monostatic/ multi-frequency one.

Geometry of the inverse scattering problem.
The scattered field is given as the ‘difference’ between the total field and the unperturbed field  . The total field is the field reflected by the soil when buried objects are present, whereas the unperturbed field is the field reflected by the soil when the objects are absent and, therefore, it accounts for reflection/transmission at the air/soil interface.
The targets are invariant along the  -axis and their cross-section is assumed to be included in a rectangular investigation domain
  . The unknowns of the problem are the relative dielectric permittivity profile and the conductivity profile inside
  .
.
 (1)
(1) that accounts for the relative difference between the equivalent dielectric permittivity of the objects
  and the one of the embedding medium
  :
:
 (2)
(2) is Green’s function,
  is the incident field and
  is the wavenumber of the investigated medium (Leone and Soldovieri 2003).
The linear integral relation is inverted by means of the singular value decomposition (SVD) tool that allows to achieve a stable solution (Bertero and Boccacci 1998). Finally, the result of the reconstruction is represented as the spatial map of the modulus of the SVD-recovered contrast function within the region under investigation.
Figure 3 summarizes and sketches the overall processing chain to obtain the microwave tomographic reconstruction starting from raw data.
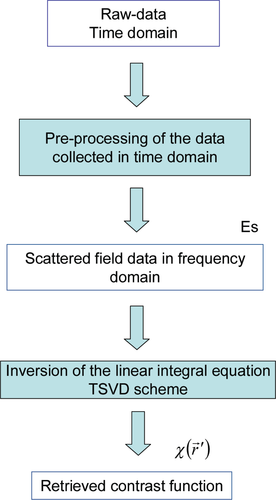
Main steps of the microwave tomography approach.
THE CASE OF THE PREFECTURE OF CHANIA
The background and the survey
The edifice of the Prefecture of Chania represents a significant example of Turkish architecture. It has a quadrangular shape in plan view and consists in four office buildings about 60 m long and linked at a right angle to form an internal courtyard (see Figs 4 and 5a). The office buildings have two floors, with the exception of the northern one, corresponding to the main entrance, which has a third floor in reinforced concrete added in modern times. Moreover, the southern and part of the eastern and western edifice have two floors due to the rising of the ground level towards the south, so that the first floor became a ground floor.
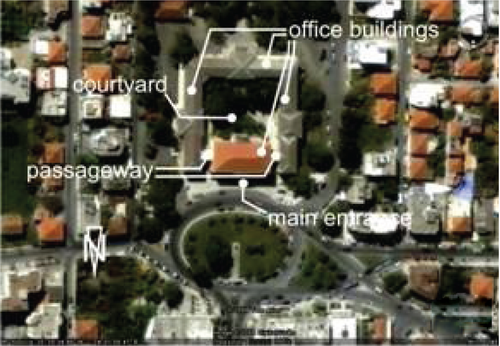
Plan view of the building of Prefecture of Chania.
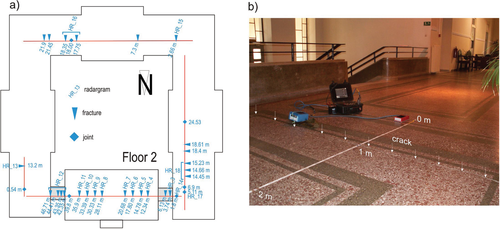
a) Plan of the 2nd floor with fractures and radargrams locations. b) Example of a survey line across a fracture in the floor (highlighted by triangles).
The northern office building is linked to the eastern and western ones at the level of the second floor by two passageways hanging on arches. Along its corridors, several transversal fractures are visible on the floor (Fig. 5b), due probably to the several earth quakes affecting Crete island. In addition, some differences in the floor structure (joints) are indicative of the fact that the edifice was affected by restoration and reinforcement interventions.
A GPR survey was performed mostly at several corridors of the second floor (Fig. 5a). Along the main axis of each investigated corridor, several high-frequency GPR surveys were carried out across the visible fractures and joints. Survey lines, generally 2 m long, were arranged so that the visible fracture was located at the centre of the survey lines, at 1 m (Fig. 5b).
A GSSI SIR 2000 system equipped with a nominal 1.5 MHz peak frequency and a zero- offset antenna was used. The system was set as follows: 32 scans/s, 512 samples/scan, 16 bit/sample. Since the system was not provided an encoder, 10 cm spaced markers have been electronically put in the data by using a common metric tape rule.
Data processing and results
All radargrams were processed by using both a classical processing routine and the microwave tomographic approach and here we present the most interesting reconstruction results.
Classical processing routine
The classical processing involved several steps. The raw data are made up of 445 traces and 512 time-samples (see Fig. 6a).
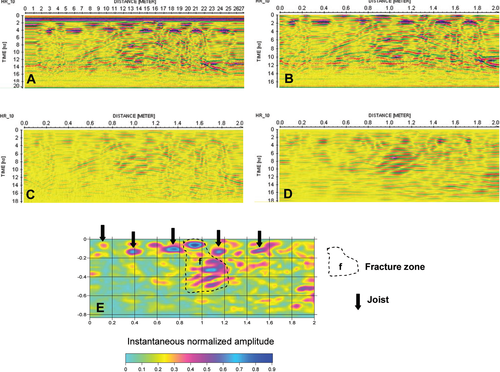
Classical processing routine applied on radargram HR 10 acquired in the Prefecture of Chania.
- trace removal having the aim of erasing the first and last part of the B-scan acquired when the antenna is not moving;
- distance normalization with a re-sampling at 401 traces spaced by 0.005 m; this latter operation was needed to compensate the inconstant velocity of the antenna movement along the scan.
After a static correction of 1.3 ns was performed to correct time zero (Fig. 6b) and gain removal was carried out in order to restore raw data without field gain.
Energy decay function has been applied in order to compensate geometrical spreading and attenuation.
Band-pass frequency filter was set between 500–2000 MHz and a background removal filter (Fig. 6c) was performed (Hugenschmidt and Mastrangelo 2006).
Successively, the hyperbola adaptation was performed and an average velocity em equal to 0.09 m/ns was obtained. Few unexpected em velocity variations were observed and this was probably due to a non-uniform antenna dragging whereas the distance normalization procedure was used to achieve a uniform measurement spatial step. Therefore, after the distance normalization procedure, the hyperbolas in the areas gathered with a larger dragging velocity will result in being more open and then associated to a faster em velocity. On the other hand, the hyperbolas in the areas gathered with smaller dragging velocity will appear narrower and then associated to a slower em velocity.
The average em velocity (equal to 0.09 m/s) was used in the Kirchhoff migration (Fig. 6d) and finally, the radargram was provided in terms of absolute value of the instantaneous amplitude of the processed signal, which is a representation of the reflectivity intensity (Fig. 6e).
With reference to Fig. 6(e), the most significant elements are represented by some targets at a depth of about 0.1 m, located at 0.1 m, 0.4 m, 0.75 m, 1.15 m and 1.47 m along the  -axis (indicated by arrows in Fig. 6e); these reflections are representative of the cross-section of the reinforcement crossbar under the flooring. A second important element is represented by a high reflection zone between the abscissas 0.8–1.3 m that appears as being made up of several sloping reflectors that can be referred to as a fracture system (denoted by f in Fig. 6e). It is worth noting that this area is located in correspondence of the fracture visible on the floor at about 1.0 m; therefore, the highly scattering objects could be related to the presence of an area interested by the fracture.
Figure 7 shows radargrams HR8, HR9 and HR11 acquired along the same corridor considered in the previous case (Fig. 5a) and processed by following the same modalities presented above for the raw data HR10.
The radargram HR8 (upper panel of Fig. 7) presents at 0.2 m of depth a series of five bright spots at 0.25 m, 0.5 m, 0.7 m, 1.25 m and 1.55 m along the  -axis that can be related to the joists of the floor. A sixth bright spot at 1.8 m is not clearly visible. Moreover, in the central zone of the radargram, corresponding to the location of the visible fracture, a buried high reflection area is present.
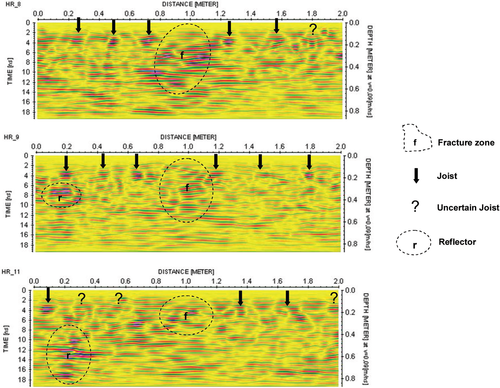
Radargrams HR8, HR9 and HR11 acquired and processed as well as radargram HR10 up to the migration step.
Radargram HR9 (middle panel of Fig. 7) shows the same scenario with a similar series of bright spots related to the joists at 0.2 m, 0.45 m, 0.65 m, 1.15 m, 1.47 m and 1.78 m along the  -axis. Moreover, in the central zone related to the fracture, a reflective area is present. A new bright spot, indicated by ‘r’ at the point
  could be associated to a pipe or a cabling presence.
Finally, in radargram HR11 (lower panel of Fig. 7) it is possible to reconstruct the same situation with the joists, fracture and pipe reflections but the radargram results are more difficult to be interpreted compared to the previous ones.
Note that for all the presented radargrams a fracture zone is located in correspondence of a zone where the lack of a joist arises.
As matter of fact, the classical processing approach allowed to detect the joist structure and the fracture zones related to each investigated portion of the floor. In particular, there seems to be a relationship between the fracture presence and the lack of a joist in the central zone of the radargram but the uncertainties in the clear detection and characterization of the joists did not make it possible to confirm at all this interpretation. In fact, missing joists could be due to the energy decay function that can mitigate the reflectors coming from the targets close to the surface.
Microwave tomography approach
In order to improve the interpretability of the radargrams by exploiting all spatial resolution available in the data, previous radargrams were processed by using the microwave tomography algorithm.
In particular, for the case at hand, the inversion algorithm (working in the frequency domain) exploits frequencies in the band ranging from 80–1600 MHz at a step of 50 MHz. The measurement points are equally spaced by 1 cm. Microwave tomography reconstruction for the raw data HR_10 is shown in Fig. 8(b) and is compared with the result of the classical processing approach showed again in Fig. 8(a). Figure 8(b) is the reconstruction achieved by the microwave tomography in terms of the normalized modulus of the contrast function.
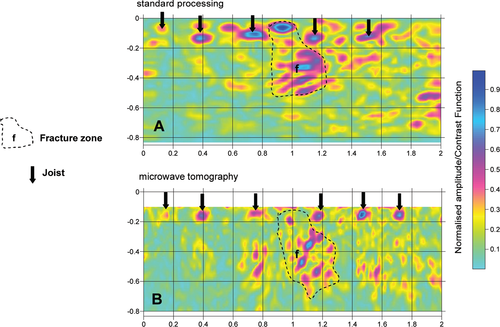
Comparison between classic and microwave tomography processing carried out on radargram HR_10. a) Classic time domain processing and b) frequency domain microwave tomography processing.
Both the processing results permit to detect localized scatterers at a depth of about 0.1 m at 0.1 m, 0.4 m, 0.75 m, 1.15 m and 1.47 m along the  -axis but the microwave tomography processing is now able to detect and resolve the scatterer at 1.72 m. Also, the microwave tomography based approach achieves a better resolution in locating these scatterers.
The reflective zone associated to the visible fracture appears more defined in the microwave tomography result and the geometry describing deep sloping objects is in good agreement with the possible geometry of a sub-vertical fracture. Note the same reflectors in the classical processed data are detected and reconstructed with a worse resolution (between 0.8–1.3 m along  ).
).
To confirm the relationship between the presence of the fracture and the ‘absence’ of a joist in the central zone of the radargrams a reduction of uncertainties in the data interpretation is needed and the best performances in terms of spatial resolution of the microwave tomography inversion revealed an effective tool to comply with this necessity.
Figure 9 shows the microwave tomography inversions carried out on radargrams HR8, HR9 and HR11. The tomographic reconstruction relative to radargram HR8 (upper panel of Fig. 9) shows six bright spots at a depth of about 0.2 m that are correlated to the presence of joists. Note, as well as for radargram HR10 in Fig. 6, the microwave tomography is also able to detect the last joist at 0.8 m along x compared to the classical processing (compare with radargram HR8 in Fig.7). The fracture zone, which falls in correspondence of the central ‘missing joist’, shows some chaotic variations in the contrast function.
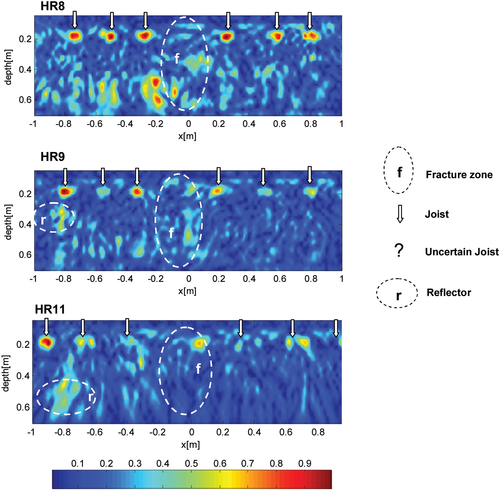
Microwave tomography inversion carried out on radargrams HR8, HR9 and HR11.
The tomographic reconstruction relative to radargram HR 9 (middle panel of Fig. 9) permits to detect all the elements resolved in classical processing (compare with radargram HR9 in Fig. 7). Moreover, the fracture zone appears well-defined and the geometries of the variations of the contrast function can be interpreted as the presence of a sub-vertical fracture. Microwave tomography is able to detect the element at  and
and  but its shape is less clear and more complex than in the classical processing result where it has been interpreted as a pipe or cabling (compare with HR9 in Fig. 7 at
  and
and  ).
).
Finally, in the lower panel of Fig. 9 the tomographic reconstruction relative to radargram HR11 is reported. Despite a degree of uncertainty, the microwave tomography inversion improves the interpretability of the data with respect to the classical processing result (compare with radargram HR11 in Fig. 7). In fact, the clear interpretation of the joists in the classical processing data was possible due to the experience of the operator. On the contrary, the microwave tomography inverted radargram is more interpretable too by a non-expert operator.
Finally, Fig. 10 shows the microwave tomography inversions performed on radargrams HR3, HR5, HR6 and HR7 collected at another zone of the floor (see Fig. 5a). In these radargrams the joist structure appears less defined than the previous data sets but it is possible to detect in radargrams HR4 HR5 and HR7 the same sequence of reflectors connected to the joists, with the ‘missing joist’ at the centre of the diagrams where the fracture zone arises. This appears well-defined, with vertical reflectors in radargrams HR4, HR6 and HR7. Radargram HR5 shows a central zone with low values of contrast function. This evidence could be interpreted as the presence of a very narrow fracture that does not produce a significant reflection.
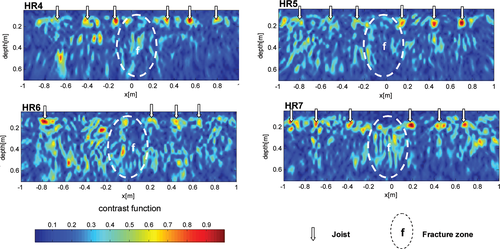
Microwave tomography inversion carried out on radargrams HR4, HR5, HR6 and HR7.
THE CASE OF VENIZELO’S HOUSE
Here, we present the reconstruction results for some data sets collected at Venizelo’s House.
Background and survey
Venizelos House is very important in Greek history, since it is the place where the revolutionary patriot Eleftherios Venizelos (1864–1936), prime minister and the ‘maker of modern Greece’, lived (Fig. 11). This edifice, which now is a museum and holds an enormous historical and symbolic value for Greece, shows fractures in its walls made up of cemented irregular stones (Fig.11).
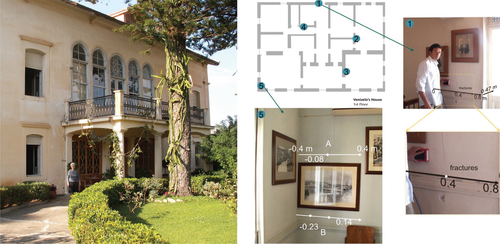
Venizelo’s House with the location of the main fractures in the walls of the first floor and survey design of radargrams of sites nos 1 and 5.
Several radargrams were acquired across the fractures in the walls by using the GSSI SIR 2000 unit with a nominal peak frequency antenna of 1500 MHz. The system was set as follows: 32 scans/s, 512 samples/scan, 16bit/sample. Markers were set at 0.1 m. The position of the fractures on the survey lines was noted.
Data processing and results
Classical processing routine
The raw data gathered at Venizelo’s House were processed according to the procedure mentioned above for the Prefecture of Chania. Slight differences were adopted in the processing chain; in particular, application of subtracting average and  filtering were performed in replacement of background removal and band-pass frequency filters, respectively. Velocity analysis provided a value of 0.125 m/ns used for the migration.
Figure 12(a) shows the processed radargram acquired at site 1 of Fig. 11. Several reflections appear in the investigated area but it is not possible to relate the reflections to the fracture zone. At 0.5 m of depth a flat reflector is clearly detected and is related to the opposite surface of the wall.
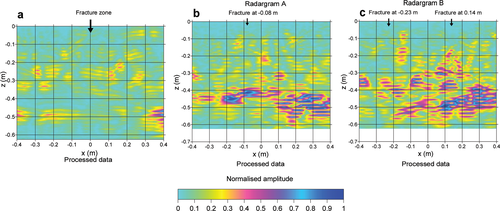
Figure 12(b,c) respectively shows processed radargrams A and B gathered at site no. 5 of Fig. 11. Some discontinuities are visible in the data but still it is very difficult to individuate reflections related to the fractures. On the contrary, the opposite surface of the wall is well-defined by several flat reflections at depth of about 0.4–0.5 m.
Microwave tomography approach
The Venizelo’s House data sets were also inverted by using the shows approach. Figure 13(a) shows the inverted radargram acquired at site 1. A lot of small reflectors appear in all investigated volumes, while some strong reflectors related to the opposite side of the wall appear at 0.5 m of depth. Some weak reflectors describing steep slope structures are detected in correspondence of the visible fracture zone but they are not fully interpretable at the presence of other scatterers.
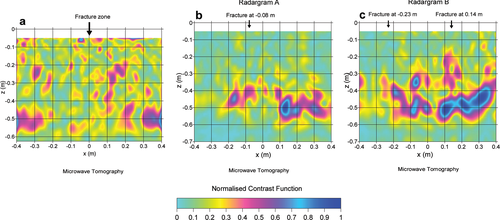
A similar situation is depicted in Fig.13(b,c) that is relative to the inverted radargrams A and B of Fig. 11. Several scatterers are detected in all the investigated area and the fracture zones appear weakly perturbed.
- the investigated dry-stone walls have a rough structure formed by small pebbles held together by mortar (Fig. 14). The faceted surfaces of the stones are electromagnetically strong scatterers. Moreover, it is reasonable that such a structure could contain some voids due to its intrinsic structure. Unfortunately the stone surfaces and possible voids generate, in the frequency range used, reflections stronger than those generated by the cracks. Also, the presence of many scattering objects in the investigated area arises mutual electromagnetic interactions between the targets that are not accounted for by the Born model. This reflects negatively on tomographic reconstruction results in terms of artefacts in the image.
- the opposite side of the wall generates strong reflections that cause a dynamic range problem. These reflections are prominent with respect to the others representing the target and no gain function can adequately solve this problem. On the contrary, the use of specific antennas designed for vertical fracture detection, having great vertical resolution, can improve the signal coming from the fracture mitigating at the same time as the contribution coming from the opposite side of the wall (Forest and Utsi 2004; Utsi et al. 2008).
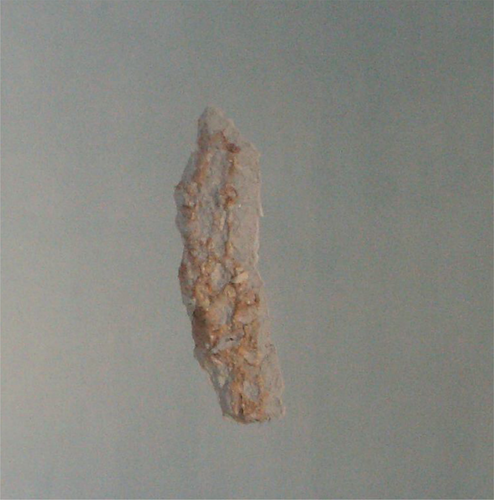
Internal structure of the dry-stone wall outcropping through damage in the plaster.
CONCLUSIONS
In two historical buildings of Crete Island, the Prefecture of Chania and Venizelo’s House, a high- frequency (1.5 GHz) GPR survey was carried out to characterize some fractures visible in the floors and in the walls, respectively. To enhance the imaging and achieve better focusing of the reflections, a laborious classical time-processing formed by several steps was needed for the data of both the sites.
To overcome problems related to the time-consuming processing procedures and the subjectiveness of the operator, an advanced frequency domain processing, based on microwave tomography, was carried out on a high-frequency radargram and compared with the classical processed data.
For the data sets gathered at the Prefecture of Chania it is possible to declare that the fractures are associated to a succession of bright spots compatible with a fracture system including voids. The two processing procedures are in agreement with each other, suggesting both the goodness of the standard processing routine and of the microwave approach. Moreover, the microwave tomography based approach allows to achieve more detailed and higher resolution images, simplifying the interpretation of the image.
With regard to Venizelo’s House, the specific dry-stone wall structure formed by faceted stones and voids makes it difficult to distinguish the reflections related to the fractures from the ones arisen by the other targets. However, in this case also the classical processing approach is consistent with the microwave tomography result suggesting the goodness of the microwave tomography processing approach.
ACKNOWLEDGEMENTS
This work was financed by the international project ‘Advanced techniques for Seismic RISK Reduction in Mediterranean Archipelago Regions’ (SE RISK).


