An integrated geophysical study of the western part of the Rochechouart-Chassenon impact structure, Charente, France
ABSTRACT
A multi-method geophysical survey was carried out with the aim of reassessing the structure of the Rochechouart-Chassenon astrobleme and the geometry of the impact-related formations, referred to as fallout breccias, in the vicinity of Chassenon. Gravity data extracted from the BRGM InfoTerre database were reprocessed and revealed both the shape of the astrobleme and the presence of a small negative gravity anomaly close to Chassenon, due to the low density of impact-related rocks; a 2D gravity model across the fallout deposits was provided. Geological settings, well-logging and geophysical soundings (direct current (DC), time-domain electromagnetic (TDEM) and frequency-domain electromagnetic (FDEM)) were carried out on the fallout breccias at Chassenon. The 1D resistivity models based on TDEM and DC soundings, resulting from a mutually constrained inversion and coupled with 1D models of FDEM data, were constrained by borehole data and provided 2D resistivity models across the fallout deposits of Chassenon. The combination of these methods allows the description of both the impact-related rocks geometry and the global structure of fallout breccia remains at Chassenon. The study also shows that the fallout breccia has a complex structure, consisting of thin layers of lithic breccia and suevite, the total thickness of which is larger at Chassenon than previously estimated by means of geological analysis.
INTRODUCTION
The Rochechouart-Chassenon impact structure, also referred to as an astrobleme, is located in the western part of the Massif Central region, France, at the administrative boundary between the departments of Charente and Haute-Vienne (Fig. 1). It was identified during the course of a comparative study between geological formations encountered at Rochechouart and meteoritic material located at the Riss impact crater in Germany (Kraut et al. 1969). Since that time, the Rochechouart-Chassenon astrobleme (RCA) has been the subject of numerous studies that have characterized its lateral extent (Lambert 1974; Pohl et al. 1978), the petrographic signatures of impactites (Kraut et al. 1969; Oskierski and Bischoff 1983; Reimold et al. 1984; Bischoff and Oskierski 1987), the chemical composition of the meteorite (Lambert 1975; Horn and El Goresy 1980; Tagle et al. 2003 1835; Koeberl et al. 2007) and its age (Pohl and Soffel 1971; Kraut and French 1971; Lambert 1974; Wagner and Storzer 1975; Reimold and Oskierski 1987; Kelley and Spray 1997). Laser spot fusion Ar-Ar dating of pseudotachylites from the Champagnac quarry (Fig. 1) yields a late Triassic age of  My (Kelley and Spray 1997). Nowadays, the crater is a deeply eroded structure with no impact-related topographic remains: the current topography corresponds to the crater floor. Based on early geophysical and structural studies, the reconstructed crater has been estimated to have a diameter of about 20 km (Lambert 1974; Pohl et al. 1978).
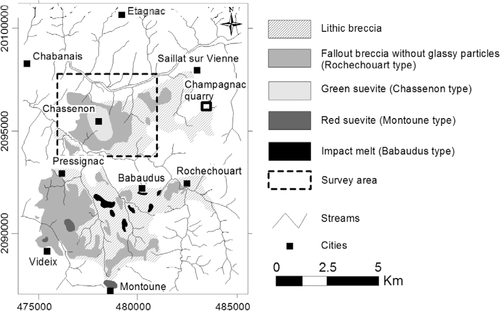
Simplified geological map of the Rochechouart-Chassenon impact structure (adapted from Chèvremont et al. 1996).
The impact structure is characterized by the occurrence of impact formation outcrops (Fig. 1), called breccias or impactites. Several geological maps have been drawn up (Kraut et al. 1969; Lambert 1974; Chèvremont et al. 1996). However, although the lateral extent of the impact structure and breccia outcrops is currently well-known, the stratigraphy and the geometry of the fallout breccias are rather poorly documented. In addition, no hydrological studies have been made in order to identify water bearing aquifers and their geometry, in the context of this highly fractured basement.
In the present paper, we place particular emphasis on the geophysical structure of the fallout breccia at Chassenon and briefly describe the hydrogeological characteristics of the fallout deposits.
SETTLEMENT AND BRECCIA CHARACTERISTICS
The current landscape of the RCA has an undulating hilly topography, which at Chassenon ranges between 150–250 m above sea level. The target rock, which consists of gneiss and granite of Hercynian age, was highly fractured by the meteoritic impact and significant brecciation has been observed (Lambert 1974) within a 10 km radius of the impact centre. The fractured basement rock is locally covered by fallout breccias (Fig. 1), which consist of shocked basement rock fragments cemented into a fine-grained clastic matrix with variably concentrated iron- and nickel-rich glassy inclusions; these deposits have been classified into three impact-related rock units, according to the shock intensity levels they experienced (Kraut et al. 1969; Lambert 1974). In increasing order of shock level, these units are: i) lithic breccia, so-called Rochechouart-type impactites, ii) green and red suevites, referred to as Chassenon-type impactites and Montoune-type impactites, respectively and iii) impact melts.
The three main outcrops of lithic breccias are located at Chassenon, Rochechouart and between Pressignac and Videix (Fig. 1). The few suevite outcrops, covering an area of less than 4 km2, correspond to the same material as that observed in lithic breccia, with the addition of melt inclusions. Petrographic analysis performed on impact melts, which consist of a mixture of lithic clasts and glassy matrices (Lambert 1977), should suggest these ones occurred at the centre of the crater, located in the region of Babaudus (Fig. 1).
According to Lambert (1974), Kraut et al. (1969) and Chèvremont et al. (1996), the fallout deposits at Chassenon comprise a lower lithic breccia unit and an upper green suevite unit (Fig. 1). The maximum thickness of the impactites should be less than 60 m, according to Lambert (1974) and approximately 50 m, according to Chèvremont et al. (1996).
GEOPHYSICAL AND GEOLOGICAL INVESTIGATIONS
Gravity data
The gravity data used in this study were extracted from the French gravity data base (Carte Gravimétrique de la France) and can be downloaded from the BRGM Infoterre website (http://infoterre.brgm.fr). The gravity survey was carried out in 1955, using a North American gravimeter with a nominal sensitivity of 0.15 mGal. The gravity data are distributed irregularly throughout the area of investigation, with an average spacing of about 500 m between gravity stations along each profile. Furthermore, 300 additional gravity measurements were carried out by Pohl et al. (1978), along two NS and EW profiles centred on the RCA. Among several results derived from regional processing, Pohl et al. (1978) obtained a minimum negative Bouguer anomaly of 9 mGals, which demonstrates both the location and the lateral extent of the impact structure. This negative anomaly also characterizes the mass deficiency typical of the impact structure (Campos-Enriquez et al. 1998). The provisional map produced by these authors also revealed two 1 mGal anomalies, close to the cities of Chassenon and Rochechouart, resulting from the presence of fallout breccia layers with densities less than those of granitic and gneissic bedrocks. This hypothesis has been confirmed by Lambolez (1971), who measured the average densities of lithic breccias, suevites and impact melts, evaluated at 2.54 g/cm3, 2.12 g/cm3 and 2.01 g/cm3, respectively.
In the case of the study reported here, as the additional data of Pohl et al. (1978) were not available for our analysis, updated Bouguer gravity anomalies were computed using the original Infoterre measurements referenced to the IGSN-1971 system. The mean quadratic error on the computed Bouguer anomaly is estimated to be approximately 0.18 mGal. We improved the Bouguer corrections by using a density of 2.6 g/cm3 (average density of granite and gneiss in the study area, Lambert 1974) and by including original terrain corrections computed at distances as far out as 167 km. The corrected data set is then regionally filtered. A residual Bouguer anomaly map of the RCA is obtained over a 500 m grid, by using kriging estimations (Fig. 2). The latter was estimated at 7 mGals; the low difference between our result and Pohl et al.’s findings (1978) partly results from the different gravity data sets used and the methodology applied for deriving the residual Bouguer anomaly.
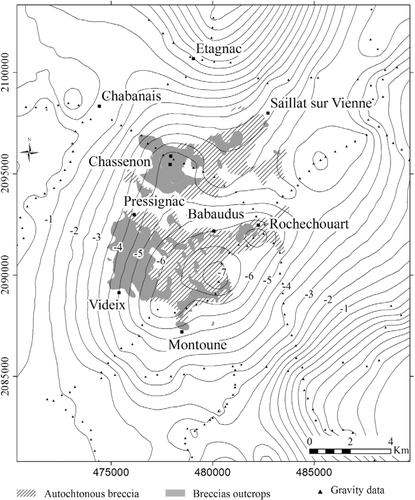
Residual Bouguer anomaly of the RCA after regional filtering, showing the extent of the astrobleme and the crater centre. Curves correspond to isovalues, given in mGal, of the residual Bouguer anomaly; the value interval between two consecutive curves is defined as 0.5 mGal. The RCA structure and mass deficiency are characterized by a –7 mGal minimum.
Direct current and time-domain electromagnetic soundings
A total of 45 direct-current (DC) resistivity soundings and 10 time-domain electromagnetic (TDEM) soundings were carried out at Chassenon (Fig. 3). The DC soundings were made using a SYSCAL R2 resistivity-meter (Iris Instruments), with a Schlumberger array configuration; the electrode half-spacings were expanded to a maximum distance of 500 m. To minimize the topographic effect in the DC sounding data, the orientation of the electrode array was always maintained perpendicular to the gentle slope. The TDEM soundings were carried out using Protem 47 equipment (Geonics Ltd) with a 40 m × 40 m transmitter loop and an equivalent 31.4 m2 receiver coil, in a central loop configuration. The secondary magnetic field was recorded over three time intervals, with specific repetition frequencies: from 7–700 μs at 237.5 Hz (ultra high segment), from 35 μs to 2.8 ms at 62.5 Hz (very high segment) and from 88 μs to 7 ms at 25 Hz (high segment).
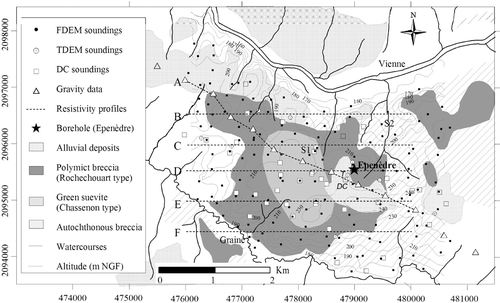
Simplified geological map (Chèvremont et al. 1996) showing the location of the DC, TDEM and FDEM soundings, BRGM Infoterre gravimetric stations and the 2D resistivity profiles (labelled A–F). Results of inversion of the FDEM sounding data located in S1 and S2 are reported in Fig. 6(a,b), respectively. Soundings labelled by letters  and
and  , located near to the Epenèdre borehole, respectively correspond to the TDEM and DC sounding data used for providing the 1D robust model shown in Fig. 4.
Processing of the noisy data resulting from the TDEM measurements was performed with SiTEM software and the inversion of both DC and TDEM data was achieved using a mutually constrained inversion (MCI) algorithm (Auken et al. 2001a,2001b), run with SEMDI software (Hydrogeophysics Group, Aarhus University, Denmark). The 1D-MCI procedure, which requires a starting model, allows the modelling of different but coincident data sets, such as DC and TDEM resistivity data and has the particularity of producing, through the optimization process, the same number of models as data sets, with a correlation between the models established through equality constraints between corresponding parameters. Introducing soft constraints between models allow slightly different models from different data sets to be fitted.
The inverse method provides measures of model resolution, expressed as a relative number, referred to as relative standard deviations (STD). A STD value of 1.00 indicates that the model resolution is perfect and a STD of 1.20 indicates an uncertainty of 20% in the resolved parameters. The latter are unresolved in the case of a STD greater than 2.
 at iteration
  , which is related to the model
  at iteration (i) by the generalized covariance (first term between brackets) and the data matrices (second term between brackets):
 (1)
(1)where  is the Jacobian matrix at iteration (i),
  is the data error covariance matrix,
  is the roughness matrix,
  is the covariance matrix of the constraints between model parameters,
  is the model parameter covariance matrix for the initial model
  ,
,  is the damping parameter,
  is the identity matrix,
  and
and  are the observed data and
  is the model response. Nevertheless, the quality of the final model parameter is still strongly dependent on the initial guess for the model
  .
.
Moreover, conflicting resistivity models calculated from TDEM and DC sounding data acquired in the same locality were reported by Christensen (2000). These ones traduce anisotropic or topographic effects on disturbed resistivity data. The MCI revealed to be a robust method for recovering useable model from inconsistent data (shifted resistivity data or data containing anisotropy) (Auken et al. 2001b): MCI inversions of TDEM and DC resistivity data, using shifted (by a factor of 1.2) and non-shifted DC sounding data produced insignificant differences between the models. So, even if orientations of DC soundings performed at Chassenon were parallel to contour lines in order to reduce topographic effects, the MCI method used in this study allowed the possible topographic and anisotropic distortion on resistivity data to be corrected and then 2D resistivity profiles to be provided.
FREQUENCY-DOMAIN ELECTROMAGNETIC SOUNDINGS
 is proportional to the imaginary part of the ratio of the secondary magnetic field to the primary one (Frischknecht et al. 1991):
 (2)
(2)where  and
and  are respectively the primary and secondary magnetic fields at the receiver coil location,
  is the angular frequency,
  is the free space magnetic permeability and
  is the intercoil spacing.
The 1D inverse modelling was carried out using the Qwem34 program (developed by UMR Sisyphe), which is based on the steepest descent algorithm for inversion and uses analytical forward modelling for the  -layer ground. The components of the magnetic field diffused in the soil and back into the air are expressed by Hankel’s transforms where the kernel can be calculated using a recurrence formula taking into account the thickness, the conductivity and the magnetic susceptibility of each layer. 1D models result from inversions of a conductivity data set acquired using VD and HD configurations.
The data set from the final model is converted into units of electrical resistivity so as to compare the DC, TDEM and FDEM models.
Borehole, cutting analysis and logging
A 69-m deep borehole was drilled at Epenèdre, located in the north-eastern part of the Chassenon breccias (NGF datum, Lambert II coordinates: Easting: 478994 m, Northing: 2095532 m, Fig. 3). The site of the well was selected from several candidate locations, where initial results from inverted DC and TDEM soundings with a MCI approach suggested the presence of a complex geological structure. During drilling, cuttings were sampled every 0.5 m. After drilling, four wired logs were carried out by the SEMM Logging Co., using calibrated tools. The three recorded data sets were electrical resistivity, magnetic susceptibility and natural gamma rays; an acoustic log using BHTV (Borehole Televiewer) equipment was also obtained for the visualization of fractures and discontinuities in the wall of the drilled hole (Zemanek et al. 1970). For electrical resistivity measurements, long and short normal probes were used, corresponding respectively to 64″ and 16″ pole-pole configurations. The measurement errors were approximately 0.2% of the electrical resistivity scale and the vertical resolution was approximately 5 cm. For magnetic susceptibility measurements, an EM probe was used with a 0.25 m spacing between transmitter and receiver coils. The vertical resolution was 5 cm and the resolution of the recordings was 2.10-6 SI. For natural radioactivity measurements, recorded in counts per second, the time constant was fixed at 2 sec and the logging speed at 2m/min. The resulting measurements have relative errors of approximately 0.2%.
RESULTS
- A gravity map of the RCA (BRGM InfoTerre database), showing the shape of the impact structure.
- A 1D model of the stratigraphic signatures of the Chassenon breccia, derived from well-log data. The latter was combined with DC and TDEM soundings made close to the borehole, thereby enabling a robust 1D resistivity model to be constructed using a Mutually Constrained Inversion (MCI). The latter was used as a starting model for the MCI of other TDEM and FDEM soundings and the inversion of the FDEM soundings.
- iii A 2D gravity model and a 2D resistivity model, covering a 4.5 km long northwest-southeast profile and traversing the impactites of Chassenon are provided. Five 2D east-west resistivity models were established over an 8 km2 area at Chassenon.
Preliminary 1D mutually constrained inversion results close to the Epenèdre borehole and discussion of the hydrological and geological indeterminations
Preliminary MCI inverse modelling was carried out using the DC and TDEM soundings made nearby the Epenèdre borehole, respectively labelled  and
and  in Fig. 3. The interpretated geological profile (Chèvremont et al. 1996) acquired from observation of impactite outcrops suggests a two-layered vertical structure at Epenèdre, comprised of lithic breccia (Rochechouart-type impactite) and highly fractured gneiss; the top of the gneissic layer should be situated at approximately 40 m below the surface in this locality.
The preliminary 1D MCI inverse modelling of DC and TDEM soundings shows that two different models can be used to describe the observed background structure at Epenèdre, with an rms (root-mean-square) of 4% in both cases. These models comprise (in the first case) four geo-electrical layers (Fig. 4b and Table 1a) and (in the second case) five geo-electrical layers (Fig. 4c and Table 1b). In Fig. 4(a) the apparent resistivity data from TDEM and DC soundings and fitted curves for the 5-layer model, are shown. The resolution of the model parameters (resistivity, thickness, depth) is expressed in relative values (STD) in Tables 1(a) and 1(b).
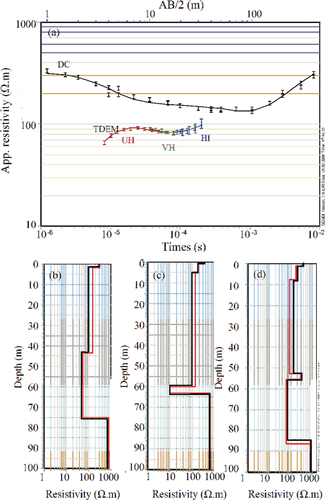
a) Representative apparent resistivity of TDEM and DC data with error bars and the layered model (rms of 4%) obtained at Epenèdre using mutually constrained inversion (case of a 5-layer model). The two models that could describe the terrain are: a 4-layer model (b) and a 5-layer model (c). The 1D resistivity models represented in (d) take into account information provided by the borehole logs (see location in Fig. 3). In (b), (c) and (d), the dark and red lines are resistivity models resulting from MCI of DC and TDEM data, respectively.
 in Fig. 3) and DC soundings (labelled
  in Fig. 3): the two possible a priori models that could describe the terrain are: a 4-layer model (a) and a 5-layer model (b). The 6-layer model shown in (c) is the 1D robust resistivity model based on well-log data recorded in the borehole of Epenèdre. The estimated relative standard deviations of resistivity, thickness and depth are respectively labelled Res STD, Thk STD and Dep STD
| a) | |||||
| Layers | Resistivity (Ωm) | Thickness (m) | Res STD | Thk STD | Dep STD |
| 1 | 319 | 1.6 | 1.11 | 1.13 | 1.13 |
| 2 | 102.5 | 41.7 | 1.02 | 1.14 | 1.12 |
| 3 | 53 | 32.4 | 1.23 | 1.40 | 1.08 |
| 4 | 800 | 1.01 | |||
| b) | |||||
| Layers | Resistivity (Ωm) | Thickness (m) | Res STD | Thk STD | Dep STD |
| 1 | 351.5 | 0.9 | 1.13 | 1.29 | 1.29 |
| 2 | 182.9 | 4.1 | 1.14 | 1.33 | 1.26 |
| 3 | 93.9 | 54.5 | 1.03 | 1.05 | 1.05 |
| 4 | 10 | 3.7 | 1.01 | 1.08 | 1.05 |
| 5 | 630.9 | 1.20 | |||
| c) | |||||
| Layers | Resistivity (Ωm) | Thickness (m) | Res STD | Thk STD | Dep STD |
| 1 | 345 | 1.1 | 1.05 | 1.14 | 1.14 |
| 2 | 179 | 6.8 | 1.05 | 1.2 | 1.16 |
| 3 | 131 | 44.8 | 1.03 | 1.03 | 1.01 |
| 4 | 290 | 2.8 | 1.01 | 1.01 | 1.01 |
| 5 | 60 | 29 | 1.01 | 1.5 | 1.02 |
| 6 | 791 | 1.01 | |||
The main difference between the 4-layer model and the 5-layer model is the presence of a thin conductive layer (10  ) in the latter, at depths lying between 59.5– 63.2 m (Fig. 4c and Table 1b). Moreover, the crystalline basement rock is characterized by a higher value of resistivity (about 800
  ); this appears at a depth of 75.7 m in the 4-layer model (Table 1a) and at 63.2 m in the 5-layer model (Table 1b).
Preliminary MCI modelling reveals two distinct types of information. Firstly, the gneissic basement rock occurs at a greater depth than was previously suggested in the literature (Lambert 1974; Chèvremont et al. 1996). Secondly, the two models correspond to two different hydrogeological scenarios. The third layer (53  ) in the 4-layer model (Fig. 4b and Table 1a) could correspond to an aquifer in the fallout breccia and its lower boundary could coincide with the pronounced contrast in hydraulic permeability between lithic breccias and the crystalline basement rock. The resistivity of the fourth layer in the 5-layer model (Fig. 4c and Table 1b) possibly indicates the presence of a clayey layer which, if characterized by spatial variations in thickness, could correspond to a hydrodynamic discontinuity between the lithic breccia and the gneissic basement rock. The results of the latter model are in agreement with the findings of a previous geophysical survey (Benderitter and Martinet 1995), carried out at the Champagnac quarry (Fig. 1). The outcrop indeed shows the structure of the crater floor and the contact zone between the gneissic basement and impactites, which is defined by the presence of a thin and dark clayey layer. The DC soundings (Schlumberger array) made by Benderitter and Martinet (1995) allowed the electrical signatures of the impactites (200–300
  ), the weathered gneissic bedrock (800
  ) and the clayey layer (10
  ) to be evaluated.
MCI modelling thus leads to two possible solutions for the geological structure at Epenèdre, both of which are in contradiction with the description previously given in the literature. As both results revealed an indetermination in the hydrogeological functioning of the lithic breccias and the gneissic basement, it was decided to drill a borehole and to make use of well-logging in order to determine the characteristics of the local geological structure.
The breccia structure disclosed by the observation of cuttings
The composite log reproduced in Fig. 5 shows the lithology of the breccias and basement rock encountered in the Epenèdre borehole, down to a depth of 69 m. Six main units (labelled from A–F) were identified and their lithological characteristics are summarized in Table 2. The geological formations consist of a succession of lithic breccia layers (units A and D) and green suevite layers (units C, E and F), referred to as Rochechouart-type impactites and Chassenon-type impactites, respectively. Metric scale layers of these two kinds of impactite were observed within unit B. Below the depth of 50 m, the green suevites are particularly rich in glassy inclusions (units E and F) and two layers of oxidized gneiss, characterized by a brick-red colour, mark the top and the bottom of unit E.
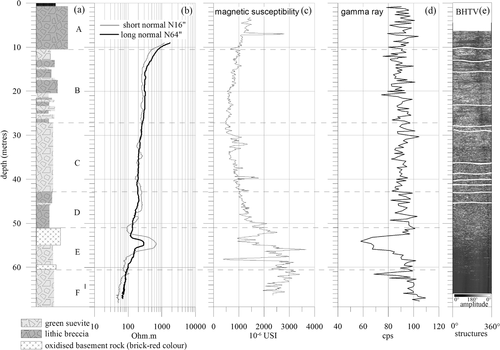
Composite log showing a) stratigraphy from cutting analysis and logs of b) electrical resistivity, c) magnetic susceptibility, d) gamma ray and e) BHTV acoustic imaging versus depth at the Epenèdre borehole (located in Fig. 3).
| Layers | Depth below ground level (metres) | Geological characteristics | Geophysical identities (averages ± standard deviations) | |||
|---|---|---|---|---|---|---|
| Gamma ray (cps) | Electrical resistivity (Ωm) | Magnetic susceptibility (10−6 SI) | ||||
| A | 0–11 | Lithic breccia (Rochechouart type) | 91 ± 6 | 754 ± 246 | 1238 ±331 | |
| B | 11–28.5 | Succession of fine beds of lithic breccia and green suevite | 89 ± 5 | 275 ± 44 | 724 ± 153 | |
| C | 28.5–44.5 | Green suevite (Chassenon type) | 91 ± 5 | 216 ± 27 | 883 ± 213 | |
| D | 44.5–52.5 | Lithic breccia (Rochechouart type) | 93 ± 5 | 183 ± 61 | 1498 ± 373 | |
| 52.5–57 | gneissic layers | 71 ± 11 | 438 ± 191 | 1971 ± 672 | ||
| E | 52.5–62 | 57–61 | Green suevite (Chassenon type) | 94 ± 5 | 83 ± 13 | 2445 ± 712 |
| 61–62 | gneissic layers | 81 ± 7 | 89 ± 10 | 3040 ± 222 | ||
| F | 62–69 | Green suevite (Chassenon type) | 98 ± 5 | 55 ± 5 | 2573 ± 259 | |
The Epenèdre borehole reveals two main characteristics of the breccia structure. Firstly, fallout breccia stratification has been shown to be more complex than suggested by geological maps (Kraut et al. 1969; Lambert 1974; Chèvremont et al. 1996): fallout deposits at Chassenon consist of a succession of thin suevite and lithic breccia layers, with the presence of gneissic layers locally interleaved into the allotchthonous formations. Secondly, the latter observations should indicate that the gneiss – impactite contact is neither sharp nor sub-horizontal, in contradiction with the findings of Chèvremont et al. (1996). Moreover as the interface was not reached by the Epenèdre borehole, it must be deeper than 69 m at this location, thus suggesting deepening of the basement rock.
Geophysical signature of formations from well-logging
The composite log in Fig. 5 shows the variations of electrical resistivity, magnetic susceptibility, gamma ray activity and BHTV imaging with depth, as recorded inside the Epenèdre borehole. Its geophysical properties are reported in Table 2.
The geophysical data present both positive and negative correlations, which allow the slightly-weathered or unweathered breccia layers to be differentiated from those that are weathered. This enables the geophysical signatures to be determined for the different geological formations encountered. Impactite layers characterized by a high magnetic susceptibility and a low gamma ray activity, indeed correspond to unweathered or slightly-weathered breccias, which are particularly rich in glassy iron- and nickel-inclusions. On the other hand, thin layers characterized by a low magnetic susceptibility and a high gamma ray activity can be interpreted as being clayey or weathered breccias. In addition, interfaces defined by a low electrical resistivity and a high gamma ray activity are closely associated with the presence of fractures observed by BTHV. This interpretation is supported by the findings of Marmet (2002), who performed magnetic susceptibility measurements at Chassenon: Chassenon-type and Rochechouart-type breccias were found to have a mean magnetic susceptibility of 1450·10−6 SI and 450·10−6 SI, respectively, whereas the values for gneisses were as low as 90·10−6 SI; soils that had developed on green suevite were characterized by a mean magnetic susceptibility of 450·10−6 SI.
Moreover, several magnetic studies of astroblemes revealed that anomalous magnetizations are related to the presence of impact-related formations (Pohl and Angenheister 1969; Henkel 1992; Plescia 1996; Ormö and Blomqvist 1996; Henkel et al. 2002; Abbott and Mazumder 2007); thermal remanence is the most likely cause of magnetization, which forms after impact during the cooling of the magnetic carrier minerals. The relatively low values recorded in the fractured basement rock can be explained by the oxidation effects observed in fractured zones (Henkel and Guzman 1977) and the jumbling of magnetization vectors induced by brecciation (Beals et al. 1963). According to Kent et al. (2003), the high magnetic susceptibility of fallout deposits could be due to the presence of mafic minerals with a high concentration of single domains; the magnetic signal should fluctuate with the glassy inclusion content of the latter and should decrease as a result of weathering processes.
It should also be noted that the electrical resistivity of the fallout deposits decreases from top to bottom, except within unit E where the two layers of oxidized gneisses are marked by a higher value of electrical resistivity.
Geophysical model based on the stratigraphic log
A layered geophysical model can be proposed from the stratigraphic log, well-logging data and DC and TDEM soundings carried out close to the Epenèdre borehole. The two soundings were inverted using the MCI approach (Fig. 4d and Table 1c).
Firstly, an initial model comprised of six layers was chosen, for which resistivity and depth were defined according to resistivity variations recorded in the borehole. Secondly, in this model, the most reliable parameters, i.e., those for which low relative standard deviations (between 1–5%) had been established, were fixed: the initial model resistivity of layers 2–6 and the thickness of layers 3 and 4. We then allowed the other parameters to vary with respect to the borehole observations. The resolution of the estimated model parameters is expressed in relative values (Table 1c).
MCI inversion indicates that the electrical resistivity of the fallout breccias is 238 ± 107  , between 0–55.5 m (layers 1–4). There is no significant difference between units B, C and D, which are grouped within layers 2 and 3. The resistive top-most layer of unit E is clearly identified. The conductive breccia (60
  , unit F) observed at the bottom of the borehole comes down to a depth of 85 m; the subjacent resistive layer (791 fim) is thought to reveal the presence of a gneissic basement rock.
Electrical and gravity modelling
The inversion of FDEM soundings and the MCI of TDEM and DC soundings made use of the robust 1D model previously described, although this was often reduced to 3-, 4- or 5-layer models. In general, the inversion of breccia soundings provided 4- or 5-layer models. The reduction in the number of layers is due to the fact that i) the presence of the resistive layer of oxidized gneiss (layer 4, Table 1c) is restricted to the Epenèdre area, such as the insertion of this layer into other initial models has no geological significance and ii) a simplified impactite structure can be provided locally. Moreover, we obtain satisfactory fits to sounding data corresponding to the gneissic basement rock, using a 3-layer starting model. In any case, the two fixed parameters of the starting model (with a 5% relative standard deviation) are i) the resistivity of the gneissic basement rock (layer 6, Table 1c), well constrained by the borehole information and previous studies carried out at Champagnac (Benderitter and Martinet 1995) and ii) the resistivity of deep weathered layer of impactite (layer 5, Table 1c), probably corresponding to a continuous friction layer between fractured gneisses and impactites. The resistivity and thickness of the upper layers were deliberately left unconstrained, owing to the complex geo-electrical geometry expected within the impactites and more particularly for lateral resistivity variations for layers 1–4. Although, in most cases, the 1D robust starting model provides satisfactory inversion results, it was necessary to reduce the resistivity of the gneissic basement rock to a value of 500  in some locations; this outcome can be explained by the high spatial variability of the fractures and of the weathering processes. The same is true for the deep conductive layer, for which we locally defined a STD of 1.5.
An example of the results obtained from the inversion of FDEM soundings (six apparent conductivity measures by sounding, that is to say using VD and HD configurations with spacings between coils of 10 m, 20 m and 40 m) performed at the centre of Chassenon (located in S1, Fig. 3) is given in Fig. 6(a). In the middle of the impactite outcrop of Chassenon, the impactite layer comprises an uppermost weathered layer, a subjacent layer defined by a resistivity of 518  and a thick conductive (60
  ) lower layer occurring at a depth of 32 m. Figure 6(b) illustrates the 3-layer model of FDEM data determined for the gneissic basement rock (located in S2, Fig. 3); this highlights the presence of a thin aquifer (layer 2) and the presence of the slightly weathered basement rock at a depth of about 11 m.

Representative apparent resistivity data from FDEM soundings made a) at the centre of the breccia remains (referred to as S1 in Fig. 3) and b) on the gneissic basement rock (referred to as S2 in Fig. 3) and the associated 3-layer models. VD (vertical dipole) and HD (horizontal dipole) correspond to horizontal coplanar (HCP) and vertical coplanar (VCP) coil configurations, respectively. Star symbols represent FDEM observed data when red and blue lines correspond to calculated values. R2 values are rms errors.
1D models, resulting from inversion of FDEM data and MCI of DC and TDEM data, were subsequently concatenated in the same database and provided resistivity data, which were extracted from these for different depths and gridded, which made it possible to evaluate the horizontal and vertical variations of the electrical resistivity. A program was written in order to visualize the vertical variations of the gridded resistivity data, exactly along the modelled gravity profile and in accordance with the elevation data extracted from the digital elevation model of Chassenon (profile A, Fig. 7a; see location in Fig. 3). The 2D resistivity model (Fig. 7a), resulting from interpolation of gridded resistivity data, confirms the basement rock deepening at Chassenon: at the centre of the residual breccia layer, the thickness of the fallout deposits is greater than 100 m. This model also shows that breccia fallouts are weathered on their surface layers, the uppermost of which is characterized by a resistivity of 20–60 Ωm and can be identified as a shallow aquifer.
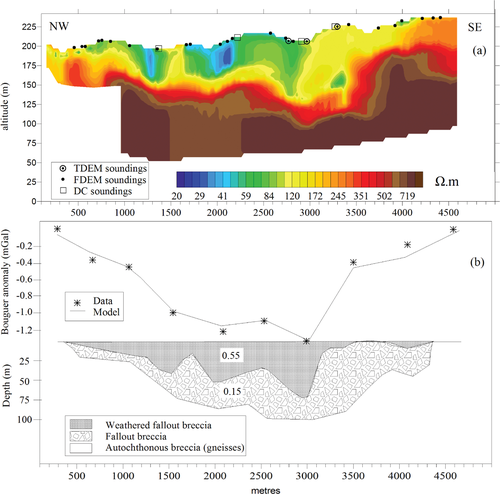
a) 2D resistivity models along the selected northwest-southeast profile (profile A, see location in Fig. 3). FDEM, TDEM and DC soundings located less than 200 m from the resistivity profile A have been reported by orthogonal projection; b) 2D gravity model with a 0.55 g/cm3 density contrast between weathered fallout breccia (resistivities in the range 20–60  ) and the basement rock and a 0.15 g/cm3 density contrast between less weathered fallout breccia (resistivities in the range 60–300
  ) and the basement rock. Both gravity and resistivity models reveal the breccia-gneiss interface.
In parallel with the electrical model, a 2D model of the Bouguer anomaly was constructed (Fig. 7b), using Grav2DC V.2.10 free software written by G.R.J. Cooper from the University of the Witwatersrand (South Africa). The BRGM Infoterre data used correspond to the northwest-southeast gravity profile across the Chassenon breccia remains (profile A, see location in Fig. 3). The density and the geometry of the terrain are defined in the 2D model according to the density measurements of Lambolez (1971) and the geometry of the geoelectrical layers. Negative density contrasts of 0.15 g/cm3 between less weathered fallout breccias and gneissic basement rock and 0.55 g/cm3 between weathered fallout (superficial aquifer) and gneissic basement rock, were selected. The basement rock density corresponds to the density of a saturated rock with a porosity of 8.8 % (initial density of 2.7 g/cm3). The geometry of the breccia-basement rock interface is revealed by 2D inversion of the gravity data (Fig. 7b) and was found to be similar to that obtained using the resistivity model, thus confirming the depth at which the highly fractured gneiss occurs and locally revealing the presence of deep weathered layers.
visualization of impact-related rock geometry
The Chassenon fallout deposits can thus be visualized, using the same program for the extraction of gridded data along profiles. Five resistivity profiles (labelled B–F, Fig. 3), resulting from interpolation of gridded resistivity data and all of which also taken the digital terrain model into account, were extracted along 4 km east-west profiles (Fig. 8).
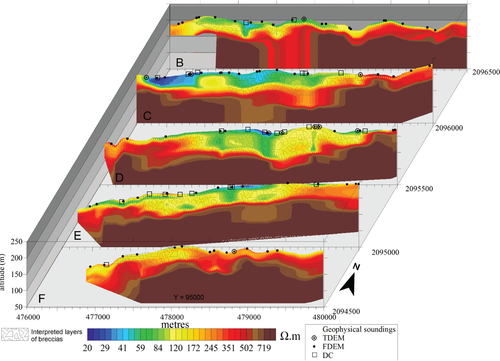
3D visualization of resistivity variations of the Chassenon fallout breccias (referred to as profiles B–F in Fig. 3). FDEM, TDEM and DC soundings located less than 200 m from the modelled resistivity profiles have been reported by orthogonal projection.
The cross-sections show a complex and heterogeneous distribution of resistivity values, ranging between 20–850 Ωm. Resistivity signatures in the ranges 20–60 Ωm, 60–400 Ωm and 500–800 Ωm are respectively interpreted as: a layer of superficial weathered breccia or water-bearing basement rock, a succession of thin suevites and lithic breccia layers and a highly fractured basement-rock. The interpreted breccia layers are shown in Fig. 8, in accordance with the geological boundaries defined on the geological map (Chèvrement et al. 1996). It should also be noticed that the resistivity of the deep gneissic basement rock is locally around 500 Ωm, which can be observed for example in profile B (Fig. 8). The heterogeneous distribution of fault patterns and weathering processes could be responsible for the lateral variations in resistivity of the gneiss. This interpretation is in accordance with previous magnetic studies (Ormö and Blomqvist 1996; Ormö et al. 1999), in which zones of highly fractured bedrocks should explain the gravimetric and magnetic anomalies recorded in Sweden (Tvären Bay and Hummeln impact craters). However, the vertical resistivity discontinuities observed within the gneiss (profile B, Fig. 8) may be artefacts resulting from interpolation.
DISCUSSION AND CONCLUSIONS
The discovery in 1969 of the extraterrestrial origin of the RCA structure created renewed interest in this feature and led to the publication of geological (Kraut et al. 1969; Kraut and French 1971; Lambert 1974) and geophysical (Pohl et al. 1978) studies. Whereas, although the shape of the RCA and the extent of fallout breccia outcrops were known, there was no recognition of the vertical structure of impact-related rocks. In the present study, geological and geophysical campaigns were carried out in order to improve our knowledge of the vertical structure of impactites, their connection with the basement rock and the geometry of water-bearing aquifers in this highly fractured context.
Gravity data acquired in 1955 were reprocessed and geophysical surveys were carried out at Chassenon, a town located at about 5 km from the centre of the RCA. The three-step geological and geophysical study described in the present paper brings new insight into the structure of the RCA, which is summarized in Fig. 9.
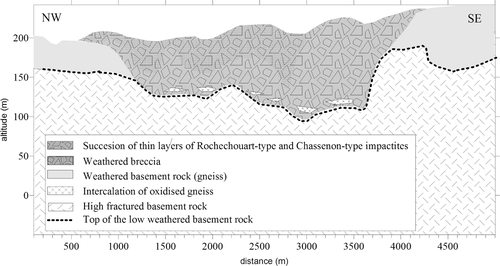
Geological interpretation of the 2D resistivity model (profile A, Fig. 3) showing the new findings provided in the present study.
The 69-m deep well, drilled in the north-eastern part of the fallout breccias at Epenèdre, allowed the authors to carry out electrical resistivity, natural gamma ray, magnetic susceptibility and acoustic imagery logs. The bore drilling, carried out after MCI of the preliminary results from TDEM and DC soundings, led to two possible models with diverging hypotheses, related to: i) the geological structuring of the fallout deposits and ii) the hydrogeological activity within fallout breccias and the subjacent basement rock (with one of the models suggesting the presence of an impermeable layer between fallout deposits and the basement rock).
Moreover, the stratigraphic log made from cutting analysis reveals that the fallout breccia consists of a complex interleaving of suevites and thin layers of lithic breccia (Fig. 5), in contradiction with previous studies (Lambert 1974; Chèvremont et al. 1996). Well-logging delivers the geophysical signatures of fallout breccias and highly fractured basement rock. The contrast levels observed at certain depths can be caused by i) very high temperature conditions during the cratering process, leading to chemical transformations such as the conversion of mafic minerals into high magnetic iron oxide (magnetite) or ii) the enrichment of glassy particles with high concentrations of iron and nickel. Well-logging also provided a satisfactory a priori 1D resistivity model, which was validated by the resistivity models provided by MCI of TDEM and DC soundings carried out near the well. It was found that the model successfully fits the apparent resistivity measurements using a MCI approach. This robust 1D model shows that, at Epenèdre, the boundary between highly fractured gneiss and the fallout breccia (not observed in the well) occurs at a depth of 85 m. Such a depth corresponds to deepening of the basement rock, which was not detected by previous studies.
Secondly, MCI of other TDEM and DC data and inversions of FDEM data using the robust 1D resistivity model as a starting model, allowed a NW-SE pseudo-2D resistivity profile to be constructed across fallout deposits (Figs 3 and 7a). This model was validated by the gravity model, which results from inversion of both density and depth of gravity data (Fig. 7b). The bodies defined in the gravity model take into account resistivity signatures, which allow to distinguish i) fallout deposits with a 0.55 g/cm3 density contrast between this superficial layer and the basement rock and ii) un-weathered fallout deposits associated with a 0.15 g/cm3 density contrast (and resistivities in the range 60–300 Ωm). The 2D gravity model supports the electrical resistivity model and vice versa. Both models also reveal a deepening of the basement rock in the central part of the fallout breccia, which in some places reaches more than 100 m in depth and the probable existence of a higher fractured zone of gneiss beneath the fallout deposits.
Thirdly, a global visualization of impactites was achieved, showing the deep and irregular contact zone between the autochthonous and allochthonous breccias and the geometry of the impactites and water-bearing zones.
- The gravity model of the RCA shows the presence of two small negative anomalies in the vincinity of Chassenon and Rochechouart, which may be interpreted as resulting from the lower densities of impact-related rocks.
- The total thickness of fallout deposits is locally larger than 100 m at Chassenon.
- The impactites consist of a thin succession of lithic breccia and green suevite; the impactite classification proposed by Kraut et al. (1969) and Lambert (1974) cannot explain this stratification at Epenèdre.
- The boundary between gneisses and impactites is not sub-horizontal: borehole data and geophysical analysis reveal a deepening of the contact zone and the presence of gneissic layers within deep green suevites, which suggests that this is not a sharp boundary.
- The gneissic basement rock is locally affected by a dense fault pattern.
- The impactites and gneisses are shallow water-bearing aquifers.
- The merging of well-logging data (magnetic susceptibility, gamma ray activity and electrical resistivity) is particularly useful for the characterization of the geophysical signatures of impact-related rocks.
In the present case study, the set of 1D inversions of sounding data are sufficient to support a global structure description. In fact, the case presented here depends on two major particularities. Firstly, the deeper structure of the breccia deposits is rather smooth (the drawings exaggerate the true slopes of the boundaries between the units). In such cases, 1D inversion yields results that are pertinent with respect to smooth 2D or 3D structures. Furthermore, the a priori 1D model is accurately confirmed by the well-logging data used to initialize all of the inversions and is well adapted to the full extent of the surveyed area. Secondly, the use of the MCI approach allows TDEM soundings to be included in the inversion of DC soundings. In fact, TDEM data are known to be less sensitive than DC data to local near-surface resistivity variations and thus limit the occurrence of inversion artefacts. The application of this approach to other study cases is certainly feasible but should be validated with care.
ACKNOWLEDGEMENTS
We would like to express our gratitude to the Master students of the University of Pierre and Marie Curie (Paris 6) for their contributions to the field study and to Alain Tabbagh for his fruitful suggestions during the writing of the first draft of this paper.


