Short-Term Bioassay of Chlorophenol Compounds Using Euglena gracilis
Abstract
Short-term bioassay of chlorophenol compounds such as di- and pentachlorophenol (DCP and PCP) on the movement parameters and photosynthesis activity is tested using Euglena gracilis. Cells were exposed to different concentrations of 2,4-dichlorophenol (2,4-DCP) and pentachlorophenol (PCP) for different incubation times. Results of acute toxicity tests of cell motility showed that Euglena was highly sensitive to PCP after direct exposure in comparison to 2,4-DCP (EC50 were 26.8 mgL−1 and 205.2 mgL−1), respectively. In contrast, 2,4-dichlorophenol shows significant impact on the movement and photosynthesis of the Euglena after longer incubation times (24 hours). Photosynthetic yield of Euglena was suppressed at concentrations ≥1.5 and ≥12 mgL−1 of pentachlorophenol and 2,4-dichlorophenol, respectively. This proves inactivation of photosystem II through inhibition of both electron transport and potential energy of photosynthetic membrane, whereas lower concentrations disturbed Photosystem II making it work ineffectively. Rapid, sensitive, and automatic measurements of several parameters are the main advantages of the studied bioassay.
1. Introduction
Chlorophenol compounds exit to the environment from a variety of sources such as industrial waste, pesticides, insecticides, or by degradation of complex chlorinated hydrocarbons compounds [1–3]. These compounds enter the aquatic ecosystems and exert adverse effect on the aquatic life [4, 5]. Due to their high toxicity, chemical stability, and bioaccumulation in living organisms, they are listed as the most toxic environmental pollutants by US EPA [6]. 2,4-Dichlorophenol (2,4-DCP) is a cytotoxic compound towards marine and fresh water algae as well as animal cells [7–10]. Pentachlorophenol (PCP) causes liver, adrenal gland, and nasal tumours in laboratory tested animals; in addition it causes liver and nervous system disorder for humans [11]. 2,4-Dichlorophenol (2,4-DCP) and pentachlorophenol (PCP) are known aquatic ecosystems pollutants of wide spread distribution in industrial countries like, United States, Canada [12], China, and Russia. In China, dichlorophenol is extensively used in industry representing about 16% of total industrial effluents [13]. In Russian Federation, wastewaters of bleach plants contain approximately 20 various chlorinated phenolic compounds, including PCP, whose concentration reaches 1 mgL-1 [5, 14].
In this context, rapid, sensitive, and effective evaluation of their toxicity is an extremely important matter of great concern. Recently, risk assessment employing microscopic algae for toxicity and hazard evaluation is a research trend which attracts universal interest. Therefore, in the current study the response of unicellular eukaryotic green algae E. gracilis to some organic xenobiotics like PCP and 2,4-DCP was tested using movement as well as photosynthetic parameters.
2. Materials and Methods
2.1. Organism and Culture
Axenic culture of unicellular green algae Euglena gracilis Klebs (strain Z) was used in the present study as biotest model. Cells in triplicate 100-mL flasks containing 65 mL culture medium were grown under photoautotrophic conditions with continuous light of 20 Wm-2 and temperature set to 22°C. Cells were previously grown in complex medium [15] then after one week transferred into mineral medium [16] at a ratio 1 : 4.
2.2. Analysis of Motility Parameters
Measurement of the effect of the tested xenobiotics organic toxicants on the movement parameters of E. gracilis was done using ECOTOX biosystem [17]. Two chlorophenol compounds were tested in this study: pentachlorophenol as sodium salt and 2,4-dichlorophenol. The chemicals used were analytical grade (purchased from Sigma-Aldrich, Germany) and tested at concentrations ranging from 1.5 to 100 mgL-1 for zero, 1, 2, 3, 4, and 5 days. All measurements of cell samples (dark adapted for 20 minutes) were done in darkness to avoid interference with phototaxis in Euglena. Control measurements were done first by mixing cells with water, followed by cells-toxin measurements.
2.3. Photosynthetic Measurements
Photosynthetic parameters such as Fo, Fm, Fv (minimum, maximum, and variable fluorescence) for dark- and light-treated samples were monitored every day up to five days using pulse amplitude modulated fluorometer (PAM 2000, Walz, Effeltrich, Germany). Concentrations of 1.5, 3, 6, 12, and 25 mgL-1 of PCP-Na and 3, 6, 12, 25, and 50 mgL-1 of 2,4-DCP were used to examine photosynthesis efficiency parameters. Light curve of 12 illumination steps (generated by an internal halogen lamp) from 0 to 3111 μmol m-2s-1 were made for all treatments and control after 30 minutes and 5 days exposure time. From these, electron transport rate (ETR) and photosynthetic yield were recorded and drawn against the incident photosynthetically active radiation in μmol m-2s-1 (PAR). The measuring distance between the fibre optic tip and measuring sample was fixed at 2 mm and the program settings were not changed throughout the study. The experiments were performed in three replicate flasks, each containing 35 mL of test algae suspension and 35 mL of 2,4-DCP or PCP solution, with five concentrations and a control for each replicate. All flasks were repositioned daily within the culture chamber to minimize possible spatial differences in illumination and temperature.
3. Statistical Analysis and Treatment of Data
Effect-concentration curves were drawn using chlorophenol compound concentrations as x-axis (usually log value) against data from ECOTOX (inhibition %) following (1) according to [18]. Data were processed using mathematical models proposed by Emmens in the software SigmaPlot for windows 2000 by SPSS Inc:
All treatments for photosynthesis experiments are done in triplicate; mean and standard deviations were calculated for each. Significance of the results was tested using one-way ANOVA test (Posthoc) by SPSS 11 for windows at 0.05 levels.
4. Results
4.1. Motion Analysis
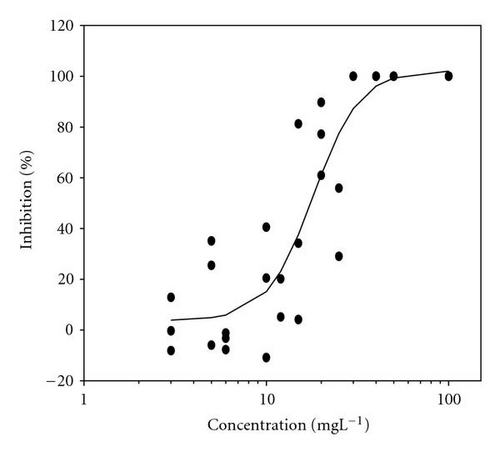
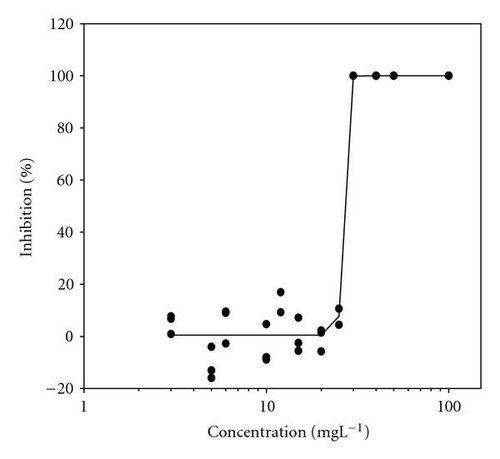
Movement parameters of E. gracilis show sensitivity in response to toxins even after direct mixing of cells with toxin sample (cells adapted to cuvette after mixing with toxins for 20 sec in darkness). Figures 1(a)–1(d) present the effect-concentration curves of the most remarkable parameters: motility ((a) and (b)) and upward swimming ((c) and (d)) of E. gracilis immediately and after 24-hour exposure to increasing concentrations of PCP-Na solutions. An immediate exposure to PCP-Na has an EC50 of 26.8 for cell motility. A decrease in the EC50 (16.8 mgL-1) value occurred after longer exposure time of 24 hours. Inhibition of the gravitactic orientation (upward swimming cells) has an EC50 value of 34.5 mgL-1 (direct exposure) and 29 mgL-1 after 24-hour incubation time (Figures 1(c)-1(d)). Although a noticeable difference among the EC50 values was observed between direct and 24 hours of exposure, longer incubation times (up to 5 days) tended to have similar EC50 values for the measured motion parameters.
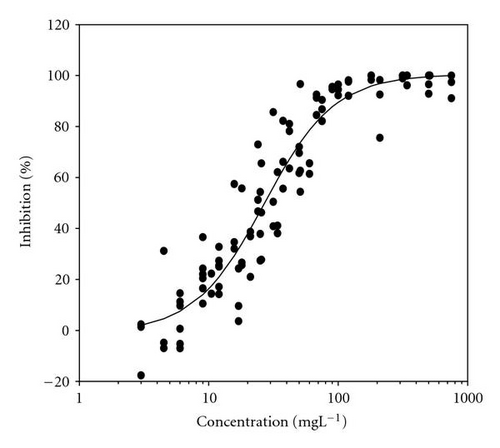
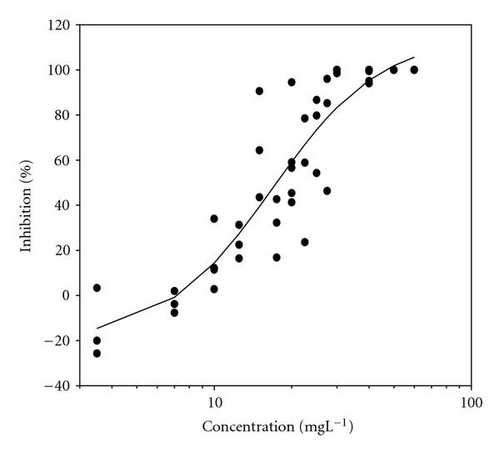
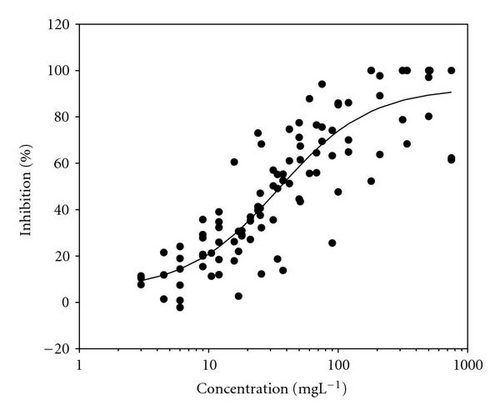
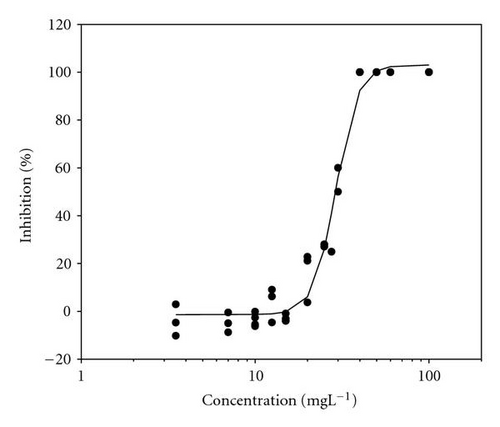
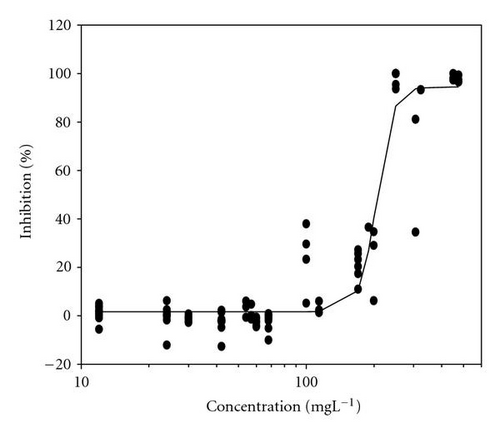
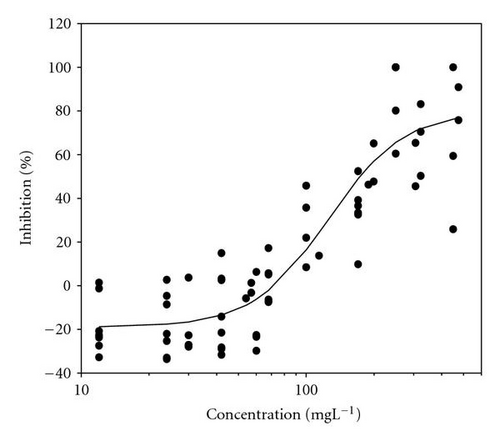
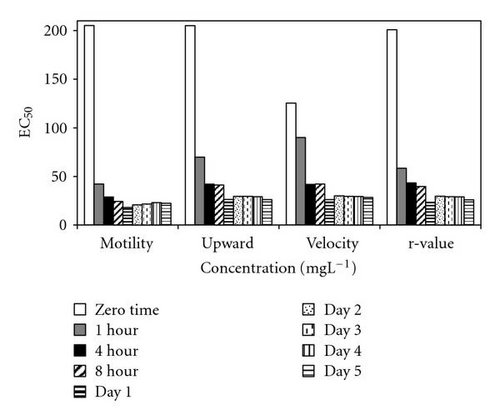
Results of acute toxicity tests of 2,4-DCP using E. gracilis (Figures 2(a)–2(d)) showed that, after direct exposure, EC50 values were 205.2 mgL-1 and 125.3 mgL-1 for motility and velocity parameters, respectively. After incubation time up to one day, EC50 values were drastically reduced to 18.1 mgL-1 and 23.4 mgL-1 , respectively. Cells were further incubated with 2,4-DCP up to 5 days, but the calculated EC50 values were insignificantly increased in comparison to ones obtained after 24-hour incubation time. This means that acute 2,4-DCP toxicity increases very significantly (about 10 times) from zero to 24 hours of exposure. In this context, tests after 1, 4, and 8 hours of exposure were performed. Results of this short-term incubation time (Figure 3) show that the EC50 values were decreasing gradually with increasing incubation time.
4.2. Photosynthetic Efficiency
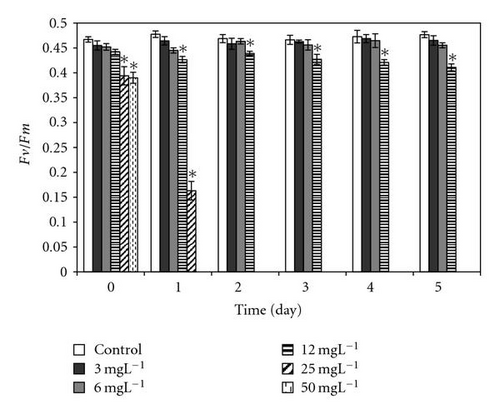
In our study we use chlorophyll fluorescence parameters which directly reflect the efficiency function of photosystem II (PSII) in algae (measured as relative variable fluorescence, Fv/Fm) [19]. At PCP concentrations up to 3.1 mgL-1, the relative dark and light yield of variable fluorescence [Fv/Fm = (Fm – Fo)/Fm and Fv′/Fm′ = (Fm′ − Fo′)/Fm′] remained almost unchanged after direct exposure. On the other hand, the direct significant response of cells to addition of PCP occurred at high concentrations from 6 to 25 mgL-1 for light- and dark-adapted samples (Figure 4). Afterwards, the photosynthetic quantum yield was significantly reduced at PCP concentrations of 1.5 and 6 mgL-1 and drastically reduced with concentrations ≥12. PCP added to the cells suspension at concentrations 25 mgL-1 and after 24-hour exposure time reduces the photosynthetic yield to zero value.
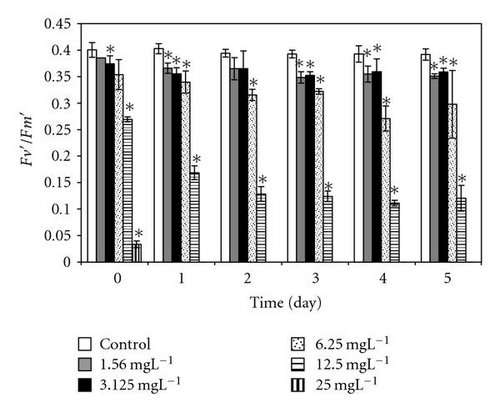
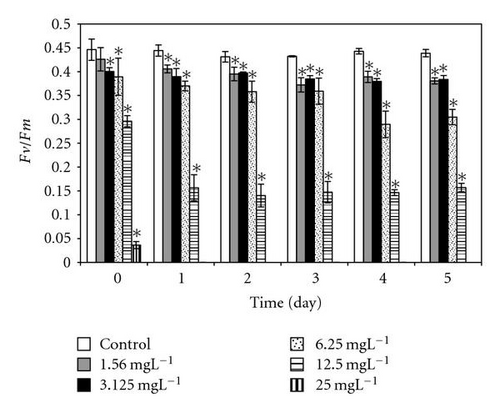
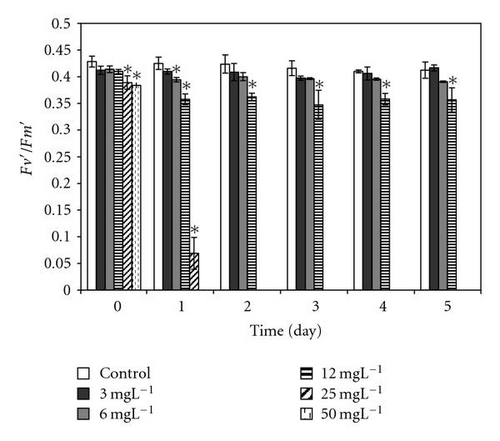
After direct exposure to 2,4-DCP concentrations up to 6 mgL-1, the relative dark yield of variable fluorescence (Fv/Fm) values is relative to the ones from control. With subsequent incubation time up to 5 days, the photosynthetic yield remained almost unchanged, indicating that 2,4-DCP at low concentrations did not affect the PSII efficiency. On the other hand, high concentrations of 2,4-DCP (≥12 mgL-1) show significant differences in photosynthetic yield after an immediate exposure to toxins; this effect becomes severe with longer incubation times (Figure 6).
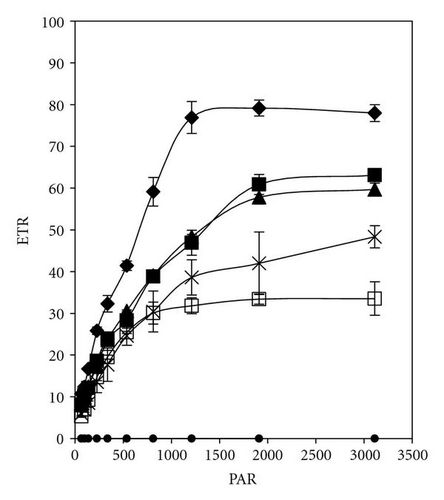
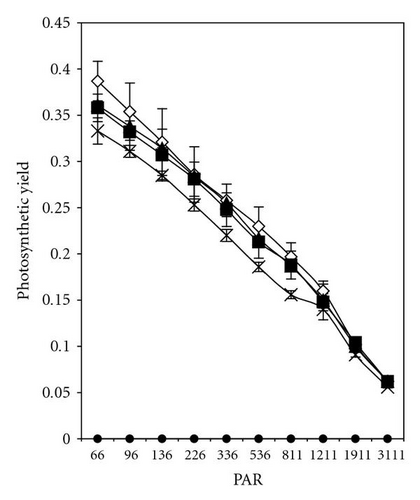
The effective quantum yield as well as relative electron transport rate (ETR) was drawn against the density of incident photosynthetically active radiation (PAR) in Figures 5 and 7. The data were measured automatically by running so-called light curve, a method which gave rapid assessment of the photosynthesis capacity and light adaptation state of plants in their environment [20].
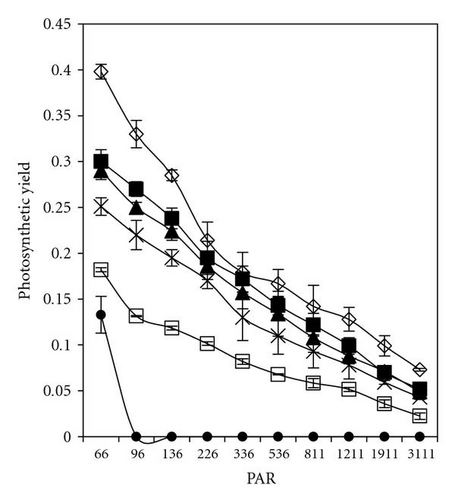
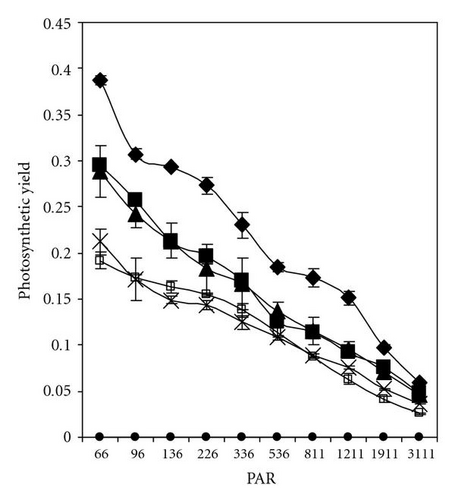
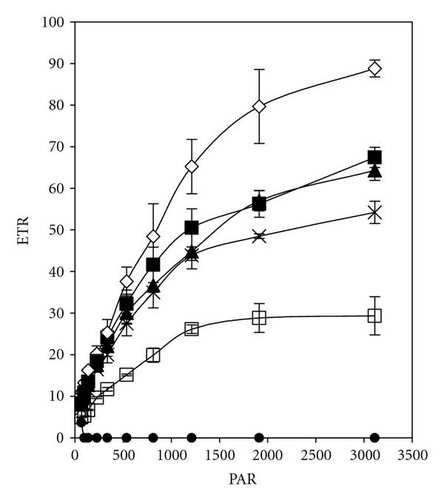
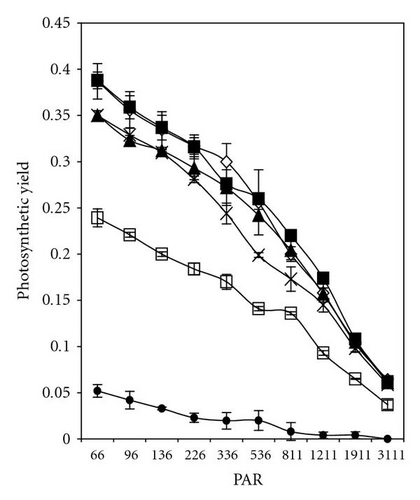
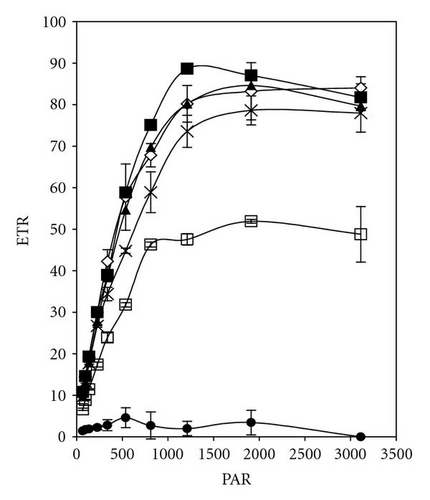
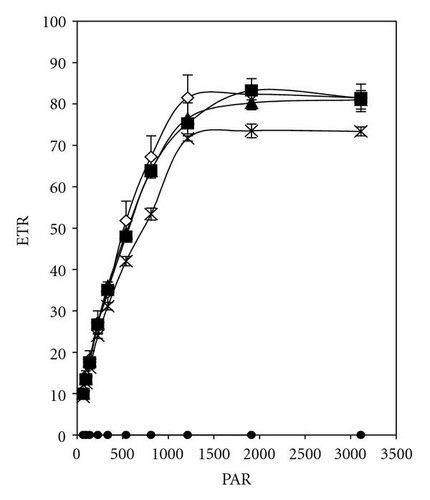
Light response curves of PCP-Na concentrations after 30 minutes and 5 days of incubation were illustrated in Figures 5(a)–5(d). It is apparent that, even after short-time exposure (30 minutes), all concentrations from PCP-Na show obvious effects on both photosynthesis quantum yield and ETR. Samples with 25 mgL-1 displayed zero value of quantum yield and ETR with increasing light intensity from darkness to 96 μmol m-2s-1. These effects are in accordance with increasing level of PCP and time of exposure (up to five days).
In the presence of 2,4-DCP at low concentrations (up to 12 mgL-1), photosynthetic electron transport is not disturbed, charges are separated, and the PS II efficiency is not reduced in comparison to control values (Figures 7(a)–7(d)). These effect trends remain unchanged even after 5 days of incubation with 2,4-DCP. Higher tested concentrations like 50 mgL-1 showed clear cut inhibition of both Photosynthesis yield and ETR after 30 minutes. Whereas 25 mgL-1 concentration showed, after 30-minute exposure time significant, intermediate effect in comparison to control and other tested concentration, but longer exposure (5 days) completely inhibits the ETR and photosynthesis yield.
5. Discussion
Chlorinated aromatic compounds are extremely toxic to living organisms and their toxicity increases with the degree of chlorination of the phenol ring [21]. Several mechanisms are involved in the toxicity of chlorophenols on microorganisms, of which disrupting energy transduction either by uncoupling oxidative and photosynthetic phosphorylation or by inhibiting electron transport [22, 23].
In bioassays, several organisms as well as many parameters were proved to be suitable for risk assessment of chlorophenol compounds, of which growth inhibition, mortality, and photosynthesis inhibition [4, 24]. Photosynthesis is used as ecological endpoint in the bioassay tests since it responds sensitively to external environmental changes, of which photosystem II and the water-oxidizing complex are considered as the most sensitive sites to stress factors [25–27].
PCP decreases the photosynthetic efficiency at all tested concentrations from 1.5 to 25 mgL-1, but the effect is drastic at concentrations of 12 and 25 mgL-1. This significant decrease may be a result of the effect of this toxicant on the ETR between photosystem I and II as well as disturbance of photo reduction of NADP+ [5]. These effects were in linear pattern with PCP concentration and exposure time. Our finding is in good agreement with what discussed elsewhere about the effect of chlorophenol compounds on photosynthesis [28, 29]. In addition, PCP was observed to disturb light reactions by inhibiting electron transport chain of PSI at low concentrations [30, 31]. On the other hand, 2,4-DCP showed significant effect on the measured photosynthetic parameters but at higher concentration than the one of PCP; for example, 25 mgL-1 shows 100% and 65% inhibition of photosynthetic yield after one day of incubation for PCP and 2,4-DCP, respectively. This also proves that the toxicity of such chlorinated compounds on photosynthesis increases with more chlorine molecules. Our results are also in accordance with what was found in previous study testing effects of many chlorophenol compounds from mono- to pentachlorophenol on Pseudokirchneriella subcapitata [32].
As discussed elsewhere, motility parameters of Euglena gracilis can be used as ecological endpoints in toxicity bioassay [17, 33]. Our study proves the sensitivity of these parameters to tested organic pollutants, which is of the same order of magnitude to photosynthetic parameters. EC50 values of different organisms (algae, crustaceans, fish, etc.) are listed in Table 1. Acute toxicity test of 2,4-DCP for 48 hours showed EC50 values ranging from 2.12 (Daphnia magna) to 13.1 (Tilapia mossambica). 96-hour growth inhibition with Scenedesms obliquus has an EC50 10 mgL-1. In case of PCP, EC50 values were varied as follows: 2.7–4.0 mgL-1 for Gloeophyllum striatum, G. trabeum, and Trametes versicolor [34], 20 mgL-1 for Phanerochaete spp. [35], and 15.7 mgL-1 for Chlorella vulgaris var viridis [2].
| Organism | EC50 (mgL-1) | Exposure time (h) | Reference | |
|---|---|---|---|---|
| PCP | 2,4-DCP | |||
| Euglena gracilis | 16.8 | 18.1 | 24 | Current study |
| P. subcapitata | 0.004 | 4.2 | 48 | [24] |
| P. subcapitata | 0.0134 | 3.8 | 48 | [24] |
| P. subcapitata | 0.42 | 14 | 96 | [36] |
| Scenedesmus obliquus | — | 10 | 96 | [4] |
| Gold fish | 0.052–16 | — | 24 | [37] |
| Daphnia magna | 0.67 | 2.5 | 48 | [4, 24] |
| Daphnia plux | 2 | 48 | [38] | |
| Tilapia mossambica | — | 13.1 | 48 | [4] |
| MICROTOX | 0.05 | 5.5 | 0.5 | [39] |
| P. reticulate | 0.44 | 5.5 | [36] | |
| Ctenopharyngodon idellus | — | 5.84 | 48 | [4] |
| Carassius auratus | — | 10.3 | 48 | [4] |
EC50 values obtained from several bioassay tests are different depending on the nature of organism, growth condition (mainly pH) and the end point parameters. Although some EC50 values are lower than the ones we got from motility parameter, many other aspects should be taken in consideration with selection of test organism. Euglena gracilis is easy to handle and to grow without any special condition in addition to one important character which is fast response which ranges from direct response to maximum 24 hours of incubation time.
6. Conclusions
From our results we can conclude the following points.
(1) Reliable, sensitive, cost, and time effective monitoring of the tested xenobiotics are the main advantages of our bioassay test with its organism Euglena gracilis. Fast response was clear from short effective exposure time varying from zero to maximum one day in case of motility and no more than 5 days for photosynthetic parameters. An important advantage is short-time measurement which ranges from 8 to 10 minutes for one complete measurement using ECOTOX and PAM, respectively. Euglena gracilis is easy to cultivate with significant response to low concentrations. Moreover, results obtained in this study were comparable to previously performed bioassays. In addition, several parameters by ECOTOX and PAM can be determined automatically.
(2) Study of the chlorophyll fluorescence parameters reflecting the state of the photosynthetic apparatus indicates that PCP at concentrations 1.5 to 6 mgL-1 disturbs the photosynthetic apparatus through inhibition of ETR. On the other hand concentration of 12 mgL-1 caused reduction of photosynthesis parameters to about 65% of its value in comparison with control ones. Photosynthesis yield was completely destroyed with 25 mgL-1 concentration.
(3) Results of acute toxicity tests of 2,4-DCP and PCP using E. gracilis showed that cell motility was the most sensitive movement parameter with EC50 being 16.8 mgL-1 and 18.1 mgL-1 after 24-hour exposure time.
(4) Both cell motility and photosynthetic yield showed equal degree of sensitivity toward tested chlorophenol compounds.
(5) Both PCP and 2,4-DCP can be regarded as acute toxicity compounds to motility and photosynthesis parameters.


