Differential Toxicological Interaction among Arsenic, Cadmium, Lead, and Mercury on MCF 7 Cell Line
Abstract
Evaluation of joint toxic action of metal ion mixtures is one of the priority research areas due to the simultaneous occurrence of metals in the environment and the health risk they posed to humans and the environment as a mixture. Individual and composite mixture acute toxicities of arsenic (As), cadmium (Cd), mercury (Hg), and lead (Pb), which are among the top eight toxic chemicals, were characterized at varying concentrations. MCF 7 cell lines were exposed to individual and composite mixtures containing the four metal ions in the proportion of their EPA′s MCL for 24 hours, and the concentration-response data were generated spectrofluorometrically. Acute toxicities were estimated based on the uptake of fluorescence diacetate dye. Toxicological interactions among the four metals were profiled, based on computed interactive index. Results demonstrated that the toxicity of each of the metal ions was enhanced in the composite mixture, and the metals demonstrated differential interactions in a concentration dependent manner. Lead, the least toxic among the four metals, showed the highest enhancement (23-to 64-fold) in toxicity when in the mixture. Interaction among the four metals was largely additive although there was slight departures form additivity at the two extremes of the concentration range.
1. Introduction
Mixtures of arsenic (As), cadmium (Cd), mercury (Hg), and lead (Pb) are commonly encountered in food, water, and other parts of the environment as a result of human and natural activities. Humans are therefore coexposed to these metals simultaneously or sequentially through several exposure routes leading to consequential health risk [1]. The four metals are among the top eight contaminants in the site frequency count by Agency of Toxic Substances and Disease Registry’s (ATSDR-) completed exposure pathway site count report [2] and EPA’s highest priority hazardous substances, and importantly, these metals are implicated in the environmentally-induced cancers and hormonal disrupting activities [3]. It is therefore imperative that toxicity studies of these metals in combination are adequately pursued.
Composite mixtures of metals have been found to elicit toxicological interactions (antagonistic, additive, and synergistic) [4–7]. Studies have shown that on the basis of Dutch and US water quality criteria, mixtures of commonly found metals in water do not adequately protect aquatic lives [8–10]. Ishaque et al. [11] showed that composite mixture of As, Cd, Hg, and Pb demonstrated synergistic effects on Vibrio fischeri. Bae et al., [12] found that interactive effects of the metals were dependent on the concentration, and this differing interactive effect was linked to biochemical response of the cells to the metal intoxication [13–16]. Combined effect of mercury ions and dithiothreitol (DTT) increased cellular concentrations of GSH in hepatoma cell cultures [17].
Evidence is therefore mounting regarding the link between biochemical response and the interactive effect of chemical mixtures. Although organisms are rarely exposed or survive the exposure at the acute level, it is important to understand the interactive effect of chemical mixtures at all levels in order to understand the toxic effect of chemical mixtures in their totality. Different types of mixture compositions have been used in studying the interactive effect of chemical mixtures. In some studies compositions were based on the toxicity of each individual component [12, 18]. In other studies the basis for the mixtures included quality criteria, composition at Superfund sites, and average composition in the environment [8–10]. Although these compositions have shed light on the interactive effects of metal mixtures, none of them is conclusive because ratio of metals in the natural environment is variable, and LD50 depends on the organism, its state of health, and the exposure route. To glean more information on the adverse effects of chemical mixtures, it is equally important to investigate mixture composition based on EPA’s maximum contamination levels (MCL) since this criterion is one of the benchmarks for assessing water quality.
In this study composite mixture of As, Cd, Hg, and Pb with composition based on the ratio of the EPA’s MCL of each metal was used in acute toxicity studies. This is to help understand the interactive effect of these metals when they accumulate in the environment at this ratio and at higher concentrations. It also offers an alternative to modeling the impact of metal mixtures with composition based on environmental pollution regulation.
The aim of this research was to characterize the interactive effects (additive, synergistic, and antagonistic) of As, Cd, Hg, and Pb in quaternary mixtures using an MCF 7 cell line in vitro system. The MCF 7 cell lines were chosen for the study due to the ability of these cells to withstand harsh conditions which allowed the use of higher exposure levels. This preliminary study aimed at demonstrating a proof of principle in the use of EPA’s MCL ratio for the study of metal mixtures.
2. Materials and Methods
2.1. Cell Culture and Exposure
As (1 mg/mL in 2% KOH), Cd (1 mg/mL in 0.5 N nitric acid), Pb (1 mg/mL in 2% nitric acid), and Hg (1 mg/mL in 10% nitric acid), all atomic absorption standard solutions, were purchased from Acros Organic (New Jersey). Dimethyl sulfoxide (DMSO) and Fluorescence Diacetate Dye (FDA) were purchased from Sigma-Aldrich Co (St. Louise , MO). MCF 7 cell lines, Trypsin-EDTA, and Fetal Bovine Serum (FBS) were purchased from American Type Culture Collection (ATTC) (Manassas , VA). Minimum Essential Medium (MEM) alpha 1x, Dulbecco’s Phosphate Buffered Saline (PBS), MEM without phenol, and penicillin-streptomycin were purchased from GIBCO Invitrogen (Grand Island , NY). MCF 7 cells were grown in MEM alpha 1x supplemented with 10% FBS and 1% penicillin streptomycin and incubated for 24 hours at 37°C in a 5% CO2 incubator to allow the cells to grow, and form a monolayer in the flask. Cells grown to 75%–85% confluence were washed with PBS, trypsinized with 3 mL of 0.25% (v) trypsin-0.0.3% (v) EDTA, diluted with fresh medium, and counted for experimental purposes.
To determine the individual and the combined toxicities of the metals, MCF 7 cells were seeded in black sterile 96-well (1 × 10⁴ cells/well) plates and placed in a CO2 incubator for 24 hours for attachment. After the incubation period, cells were exposed to serial dilutions of the individual and the composite mixture prepared in MEM (without phenol) supplemented with 5% penicillin-streptomycin. The highest concentration for the individual chemicals was 80 mg/L. The mixture of the four metals was made by mixing As, Cd, Hg, and Pb stock solutions in the ratio of their EPA MCL 10 : 5 : 2 : 15, respectively, representing a starting concentration of 20, 10, 4, and 30 mg/L, respectively. The first row of each plate was used as control (medium without cells), and the second row was used as negative control (cells without metals). Treated cells were incubated for 24 hours.
2.2. Cell Viability Test by Fluorescence Diacetate (FDA) Dye-Spectrofluorometric Method
Treated cells were taken out of the incubator, exposure media was removed, and cells were washed with 100.0 μL PBS. This procedure was done carefully to avoid detaching cells from the bottom of the wells. Each of the wells was then treated with 100.0 μL of the diluted working FDA solution (10 μg/mL). The treated plates were placed in the incubator for 45 minutes. This allowed the surviving cells to be stained by the FDA giving them a fluorescent green color. Cell culture plates were read with Fluoroskan Ascent FL 374 (ThermoLabsystems , Finland), and the readings converted to percent survival by comparing each reading to the nonexposed controls. Sigmoidal model logistic (3 parameters: (y = A/(1 + exp(B-Dx)), where y = response, x = concentration, and A, B, and D are the 3 parameters) was used to fit the data. Based on the data, the 3 parameters (A, B, and D) were estimated, and an equation was generated for each curve fitted. Concentration addition was used for the determination of toxicity of a mixture of chemicals expected to exhibit a combined effect. II = (4, i = 1∑(Ci/LCxi)) = 1, where II is the interaction index, LCxi is the concentration of the ith mixture component that elicits x% effect when applied singly, and Ci is the concentration of the respective metal in the mixture when the mixture elicits the same effect. Each (Ci/LCxi) is the concentration of a mixture component scaled for its relative toxicity generally termed Toxic Unit (TU) of that component [19].
Using Statistix appropriate statistical tools were applied to the results to determine significant differences among the means of the various toxicities, as well as to determine the existence and nature of trends in the treatment level means. Regression analysis was done to determine the correlation between the interaction index and the concentration of the metals.
3. Results
Individual cytotoxicities of the four metals As, Cd, Hg, and Pb showed concentration-dependent effects on MCF 7 cells (as shown Table 1). Hg was found to be the most toxic followed by Cd, As, and Pb in descending order of toxicity. The mean LC50 for Hg, Cd, As, and Pb were 0.565, 0.745, 1.65, and 24.5 mg/L, respectively. The order of toxicity of the four metals remained the same at various LCs estimated. The coefficient of variation (CV) ranged from 1.97% to 37.29% indicating good repeatability. There was higher variability in the mean lethal concentrations at lower concentrations than at higher concentrations. Hg showed the highest variability.
| LCx | Concentration (mg/L) | |||
|---|---|---|---|---|
| As | Cd | Hg | Pb | |
| LC20 | 0.22 ± 0.07 | 0.387 ± 0.003 | 0.11 ± 0.04 | 11 ± 3 |
| LC30 | 0.78 ± 0.02 | 0.52 ± 0.05 | 0.30 ± 0.07 | 16 ± 3 |
| LC40 | 1.22 ± 0.08 | 0.64 ± 0.06 | 0.4 ± 0.1 | 20 ± 2 |
| LC50 | 1.6 ± 0.1 | 0.74 ± 0.06 | 0.6 ± 0.1 | 24 ± 2 |
| LC60 | 2.1 ± 0.2 | 0.85 ± 0.07 | 0.7 ± 0.1 | 28 ± 1 |
| LC70 | 2.6 ± 0.3 | 0.97 ± 0.07 | 0.9 ± 0.2 | 32 ± 1 |
| LC80 | 3.3 ± 0.4 | 1.12 ± 0.08 | 1.1 ± 0.2 | 37 ± 1 |
The concentrations of each metal in the composite mixture eliciting LC20 to LC80 are shown in Table 2. The following ranking for toxicity of metals in the mixture was obtained: Hg > Cd > As > Pb. The percent mortality of cells increased with increasing concentration of the metal mixture. CVs ranged from 7.24% to 13.36% indicating high repeatability. As expected, all the metals demonstrated significantly (P = .0003) higher toxicity when they were in mixtures than when they were administered individually (Tables 1 and 2).
| LCx | Concentration (mg/L) | |||
|---|---|---|---|---|
| As | Cd | Hg | Pb | |
| LC20 | 0.11 ± 0.02 | 0.056 ± 0.008 | 0.022 ± 0.003 | 0.17 ± 0.02 |
| LC30 | 0.31 ± .02 | 0.15 ± .01 | 0.061 ± 0.004 | 0.46 ± 0.03 |
| LC40 | 0.47 ± 0.04 | 0.23 ± 0.02 | 0.093 ± 0.008 | 0.70 ± 0.06 |
| LC50 | 0.62 ± .06 | 0.31 ± 0.03 | 0.12 ± 0.01 | 0.92 ± 0.09 |
| LC60 | 0.77 ± 0.08 | 0.38 ± 0.04 | 0.15 ± 0.02 | 1.1 ± 0.1 |
| LC70 | 0.9 ± 0.1 | 0.48 ± 0.05 | 0.19 ± 0.02 | 1.4 ± 0.2 |
| LC80 | 1.1 ± 0.1 | 0.57 ± 0.06 | 0.23 ± 0.03 | 1.7 ± 0.2 |
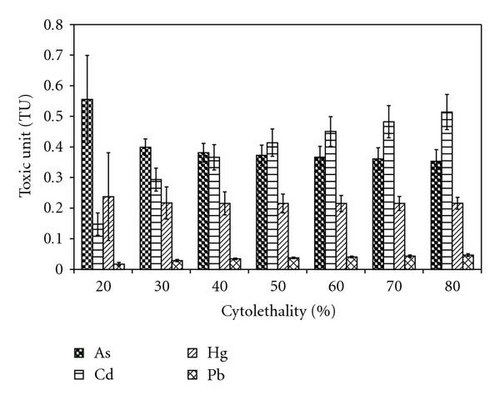
Toxic units (TU) for various LCs were estimated by scaling the concentration of each mixture component for its relative toxicity. Results are shown as a histogram in Figure 1. The values for Cd increased with increasing concentration, while those for As decreased with increaseing concentrations. The values for Hg and Pb did not change over the concentration range used in this study (Figure 1). Pb had the lowest mean TU values (0.0353) followed by Hg (0.218), Cd (0.381), and As (0.398). From Figure 1, TU values for As and Cd showed higher variability at lower concentration, and As appeared to contribute more to the toxicity of the mixture (higher TU value) than all the other components of the mixture. At higher concentrations, Cd became the highest contributor to the toxicity of the mixture. All the TU values for each of the metals at all the LCs were lower than one indicating synergistic effects.

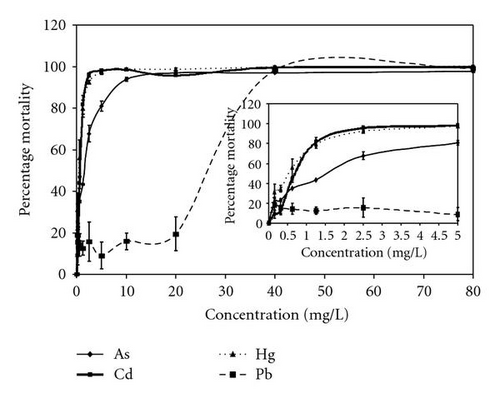
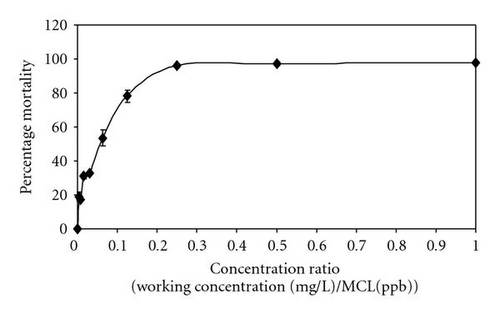
By using randomized complete block analysis of variance, the mean values of the interaction indices (II) calculated from TU values showed significant (P = .0036) differences among the various LCs. At lower concentrations, the mean of the interaction indices was less than one (LD20, II = 0.86) indicating a synergistic effect among the four metals tested. The interaction at higher concentrations is more than one (LD80, II = 1.13) indicating an antagonistic effect among the four metals tested. Although the II values did not differ significantly from unity, Tukey all pairwise comparison showed three categories of II values, and also there was a general increase in the interaction index with increase in concentration. The concentration-response curves generated for the single metals and their composited mixtures are shown in Figures 2(a) and 2(b). It could be seen that Pb showed significantly less toxicity compared to the rest of the metals.


4. Discussion
The results of this study clearly showed that the four metals (As, Cd, Hg, and Pb) were more toxic when they were present in combination than when administered individually. At all percentage effects tested, the concentrations estimated for individual toxicity were higher than the concentrations for combined toxicity. The toxicities (LC50) of the four metals As, Cd, Hg, and Pb in mixture for 24-hour exposure were 3, 3, 4, and 27 times higher than their individual toxicities, respectively (Tables 1 and 2). The toxicity of Pb (the least toxic metal among the four) was enhanced by several fold when in combination with the four metals. This indicates that the cell detoxification process has been compromised by other components of the mixture leading to increased toxicity of Pb. This agrees with the observation made by Swiergosz-Kowalewska et al. [13]. They observed a negative correlation between Cd level and GSH/GSSG ratio but positive correlation between lead level and GSH/GSSG ratio and no significant effect of Pb level on GSH. Also GSH-Cd complex has been reported to prevent intensive uptake of Cd by cells [20, 21].
It has been suggested that either GSH or MT or both may play a major role during antagonistic interactions among metals [12]. Antioxidative response (GSH and MT synthesis) to metal intoxication in cells increases with increase in metal concentration [12–15]. The general increase in interaction index with increase in a concentration could be ascribed to the above observations. There was a positive correlation (R2 = 0.946 at 95% confidence level) between interactive indices and concentration of the metals. Results also showed differential interaction among the four metals on MCF 7 cells in a concentration-dependent manner. At lower concentration, the interaction index was less than unity indicating synergistic interaction among the metals. As the concentration increased, the interaction changed from synergistic to additive and finally antagonistic. Although the interaction indices were not significantly different from unity, this increase in interactive indices in concentration-dependent manner cannot be ascribed to experimental variability alone due to the positive correlation observed between the concentration and the interaction indices. Also, the trend observed was partially consistent with results reported by Bae et al. [12] where antagonistic effects were seen at higher concentrations and synergistic effects at lower concentrations. At higher concentration of the metals, there is an increased level of detoxifying protein thereby reducing the joint toxicity of the four metals [22, 23].
The mechanisms and the level of interaction of the four metals on MCF 7 cells need to be fully established. To this end, further work is underway to profile the level of GSH and MT in the cells with respect to the increasing concentrations of the metals. Additional tests will also involve elimination of one of the four metals at a time to identify the level of interaction. Presently, studies being conducted on cells with altered levels of GSH and/or MT to further explain the relevance of detoxifying molecules in the interaction of the mixture of metals are nearing completion.
In summary, a combination of As, Cd, Hg, and Pb in the proportion of their MCLs showed three types of interactions in MCF 7 cells in a concentration dependent-manner. The combined toxicity changed from synergistic to additive to antagonistic with increasing concentrations of the metal mixture. These studies showed that multiple nonessential metals can exhibit differential interactions in the environment and lead to complications in predicting health risk to the environment.


