Simulation of Weld Bead Geometry in GTA Welded Duplex Stainless Steel (DSS)
Abstract
Temperature analysis of GTA welding of Duplex Stainless Steel material (2205) is simulated using ANSYS software by finite element technique taking in account the characteristics and advantage of GTAW than other sources. A travel heat source combined with body loads was designed by analyzing thermal physical parameters, latent heat of fusion of material. Modeling was carried out by using solid modeling and direct generation technique. A residual control method was taken for precise node selection, Simulation was done by varying the parameter of GTA, welding speed. The quasisteady state temperature field of GTA welding was simulated with the FEA software—ANSYS as well as tests. The objective of this work is to compare the experimentally obtained weld bead geometry of DSS material with simulated results from ANSYS software for various weld parameters. The higher the value of joining efficiency is, the less heat energy is spent on unnecessary heating-that is generating a heat affecting zone (HAZ) or distortion. Joining of two metals or alloys is important in every aspect of engineering which leads to welding in an effective manner and carrying out the analysis. The experimental analysis shows that the model is showing good agreement with the experimental results. Comparison of the experimental and simulated results shows the maximum deviation of 1.27% and 10% for calculating bead width and depth of penetration, respectively.
1. Introduction
Fusion welding involves heating by an intense heat source, melting and solidification of parent metals, and often, addition of filler material in the localized fusion zone. The heat source causes nonuniform temperature distributions across the joint and the parent metals. The computational weld pool models have become a significant route for a priori estimation of peak temperature, weld pool dimensions, cooling rate, and several other associated aspects of the weld pool and the surrounding heat-affected zone [1–4]. In particular, finite element method-based weld pool models are found very useful to predict weld thermal cycle and fluid flow pattern at an early stage of product design and welding process development [5–7]. However, the complexity of welding processes itself and the complex geometry of real engineering components have made the prediction of weld thermal cycle and corresponding flow field a very difficult task. It is further noted that the accuracies of these quantitative calculations largely depend on the accuracy of several input parameters. Some of these input parameters are also uncertain in nature, and of late, optimization algorithms are integrated with the numerical process model to find suitable values of these uncertain input parameters for modeling calculations [8].
It is axiomatic that the development of effective simulation tools requires accurate analysis of thermal history during welding and a good understanding of the effect of process parameters on temperature distributions and variations. Experimental observation of the same is very difficult because direct measurement of temperatures in the weld pool by placing thermocouples is cumbersome and inaccurate because of small size of the weld pool and very high temperature [9–11]. Indirect measurement using infrared cameras entails high degree of uncertainty due to many assumptions needed to be made with respect to the dependency of emissive on the temperature, the associated angle, and the wavelength. Currently, no reliable technique exists with respect to the measurement of temperature within the molten pool. On the other hand, the measurement of liquid flow velocities in the small and intensely heated weld pool is even more difficult than that of temperatures [12]. Therefore, a practical recourse is to utilize quantitative calculations to gain insights into the phenomena of heat transfer and fluid flow during welding.
The analytical solutions in fusion welding are aimed at achieving closed form solutions of the governing partial differential equations of conservation of energy. The nonlinearity arising out of temperature dependent material properties, radiation heat transfer at the boundary, and complex geometry of the domain poses further problems in solving the problem by analytical methods. However, the analytical models can still be of great help for situations like online process control where weld pool dimensions, cooling rates, and so forth can be computed faster. Analytical solutions of temperature distribution were mainly restricted due to the consideration of welding arc as a point heat source, assumption of constant material properties, and the neglect of latent heat [13–17]. The accuracy of the results in predicting transient temperature field, peak temperatures, and cooling rate is poor due to these inherent simplifications in the analytical models. Subsequently, numerical models were developed that could consider a distributed heat source with a Gaussian distribution in contrast to a point heat source. Many of these models faced difficulties to take into account the heat transport within weld pool within the scope of conduction mode of heat transfer. A volumetric heat source of ellipsoidal or double ellipsoidal shape was proposed further to account for the heat transport inside the weld pool. However, the mathematical expression for that volumetric heat source term contained a number of geometrical parameters that were required to be calibrated first by comparing the computed weld dimensions with the corresponding experimental results. This is ironic since numerical models are supposed to predict weld dimensions for a given welding condition thereby reducing the overall volume of costly experiments and guiding actual design for welding process [18–21].
Significant efforts are also reported toward modeling of convective heat transport in weld pool through the solution of continuity, momentum, and energy equations. In particular, the efforts reported by DebRoy et al. are worth mentioning. These authors used three-dimensional heat transfer and fluid flow analysis based on finite volume method to model heat transfer and fluid flow in weld pool [22–28]. They further attempted to identify suitable time-averaged values of various uncertain input parameters, which were required for the modeling calculations, through a novel approach [25–28]. The objective of this work is to compare the experimentally obtained weld bead geometry of DSS material with simulated results from ANSYS software for various weld parameters.
2. Mathematical Model
The first step in the simulation of GTA welding process is the estimation of temperature profiles using a moving heat source. This becomes important because the welded structure is loaded by thermal strains developed due to uncontrolled expansion and contraction which is associated with the nonuniform temperature distribution. Transient thermal analysis is used to determine temperatures and other thermal quantities for time varying thermal loads. The temperature dependent material properties are considered which make the process nonlinear.
The initial condition is
The essential boundary condition is
This condition prescribes nodal temperatures at the flow inlet. The natural boundary condition can be defined by
3. Material Properties
Duplex stainless steels are iron-based alloys containing at least 23.37% chromium and 5.74% nickel. They achieve their Duplex stainless characteristics through the formation of an invisible and adherent chromium rich passive oxide film. Alloy 2205 is a general-purpose Duplex stainless steel with an austenitic and ferritic structure. It is essentially nonmagnetic in the annealed condition and can only be hardened by cold working. The lower carbon content compared with other alloy steels gives better corrosion resistance in welded structures. Duplex stainless steel is the most widely used metal for industrial fabrications at the present time, due to its strength, its workability under fabricating methods, and its relatively low price. The melting point of Duplex stainless steel ranges from 1600 to 1800 °C. The chemical composition of UNS S31803 Duplex stainless steel (2205) and temperature dependent material property (thermal conductivity) used in this work are given in Table 1.
| Element | C | S | P | Si | Mn | Cr | Ni | Mo | N |
|---|---|---|---|---|---|---|---|---|---|
| Weight % | 0.020 | 0.025 | 0.021 | 0.4 | 1.52 | 22.37 | 5.74 | 2.85 | 0.171 |
In the process of GTA welding, heat flows into the materials being joined and sometimes may cause serious metallurgical changes in the welded structure, which may lead to the early failure of the component. Study of thermal cycles will be the basis for many other analysis like prediction of distortion and residual stresses, metallurgical analyses, surface discoloration studies, and so forth. Hence, the study of heat flow temperature distribution in the parts being welded becomes necessary. With the advanced computing field and development of numerical techniques like finite element methods, it is now possible to model complicated configurations and loadings which vary with respect to location and temperature and functions of time for any given weldment. The solutions are easily obtained which were difficult earlier. Computer-based simulations offer the possibility to examine different aspects of the process without having a physical prototype of the product. In this work, main parameters of the GTA welding process are considered, and the finite element simulation is performed using ANSYS version 10.0. The material used for the study is Duplex stainless steel.
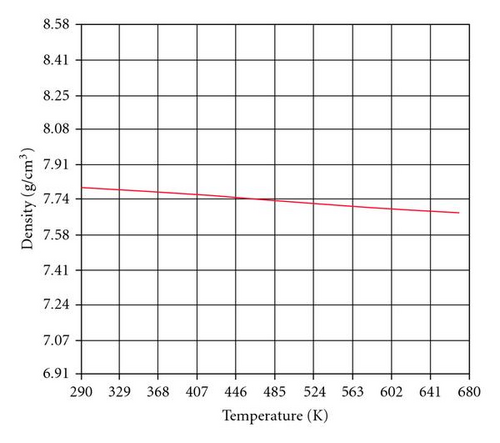
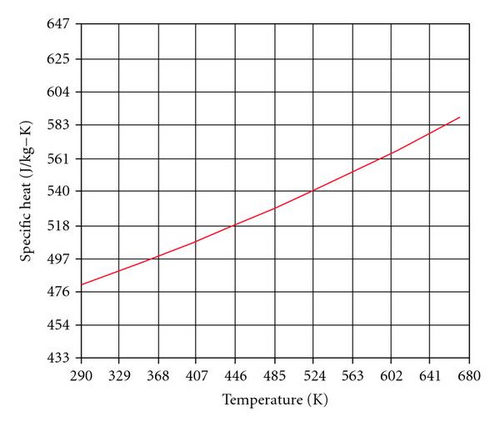
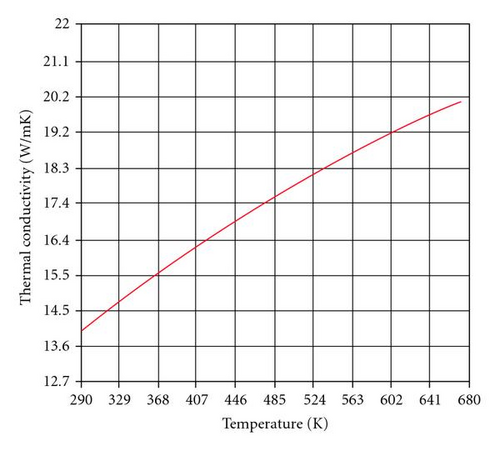
The material properties of duplex stainless steel 2205 (UNS S31803) like thermal conductivity, density, and specific heat employed in this work are given in Table 2 and Figures 1, 2, and 3. These temperature dependent material properties were taken as an input value, for this simulation work. This work was carried out by using ANSYS 10.0 software to simulate the temperature distribution of the weldment. The convection film coefficient which includes the effect of convection and radiation was obtained from the equation h = 2.41 × 10⁻³∈ T1.61 (W/m2 °C). All the properties are considered to be temperature dependent and listed in [1]. From the specific heat listed in the table, enthalpy values are calculated, taking into account the latent heat of fusion in the melting temperature range.
| Sl.no | Temperature K | Thermal conductivity W/m-K | Specific heat J/Kg-K | Density Kg/mm3 |
|---|---|---|---|---|
| 1 | 293 | 14 | 470 | 7.84 |
| 2 | 373 | 15 | 500 | 7.71 |
| 3 | 473 | 17 | 530 | 7.78 |
| 4 | 573 | 18 | 560 | 7.68 |
3.1. Definition of Boundary and Initial Condition
4. Finite Element Model
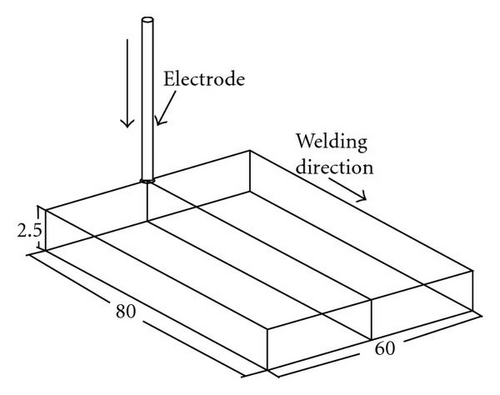
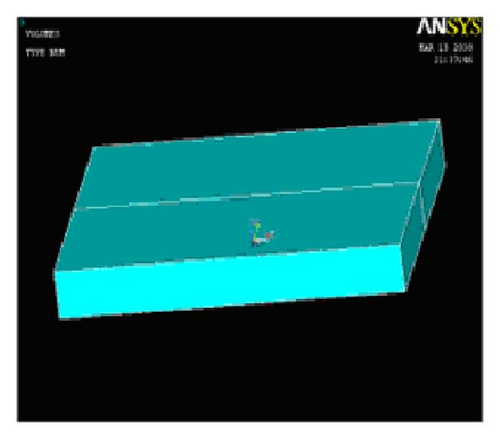
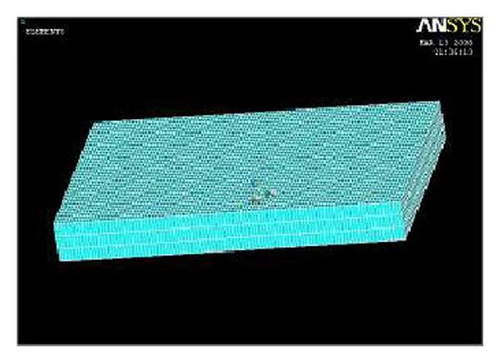
The model for finite element analysis can be generated by any of the two techniques, namely, ( 1). solid modeling technique and ( 2). direct generation technique in solid modeling; the models are created using geometric primitives, which are fully developed 1ines, areas, and volume. The solid model is meshed to get the finite element model. Direct generation method is convenient for small and simple models and also provides complete control over the geometry and numbering of every node and every element. In this work, direct generation technique was adopted. The weld plate is modeled using solid 70 elements directly. The element sizes are made finer in the weld zone, since the temperature gradient is very high (stress concentration), and coarser elements are used away from the weld center line [3–5]. Along the depth direction 4 elements were used . A long the welding direction 300 divisions were made, and in the transverse direction 32 divisions are made as shown in Figures 4, 5, and 6.
5. Results and Discussions
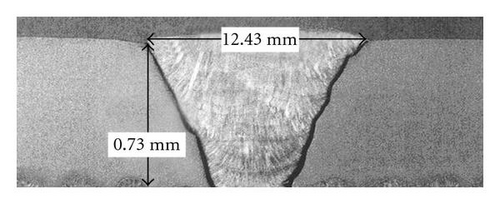
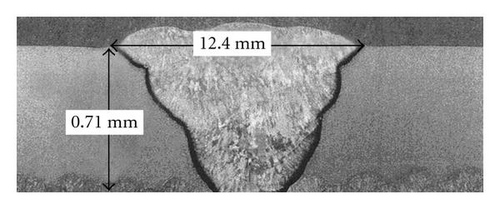
By conducting the experimental work, the following parameters are chosen and shown in Table 3. After welding, the samples were measured (weld bead width and depth of penetration), and the values are presented in Table 5, and the figures are shown in Figures 7(a) and 7(b). From Table 5, it can be understood that while increasing the heat input, the bead width and depth of penetration are also increasing.
| Trial | Current (A) | Voltage (V) | Travel speed (mm/min) | Heat input (J/mm) | Bead width (mm) | Bead depth (mm) |
|---|---|---|---|---|---|---|
| 1 | 11.5 | 135 | 110 | 846.810 | 12.43 | 0.73 |
| 2 | 11.5 | 135 | 108 | 862.500 | 12.40 | 0.71 |
| 3 | 11.5 | 135 | 106 | 878.700 | 12.39 | 0.71 |
| 4 | 11.5 | 135 | 104 | 895.600 | 12.35 | 0.70 |
| 5 | 11.5 | 135 | 102 | 913.200 | 12.34 | 0.70 |
This present work is to find the temperature distribution during TIG welding process in duplex stainless steel 2205 sheet and find the weld bead geometry. This work mainly concentrates on the thermal cycles experienced on the input process (varying) of 102–110 Joules/mm with an interval of 2 Joules/mm. The transient thermal analysis has been performed using finite element method. The thermal cycles at various locations from the weld and the temperature distribution for various time intervals were studied. From the simulated results, the corresponding weld bead geometry is also measured.
It is observed that bead width and depth of penetration are strongly affected by arc exposure time in case of TIG welding. Arc power and welding speed have significant effect on the weld bead profile. The simulation work is carried out during ANSYS 10.0, and results are compared with predicted and experimental results.
The heat input plays a major role in deciding the mode of welding process. It is important to have sufficient irradiance to melt the metal. If the heat input is insufficient, only surface melting takes place and may also causing distortion in the weld plate. Heat input is obtained from the arc power and welding speed at which it is traversing over the weld plate. Proper selection of process parameters (heat input) may give good weld bead geometry, good mechanical, and metallurgical properties.
By simulating the TIG welding of duplex stainless steel sheet, the following various parameters were taken, and conducting the simulating trials and the parameters is shown in Table 4.
| Trial | Current (A) | Voltage (V) | Travel speed (mm/min) | Heat input (J/mm) |
|---|---|---|---|---|
| 1 | 135 | 11 | 110 | 846.810 |
| 2 | 135 | 11 | 108 | 862.500 |
| 3 | 135 | 11 | 106 | 878.700 |
| 4 | 135 | 11 | 104 | 895.600 |
| 5 | 135 | 11 | 102 | 913.200 |
| Sr. no | Travel speed mm/min | Heat input J/mm | Bead width (mm) | Depth of penetration (mm) | ||||
|---|---|---|---|---|---|---|---|---|
| Exp | FEM | %Error | Exp | FEM | % Error | |||
| 1 | 110 | 846.81 | 12.43 | 12.31 | 0.96 | 0.73 | 0.69 | 5.47 |
| 2 | 108 | 862.5 | 12.4 | 12.28 | 0.96 | 0.71 | 0.66 | 7.04 |
| 3 | 106 | 878.7 | 12.39 | 12.24 | 1.21 | 0.71 | 0.66 | 7.04 |
| 4 | 104 | 895.6 | 12.35 | 12.19 | 1.29 | 0.7 | 0.64 | 8.57 |
| 5 | 102 | 913.2 | 12.34 | 12.17 | 1.37 | 0.7 | 0.63 | 10 |
Figures 8(a) and 8(b) show temperature distribution along the width of the plate for the first trial presented. The heat input 846.810 J/mm is given as for the first trail. Heat input is applied for 0.25 second time step at a single node, and the results are captured. Heat input is applied for 0.25 second for all the samples, and temperature distribution, weld bead width, and depth are calculated. The melting temperature of duplex stainless steel is 1800 K, and the region below this temperature is the weld metal region.
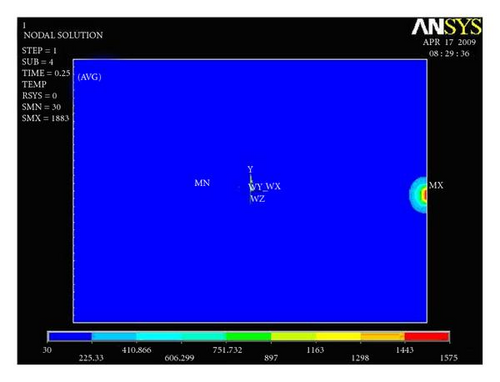
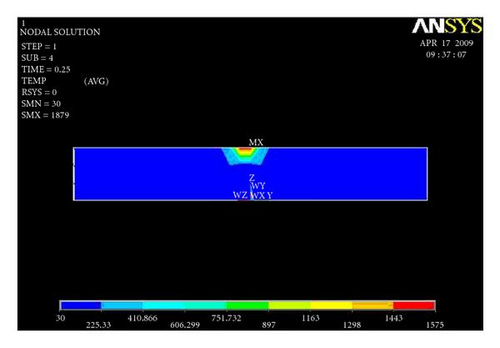
Figures 9(a) and 9(b) show temperature distribution along the width of the plate for the first trial presented. For the first trial, the heat input 862.500 J/mm is given as an input. Heat input is applied for 0.25 second time step at a single node, and the results are captured.
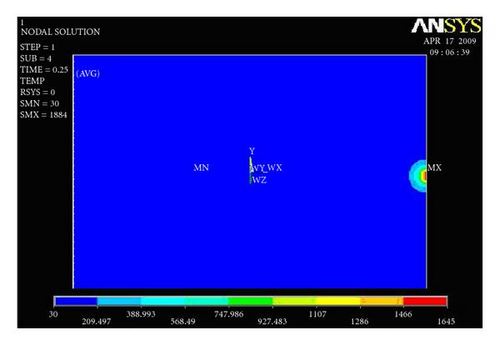
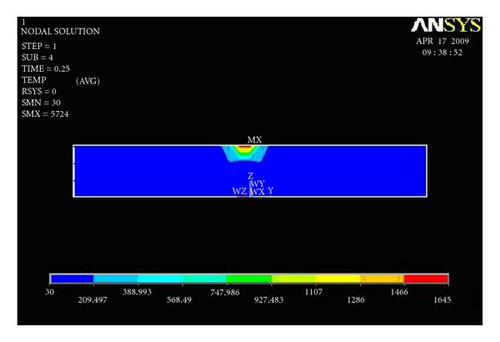
Figures 10(a) and 10(b) show temperature distribution along the width of the plate for the first trial presented. For the first trial, the heat input 878.700 J/mm is given as an input. Heat input is applied for 0.25 second time step at a single node, and the results are captured.
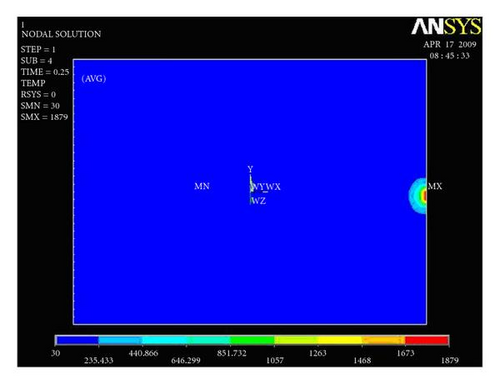
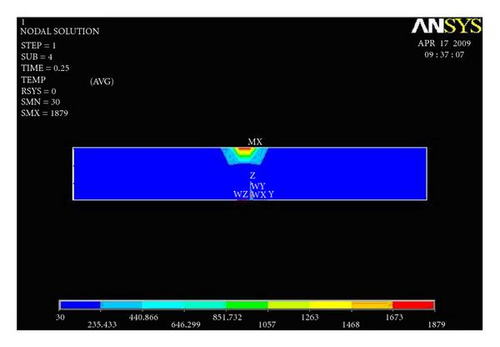
Figures 11(a) and 11(b) show temperature distribution along the width of the plate for the first trial presented. For the first trial, the heat input 895.600 J/mm is given as an input. Heat input is applied for 0.25 second time step at a single node, and the results are captured.

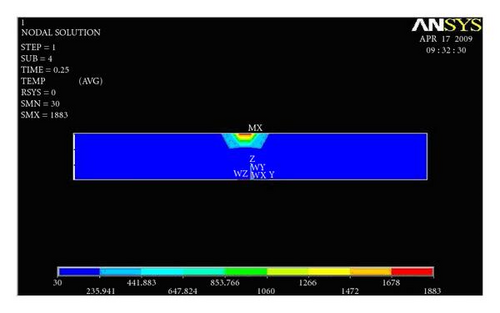
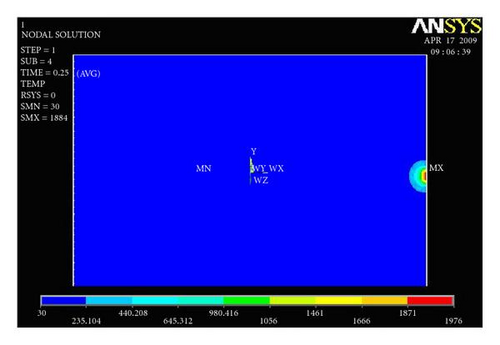
Figures 12(a) and 12(b) show temperature distribution along the width of the plate for the first trial presented. For the first trial, the heat input 913.200 J/mm is given as an input. Heat input is applied for 0.25 second time step at a single node, and the results are captured.
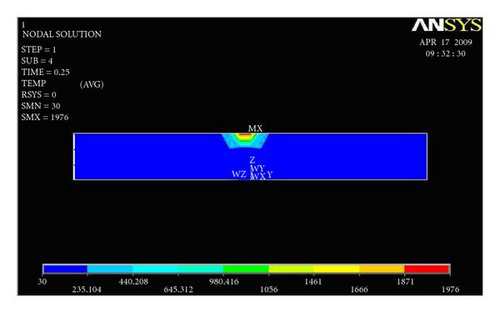
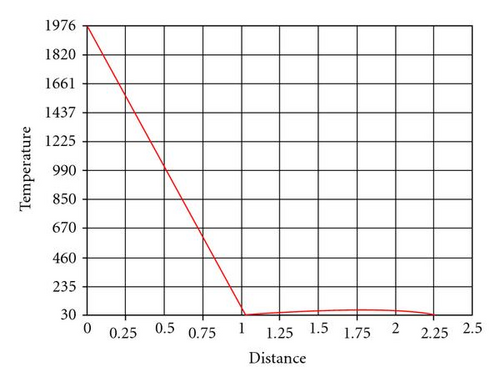
From Figure 13, the temperature verses width of the welded plate graph is presented. Here the region 1800 K is melting temperature of duplex stainless steel. The width of this region is observed as 12.19 mm and depth as 0.64 mm. This result has been captured by giving heat input of 895.600 J/mm to a single node, and temperature distribution is plotted in Figures 13(a) and 13(b).
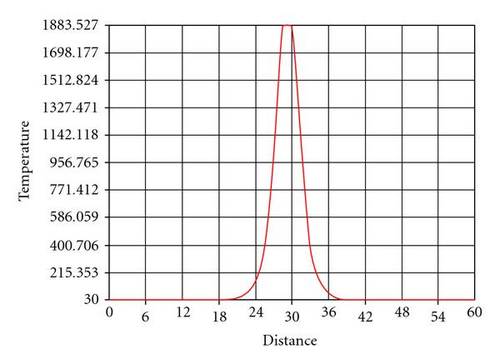
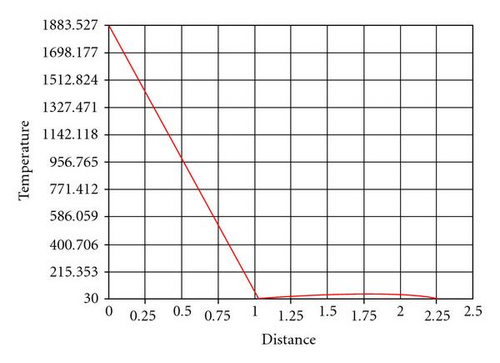
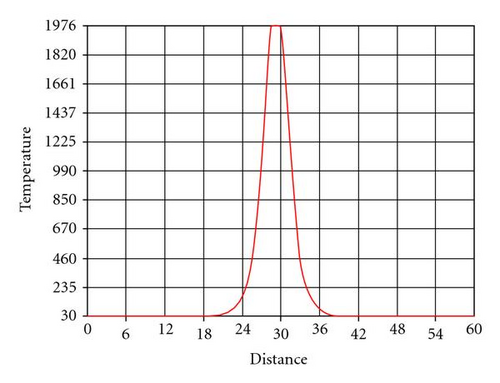
From Figures 14(a) and 14(b), the temperature versus width of the welded plate graph is presented. Here the region 1800 K is melting temperature of duplex stainless steel. The width of this region is observed as 12.34 mm and depth as 0.63 mm. This result has been captured by giving heat input of 913.200 J/mm to a single node, and temperature distribution is shown in Figures 14(a) and 14(b).
5.1. FEM Analysis Versus Experimental Results
The weld bead geometry of duplex stainless steel simulation results is compared with experimental results as shown in Table 5.
Transverse temperature plots are used for finding the depth of penetration, and longitudinal temperature plots are used to find the bead width of the weld bead. For three-dimensional modeling, very fine mesh is chosen in order to achieve good results. Comparing experimental and analyzing results, the percentage (%) error is very significant. It is evident that the weld bead width and depth of penetration values remain almost equal comparing with experimental values.
6. Conclusion
A finite element method based on the transient thermal elastic plastic model has been successfully developed and applied for the welding of duplex stainless steel sheets. The material parameters for the duplex stainless steel material are assumed to be temperature dependent. The other phenomena like distributed arc heat input, heat loss, and so forth have been accounted in the model. The finite element analysis of the partially welded sheet has been validated through experimental trials.
The FEM model was simulated as per the designed matrix, and various temperature contours, time temperature history plots, melting point isotherms for weld bead profile were obtained to study the effect of various process parameters on weld bead dimensions.
Finally we conclude the following.
- (1)
The percentage (%) error is also very less for all the five trials.
- (2)
If varies the time step, the temperature distribution also varies.
- (3)
The depth of penetration and bead width increase with the increase in heat input.


