Cluster analysis of contaminated sediment data: Nodal analysis
Abstract
The objective of the present study was to explore the use of multivariate statistical methods as a means to discern relationships between contaminants and biological and/or toxicological effects in a representative data set from the National Status and Trends (NS&T) Program. Data from the National Oceanic and Atmospheric Administration, NS&T Program's Bioeffects Survey of Delaware Bay, USA, were examined using various univariate and multivariate statistical techniques, including cluster analysis. Each approach identified consistent patterns and relationships between the three types of triad data. The analyses also identified factors that bias the interpretation of the data, primarily the presence of rare and unique species and the dependence of species distributions on physical parameters. Sites and species were clustered with the unweighted pair-group method using arithmetic averages clustering with the Jaccard coefficient that clustered species and sites into mutually consistent groupings. Pearson product moment correlation coefficients, normalized for salinity, also were clustered. The most informative analysis, termed nodal analysis, was the intersection of species cluster analysis with site cluster analysis. This technique produced a visual representation of species association patterns among site clusters. Site characteristics, such as salinity and grain size, not contaminant concentrations, appeared to be the primary factors determining species distributions. This suggests the sediment-quality triad needs to use physical parameters as a distinct leg from chemical concentrations to improve sediment-quality assessments in large bodies of water. Because the Delaware Bay system has confounded gradients of contaminants and physical parameters, analyses were repeated with data from northern Chesapeake Bay, USA, with similar results.
INTRODUCTION
Each species is adapted to particular physical and chemical environments within the habitat. Each species has evolved to fit together with certain other species in ways biologists are only beginning to understand.
—E.O. Wilson, 2002 [1]
The physical and chemical features of habitats have a profound affect on our ability to subset them into statistically repeatable units and to establish reference sites and test sites for assessing the condition of resident biota. One of the most variable and dynamic habitats (and, therefore, among the most difficult to assess) is an estuary. The estuarine habitat is a mosaic of various gradients that change over time and space, though not necessarily in the same magnitude or direction. Thus, trying to discern the fingerprint of contaminant effects is particularly difficult when their distribution is confounded with physical and chemical gradients.
Many authors have addressed the problem of how to assess the condition of estuarine biological communities and how to represent quantitatively their assessments. Basic biological measurements, such as species richness or abundance, are simplistic but informative. Derived indices (e.g., diversity, evenness) are more robust. However, they are potentially flawed as predictive tools, because distinctly different communities may be equivalent mathematically.
A great deal of effort has gone into development of an index of biotic integrity (IBI) for estuarine benthic communities. This approach has been applied successfully to many habitats [2]. Application of the method includes scoring metrics in discernable cause-effect gradients. This allows Karr's original application to work well in streams and other habitats with discernable gradients, but the highly variable and open-ended nature of the estuarine environment has rendered strict application of the approach nearly impossible because of confounded parameters. In response to this difficulty, a variety of investigators [3-6] have developed IBIs by defining sites as either impacted or unimpacted based on measured chemical benchmarks, dissolved oxygen stress, and/or toxicity using discriminant or other statistical methods. Metric scores based on percentile ranks are formulated from the distribution of a pool of potential community attributes of the sites. These are arbitrarily assigned values that are combined into an index. The index is then tested by applying it to a new set of sampling sites and determining if the sites are allocated correctly to the impacted or unimpacted category based, again, on the a priori measure benchmarks. The shortcoming in this approach is that the actual range and slope of response of metrics in a gradient is lost, because no gradient is found in the derivation data set, just impacted or nonimpacted thresholds. Also, in practice, the metrics have been developed with data over wide geographic and habitat ranges that reduce predictive acuity. Development of an estuarine IBI for the mid-Atlantic region [7, 8] has addressed, at least partially, this shortcoming by selecting different metrics from the pool of attributes for each of five salinity zones. However, some zones, notably the freshwateroligotrohaline zone, have resulted in relatively poor predictive capability.
Another approach, known as the sediment-quality triad [9], has received considerable attention. This approach is a tool for assessing benthic habitats in terms of their community characteristics, observed toxicity, and chemical contamination loads. A variety of attempts to use the approach in a more quantitative fashion have been proposed [10, 11]. However, to our knowledge, the inherently multivariate nature of the triad approach has not been exploited with multivariate statistical methods [12].
As part of the National Status and Trends (NS&T) Program, the National Oceanic and Atmospheric Administration (NOAA) gathers sediment chemistry, toxicity, and benthic community data in estuarine and coastal systems throughout the United States. Data have been gathered over large areas, though on a system-by-system basis. One of the objectives is to assess the spatial extent of areas that are impacted by chemical contamination, not to identify gradients per se. The objective of the present study was to explore the use of multivariate statistical methods as a means to discern relationships between contaminants and biological and/or toxicological effects in a representative data set from the NS&T Program. If a multivariate statistical approach can be demonstrated that identifies a pattern of how contaminated sites group together, would that method also reveal a pattern of community impact that could be used as a predictive tool for monitoring and assessing contaminant impacts in estuarine habitats? Alternatively, can the methods be used to distinguish between contaminated habitats and poor habitats that occur naturally? If it is possible to eliminate/normalize for these parameters, will a purely chemical response signal become apparent that is different than impacts from naturally occurring stressors, such as salinity transitions? The utility of this investigation is to provide information to regulatory agencies and local stakeholders regarding how to prioritize and monitor cleanup efforts in contaminated areas and as a predictive tool to guide restrictions on releases and watershed land-use activities that lead to degraded coastal habitats. Our ultimate objective is to develop a quantitative factor that can be used as a stand-alone indicator or as a guiding parameter in the framework of the other schemes, such as an IBI or the sediment-quality triad. This paper discusses our initial results concerning the best approach to delineate habitats based on the resident organisms, which act as integrators of habitat properties.
MATERIALS AND METHODS
The data were taken from the 1997 NS&T sediment bioassessment of Delaware Bay, USA. Seventy-three stations in 18 strata were sampled in the Delaware Bay system to determine the spatial extent of sediment contamination and toxicity (Fig. 1). Strata were designated to divide the system into consistent habitat types. Site locations ranged from tidal fresh areas below the fall line (stations 1–18); through the mixing zone (stations 19–27), upper estuary (stations 28–38), and the lower estuarine system (stations 39–61); and onto the coastal zone (stations 62–73). Several sites located in small tributaries also were sampled. Sediment samples were composited from the top 3 cm of sediment collected with a Young-modified Van Veen grab sampler (T. Young, Sandwich, MA, USA). In addition, salinity, temperature, and dissolved oxygen measurements were made at the surface and bottom of the water column. Sediment subsamples were split for chemical analyses, physicochemical measurements, and a suite of toxicity bioassays. Bioassays included an amphipod (Ampelisca abdita) mortality test using whole sediment, sea urchin (Arbacia punctulata) fertilization, and development tests using pore water, a P450 human reporter gene, and Microtox response assays, the latter two using an organic extract from whole sediments. Measured chemical parameters included 44 polynuclear aromatic hydrocarbons (PAHs), 15 chlorinated pesticides plus DDT and its metabolites, 25 polychlorinated biphenyls, trace elements, and butyl-tins [13]. Other parameters included grain-size analysis, total organic carbon (TOC), and percentage solids. All methods followed routine NOAA, U.S. Environmental Protection Agency, and/or American Society for Testing and Materials methods [14-19]. A separate single sample was taken for benthic community analysis with a 0.04-m2 PONAR sampler (T. Young). The latter sample was sieved on site through a 0.5-mm mesh, and all organisms were preserved in buffered formalin for subsequent taxonomic identification. All sorted macroinvertebrates were identified to the lowest practical identification level, which in most cases was to the species level unless the specimen was a juvenile, damaged, or otherwise unidentifiable.
An abbreviated summary of the habitat conditions is included here to aid in understanding the analytical scheme and statistical results described below. Detailed summary statistics for all parameters on a site-by-site basis is available from the NOAA [13].
Habitat conditions
Sediment grain-size data and TOC for the 73 mainstem sites are shown in Figure 2. Sediment composition varied considerably, from 73% silt at station 3 to 99% or greater sand at some sites. The coastal zone sites were primarily sand with some gravel, and the lower estuarine sites were predominantly sand or silty sand. Approximately half the tidal fresh, mixing zone, and upper estuarine sites were dominated by silt/clay material. Station 56, near the mouth of the Delaware Bay, has an unusually large proportion of fine-grained material. It is in a protected area behind Cape Henlopen, near a temporary anchorage with a constructed breakwater for ships waiting to proceed to points north. The TOC fraction of the sediment ranged from 0.07% at station 64 to 3.28% at station 29. Concentrations of TOC were closely associated with the silt/clay fraction.
The water column was essentially fresh at stations 1 through 18. Salinity increased steadily through the estuary to the middle portion of the Delaware Bay. Stations in the lower Delaware Bay and extending out into the coastal zone sites were slightly diluted ocean water. Temperature was relatively uniform throughout the system, and hypoxic oxygen conditions were not observed at any station.
The tidal fresh portion of the study area is heavily contaminated with metals, pesticides, polychlorinated biphenyls, and PAHs. Selected portions of the mixing and upper estuarine zones also are contaminated between Philadelphia, Pennsylvania, USA, and the Chesapeake and Delaware (C&D), USA, canal. Contaminant concentrations vary greatly from station to station, depending on the exact location. Concentrations of chemical constituents were either all relatively high or all relatively low at a given site. That is, if metals, for example, were seen at high concentrations at a site, all the other contaminant classes were high as well. With two exceptions regarding tributyltin, at no site was one contaminant high and the others low. Sandy sites generally had lower concentrations of contaminants compared to sites with a significant proportion of silt/clay. Chemical concentrations at the lower estuary and coastal zone stations outside of the Delaware Bay proper were basically uncontaminated beyond trace levels.
Numerical sediment-quality guidelines developed by Long and Morgan [20] and by Long et al. [21], known as effects range-median (ERM) and effects range-low (ERL), express statistically derived levels of contamination, above which toxic effects would be expected to be observed with some level of frequency (ERM) and below which effects were rarely expected (ERL). The mean ERM quotient [22] is the average of the ratio of ERM values to sediment concentrations for each chemical. The mean quotient of the ERMs and observed contaminant concentrations were calculated on a site-by-site basis for all chemical classes for which ERMs have been produced (Table 1). Regarding those chemicals for which ERLs and ERMs exist, most of the tidal fresh sites exceeded one or more ERL. Sediment-quality guidelines for freshwater habitats have not been refined to the extent that ERLs and ERMs have been. MacDonald et al. [23] produced consensus-based sediment-quality guidelines for inland Florida, USA, waters. These values are generally, but not always, lower than the ERLs and ERMs. Approximately half the sites exceeded the ERL for individual high-weight PAHs. The ERM for aggregate low-weight PAHs was exceeded at several stations. Depending on which compound individual PAH concentrations exceeded the respective ERLs at 4 to 14 of the stations in the tidal fresh zone and at 1 to 4 stations in the upper estuarine zone. Total high-weight PAH concentrations exceeded the ERL at 14 tidal fresh and 6 upper estuarine sites. The latter sites were primarily in the vicinity of the southern Philadelphia metropolitan area and below the C&D canal. All but two samples from the tidal fresh zone exceeded the ERL for -dichlorodiphenyldichloroethylene (DDE). Seven samples exceeded the ERM for DDE. Twelve samples in the upper estuarine zone exceeded the ERL for DDE and/or total DDT, of which two also exceeded the ERM. The concentration of other chlorinated pesticides was dominated by chlordane and related cyclodienes. These compounds were found over a more widespread area compared to that for DDT. Metal concentrations were frequently above the ERLs in the tidal fresh and upper estuarine zone, but examples of concentrations above the ERMs were rare.

Sample stations and strata boundaries in Delaware Bay, USA, and coastal areas. C&D = Chesapeake and Delaware.

Grain size and percentage total organic carbon (TOC) distributions at Delaware Bay, USA, sampling stations.
A total of 231 taxa were enumerated. Of these, 131 were identified to species. Eight stations had 25 or more taxa (stations 72, 67, 66, 63, 58, 44, 43, and 42). Among all stations, 81 taxa were found to be unique to one station (i.e., found at one station only). Stations 72, 67, 66, 63, and 44 had high proportions of unique taxa. Also, these stations had high proportions of rare taxa that were defined as being found at only two stations (Table 2). The presence of unique and rare taxa were major contributors to the high taxa counts at these stations.
Abundance was highly skewed with respect to the density of individual taxa between stations (Fig. 3). Densities ranged from 59,700 organisms/m2 at station 58 to 75 organisms/m2 at station 24. The high-density stations generally were dominated by very large numbers of an individual taxon. The density of Ampelisca abdita was almost 42,000 organisms/m2 at station 58, which accounted for 70% of the organisms counted there, and Mediomastus accounted for an additional 21%. Abundance for all stations is shown in Table 3. Excluding the top 10th percentile of stations (stations 66, 60, 58, 57, 50, 44, 42, and 4), the mean abundance for total, tidal fresh, estuarine, and coastal zone stations was 265, 530, 215, and 135 organisms/m2, respectively. Sites that exhibited toxicity in one or more of the bioassays did not have low abundance, even excluding those species known to be pollution-tolerant.
Abundance and species diversity generally were lowest in the mixing zone as a consequence of low numbers of species. Mean diversity was higher in the coastal zone and estuarine sites below the mixing zone, but individual station values were highly variable in all zones.


| Station | No. exceeding ERL | No. exceeding ERM | ERM quotient |
|---|---|---|---|
| 1 | 25 | 1 | 0.56 |
| 2 | 16 | 0.27 | |
| 3 | 26 | 1 | 0.69 |
| 4 | 26 | 1 | 0.90 |
| 5 | 1 | 0.07 | |
| 6 | 14 | 0.25 | |
| 7 | 26 | 2 | 0.85 |
| 8 | 26 | 1 | 0.71 |
| 9 | 9 | 0.20 | |
| 10 | 12 | 0.39 | |
| 11 | 15 | 0.39 | |
| 13 | 28 | 2 | 1.38 |
| 14 | 9 | 0.15 | |
| 16 | 19 | 1 | 0.78 |
| 17 | 6 | 0.15b | |
| 18 | 6 | 0.16 | |
| 19 | 18 | 1 | 0.48 |
| 20 | 25 | 2 | 1.04 |
| 21 | 14 | 0.36 | |
| 22 | 4 | 0.14 | |
| 23 | 16 | 0.34 | |
| 24 | 7 | 0.21 | |
| 25 | 8 | 0.25 | |
| 26 | 7 | 0.21 | |
| 27 | 4 | 0.14 | |
| 28 | 2 | 0.13 | |
| 29 | 22 | 1 | 0.60 |
| 30 | 10 | 0.25 | |
| 31 | 2 | 0.13 | |
| 32 | 2 | 0.12 | |
| 33 | 2 | 0.11 | |
| 34 | 4 | 0.15 | |
| 35 | 3 | 0.19 | |
| 36 | 4 | 0.16 | |
| 37 | 3 | 0.14 | |
| 38 | 1 | 0.12 | |
| 57 | 5 | 0.18 | |
| 69 | 1 | 0.03 |
- a Stations with no chemicals exceeding the ERL or ERM are not listed.
- b Excluding polycyclic aromatic hydrocarbon data.
Analytical scheme
A variety of univariate and multivariate statistical analyses were performed on the data, including cluster analysis, principal component analysis (PCA), correlation analyses, and various regression techniques. Many of the multivariate analyses were exploratory in nature and performed to determine if they would yield usable results with this type of data and/or to assess new approaches to try to explain quantitatively the relationships between observed contaminant concentrations, toxicity, and community metrics. In addition to derivation of PCA factors, a technique known as extension analysis [25] was used to calculate the correlation of a particular set of variables not used in the PCA (e.g., station contamination) with the factors calculated from the PCA for another set of variables (e.g., community metrics). This was done to explore potential relationships between specific individual variables and the group of variables that defined a PCA factor. For example, how are the sampling stations' contaminant concentrations distributed among the PCA factors defined by the benthic community species? Is there a group of stations that tends to cluster where species richness is low or where species richness is high? In this paper, we only address the cluster analysis results.
| Station | Total taxa | No. unique | No. rare | Total rare and unique |
|---|---|---|---|---|
| 1 | 17 | 1 | 3 | 4 |
| 3 | 15 | 3 | 1 | 4 |
| 4 | 16 | 0 | 1 | 1 |
| 5 | 6 | 1 | 0 | 1 |
| 7 | 18 | 2 | 3 | 5 |
| 8 | 7 | 1 | 1 | 2 |
| 12 | 12 | 0 | 1 | 1 |
| 15 | 7 | 1 | 0 | 1 |
| 16 | 13 | 0 | 2 | 2 |
| 19 | 8 | 2 | 0 | 2 |
| 20 | 7 | 1 | 1 | 2 |
| 27 | 4 | 0 | 1 | 1 |
| 28 | 11 | 0 | 2 | 2 |
| 30 | 14 | 2 | 1 | 3 |
| 32 | 10 | 1 | 1 | 2 |
| 36 | 15 | 0 | 2 | 2 |
| 38 | 15 | 1 | 0 | 1 |
| 39 | 7 | 1 | 0 | 1 |
| 40 | 16 | 1 | 1 | 2 |
| 41 | 19 | 1 | 1 | 2 |
| 42 | 27 | 1 | 1 | 2 |
| 43 | 31 | 2 | 4 | 6 |
| 44 | 42 | 5 | 5 | 10 |
| 45 | 15 | 0 | 1 | 1 |
| 47 | 13 | 2 | 0 | 2 |
| 48 | 14 | 2 | 1 | 3 |
| 49 | 10 | 0 | 1 | 1 |
| 50 | 23 | 2 | 1 | 3 |
| 51 | 9 | 2 | 0 | 2 |
| 52 | 16 | 0 | 1 | 1 |
| 53 | 10 | 2 | 0 | 2 |
| 55 | 18 | 3 | 1 | 4 |
| 56 | 15 | 1 | 0 | 1 |
| 58 | 29 | 1 | 3 | 4 |
| 59 | 15 | 2 | 1 | 3 |
| 60 | 21 | 0 | 3 | 3 |
| 61 | 9 | 1 | 0 | 1 |
| 62 | 20 | 5 | 2 | 7 |
| 63 | 32 | 4 | 5 | 9 |
| 64 | 4 | 2 | 1 | 3 |
| 66 | 41 | 9 | 12 | 21 |
| 67 | 34 | 6 | 10 | 16 |
| 68 | 18 | 0 | 1 | 1 |
| 69 | 14 | 0 | 2 | 2 |
| 70 | 9 | 0 | 1 | 1 |
| 71 | 16 | 1 | 0 | 1 |
| 72 | 30 | 8 | 5 | 13 |
| 73 | 24 | 1 | 2 | 3 |
Cluster analysis was employed to group stations and species data. The objective was to determine a method that produced a coherent pattern of association and also demonstrated consistency between results for sites and species associations. Most cluster analysis procedures involve a two-step process: Creation of a resemblance data matrix from the raw data, and clustering the resemblance coefficients in the matrix. The input resemblance (similarity or dissimilarity) matrix can be created by a number of methods. Input data may or may not be standardized or transformed, depending on the chosen method (e.g., Bray-Curtis).

Abundance of macroinvertebrate organisms found in Delaware Bay, USA, sediment samples.
We compared three clustering methods, including the Bray-Curtis method [26], the Jaccard method [27], and Ward's method [28]. The Bray-Curtis method is based on an algorithm that creates a matrix of coefficients that reflect the percentage distance between attributes. We used both raw abundance data and mean standardized abundance data for Bray-Curtis calculations. Ward's minimum variance method calculates clusters based on minimized variance between the data matrix values. Ward's method does not include generation of a resemblance matrix but, instead, uses the original input data (raw or normalized abundance data). The Jaccard method is a binary method based only on presence/absence data and, thus, ignores abundance values. This method generates a resemblance matrix of coefficients that reflects the cumulative frequency of species overlap between sites. The calculation method does not include negative frequencies; that is, for sites in which a given species is missing in both, no value is returned in the calculation routine. Site coefficients are the product of instances in which species are found in common and/or in which species are present at one site but not the other.
Cluster analyses were calculated from the Bray-Curtis and Jaccard matrices with the unweighted pair-group method using arithmetic averages (UPGMA) [29] method that clusters co-efficients based on arithmetic mean distance calculations. After initial cluster analyses, the input data set was modified in various ways to eliminate particular problems and to test the effects of other manipulations. To optimize the cluster analysis results, several manipulations of the input data were explored. These were designed to remove confounding effects, redundancy, and the influence of species with limited spatial distribution.
Artificial species (resulting from failure to identify some specimens all the way down to the species level) were identified as a data bias. For example, we found many examples in which specimens of two or three species were identified in genus A and other specimens only to genus A or the family to which genus A belongs. This tends to increase artificially the species richness and diversity of the sample when, in fact, that diversity is an artifact of imperfect taxonomy. In some instances, specimens were identifiable only to the level of family, order, or class. To address this problem, specimens not identified to the species level were eliminated unless they were identified to a taxonomic level below which no other specimens in the collection belonged. That is, even though they were not identified to the species level, they were the only representative of that taxonomic line and represented a nonredundant taxon. Fifty-three taxa, or almost a quarter of the supposed species richness, were eliminated in this step. More than half of these individual specimens were not identifiable below the family level; however, these were not numerous or widespread. Most of them were specimens that were difficult to identify or were too damaged by sampling gear to identify completely, and they accounted only for 3.3% of the more than 18,000 individual organisms enumerated. To minimize the loss of important community information for taxa that were numerous and widespread, exceptions to the removal step occurred. We found 19 examples in which taxa identified only to the genus level outnumbered the specimens identified to the species level in that same genus. In eight cases, only one species was identified in the genus, and the abundance data were lumped into one taxon (genus). In 11 cases, we had multiple species to choose from, so they were not lumped. The individual species were kept, and the genus also was kept as a separate taxon.
| All taxa | Nontoxic | Toxica | |||||
|---|---|---|---|---|---|---|---|
| Zone | All sites | 90% sites | All sites | 90% sites | All sites | 90% sites | Without speciesb |
| All | 451 | 265 | 345 | 187 | 798 | 516 | 550 |
| Fresh | 523 | 530 | 378 | 378 | 666 | 594 | 278 |
| Estuarine | 588 | 215 | 426 | 190 | 991 | 357 | 920 |
| Ocean | 184 | 135 | 184 | 135 | /c | / | / |
- a One or more bioassays exhibiting significant toxicity.
- b Without Tubificidae and Limnodrilus hoffmeisteri.
- c / = none of the ocean sites showed significant toxicity.

Plot of toxicity score and mean normalized contaminant concentrations Delaware Bay, USA, sampling stations.
Rare and unique species, defined as those species that were found at no more than two stations, were eliminated from the data set. Eighty-one species were unique to only one station. Forty-three species were considered to be rare (found only at two stations). Because of their limited distribution, by definition, they cannot shed light on the impact of contaminant gradients in the environment, because they do not occur across the gradient. Five offshore and three estuarine stations contained 53% of these species. That is, eight stations had uniquely diverse communities [13]. Because these stations were remote from any contaminated zones, the data for these species are not useful in the context of assessing contamination impacts. The difficulty with these species in the analyses is that they caused the formation of spurious clusters that disaggregated sites in the cluster analyses that otherwise would have been grouped together. The remaining 58 rare and unique species were found throughout the system, spread out among 43 other sites.
Low-abundance species (<1 organism/grab) were eliminated on a site-by-site basis. This was done to assess the impact of species at the edges of their habitat type. However, this had the effect of creating false rare and unique species in many instances where the species usually was present in low numbers at many stations but was more abundant at only a few stations. These had the same effect of disaggregating site clusters as the true rare and unique species did. This modification to the data set was abandoned.
The final list of taxa used in the analyses was reduced to 90 (from an original total of 231). This species list of common animals is much more realistic. It also eliminated the disaggregation of site clusters resulting from the presence of false species that caused sites to separate from other site groups, because they were numerically different in the similarity matrix.

Relationship between the toxicity index and mean effects range-median (ERM) quotient for Delaware Bay, USA, sediment stations.
Statistical analyses
After the optimum clustering technique and data set had been selected (that which created distinct and logical clusters of both sites and species), a nodal analysis routine was applied to the data [30]. This consisted of combining independent cluster analyses in a graphical array. The first analysis clustered sites using species abundance or occurrence data. The second analysis clustered species. The intersection of site clusters on the abscissa and species clusters on the ordinate axis formed a grid. By plotting the abundance of each species at each site in the grid, a pattern of species associations in groups of sites was created. Each of the groups could then be characterized by physicochemical habitat parameters, contaminant concentrations, and other site-specific data. Because cluster analysis in itself is not a statistical test, follow-up manipulations, such as nodal analysis, are a method to assess the logic of the inferences drawn from the cluster interpretation. The method that produced the most consistent groupings between species and sites was the Jaccard method. The remainder of this paper will address only results from this method. (Details regarding other methods are available from the authors.)
The Jaccard method cannot be normalized for environmental parameters, such as salinity, because it is a binary method and cannot incorporate negative values. Pearson correlation coefficients can be normalized, and they were used to create a binary similarity input matrix for UPGMA cluster analysis. Abundance data were first log-transformed and normalized to mean = 0 and SD =1. The cluster analysis also was run on residuals from salinity regression analysis of abundance data to evaluate site and species associations without the influence of salinity gradients. In addition, data were normalized for TOC and grain size. These analyses were limited to the estuarine stations, because the salinity regression yielded biased values for the tidal fresh and coastal zone species that had no realistic salinity gradient from which to calculate residuals.
In addition to the main bay sampling sites, sediment was collected at selected locations in small tributaries. These included a site in the Bombay Hook National Wildlife Refuge (station 87) and three sites in the St. Jones River (stations 88–90), an impacted tributary of Delaware Bay. To assess the ability of the clustering methods to classify sites with varying salinity and contaminant characteristics, cluster analyses were conducted on the data set both with and without data from these locations.

Principal component analysis (PCA) plot for community metrics for freshwater and estuarine sites. Component scores for individual sample sites, expressed as the number of effects range-low (ERL) exceedances, also are displayed.
RESULTS
Principal component analysis using contaminant data summarized by chemical class showed that 80.7% of the variation was explained by just one factor. Because the concentrations of all chemical contaminants varied together, we interpreted this as simply splitting the sampling stations into contaminated versus uncontaminated groups on opposite ends of the factor axis. Principal component analysis using benthic community parameters resulted in species richness and abundance primarily along one factor and evenness on the second factor. Diversity was split between the two primary factors. Extension analysis plots of sites on the benthic community factor axes did not place the sites into discrete clusters but did reveal a pattern: Sites with higher concentrations of contaminants generally had low species richness and diversity. This was more obvious when considering just the tidal fresh and estuarine sites (Fig. 6), because none of the coastal zone sites had elevated contaminants.
Site clusters primarily reflected the salinity gradient, with grain size as a secondary sorting parameter. The first five clusters comprised the tidal fresh and low salinity portions of the system. Clusters A, B, and C were all tidal fresh sites (Fig. 7). Cluster A consisted of shallow muddy sites (mean % silt/clay, 77%). Cluster B was made up of sandy sites (mean % silt/clay, 6.5%) of 3 to 5 m in depth. Cluster C consisted of sites with a range of grain-size characteristics and included the deep dredged channel sites. Only stations 19 and 22 had measured salinities greater than 1 ppt (2.1 and 3.1 ppt, respectively). Cluster D contained the remaining mixing zone sites, with salinities ranging from 0.2 to 5.1 ppt. Only 13 species were present in this group of sites, and with the exception of Tubificids and Limnodrilius hoffmeisteri, average abundance was 139 organisms/m2. Cluster E contained mesohaline sites (mean salinity, 9.1 ppt). These sites comprise all the sampling locations in the narrow portion of the estuary from stations 27 to 39 and are referred to here as the upper estuarine zone. They include all bottom types and depths. The isopod Cyathura polita was present at all but two of these sites. Cyathura polita and Tubificids were the only taxa present throughout this area and the tidal fresh sites. Whereas C. polita was found in both areas, it was absent from the mixing zone sites. Clusters F and G were distinct from the previous clusters in being polyhaline sites, with salinities between 17 and 31 ppt. The sites in cluster F were located in depositional zones with finer grain size and higher TOC levels than those in cluster G. They were located closer to the perimeter of the estuary and away from the main channel areas compared to the sites in cluster G. The mean species richness and abundance in cluster F sites were higher than those of any cluster in the entire system. Within cluster G, the sites could be divided further into primarily coastal zone sites and lower estuarine sites either at the mouth of the estuary or in the deeper portions of the relict river channels. With one exception, all the sites in cluster G had sandy or sand and gravel sediments. Mean TOC was 0.3%. Station 64 was a cluster unto itself; it was located on a relatively shallow sand shoal outside the mouth of Delaware Bay that contained just four species, only one of which was not considered to be a rare species.
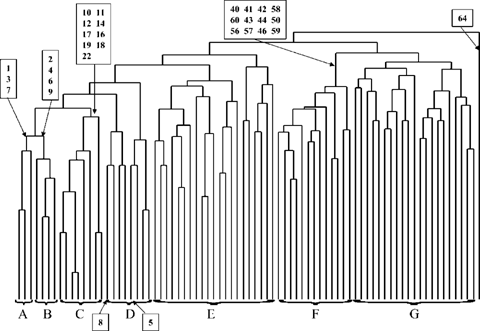
Site cluster analysis results using the Jaccard method. Freshwater and estuarine depositional sites are noted. See text for group descriptions.
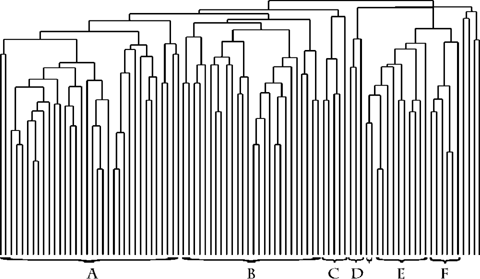
Species cluster analysis results using the Jaccard method. See text for group descriptions.
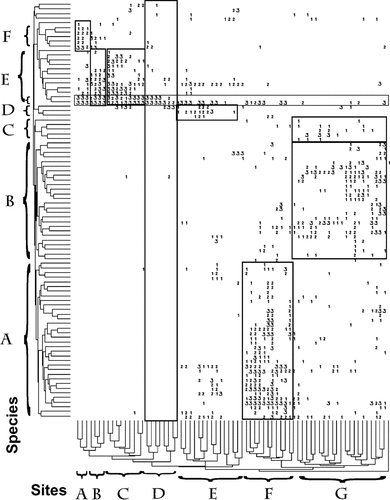
Nodal intersection of species and site clusters. See text for descriptions.
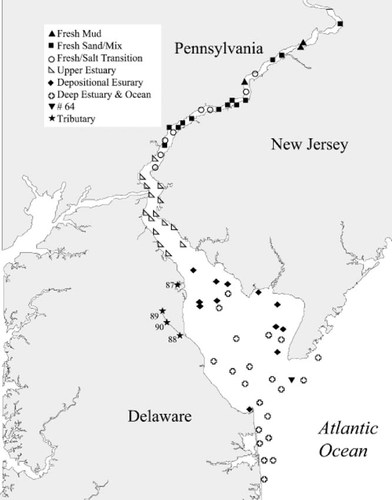
Distribution of habitat nodes in Delaware Bay, USA.
| Taxa | (Density organisms/m2) | Nodal association |
|---|---|---|
| Actinariaa | 50 | Rare and unique |
| Ampelisca abdita | 3,300 | Lower estuary depositional |
| Asabellides oculata | 50 | Lower estuary depositional |
| Cyathura polita | 100 | Tidal fresh/upper estuary |
| Dipolydora socialis | 175 | Lower estuary deep and |
| coastal zone | ||
| Edotia triloba | 100 | Lower estuary depositional |
| Erichthonius brasiliensis | 75 | Lower estuary depositional |
| Nereis succinea | 75 | Upper estuary |
| Paracaprella tenuis | 25 | —b |
| Pleusymtes glaber | 25 | — |
| Polydora cornuta | 25 | Lower estuary depositional |
| Rhithropanopeus harrisii | 25 | Lower estuary depositional |
| Spionidaea | 25 | Undefined |
- a Lowest practical identification level.
- b Not present in mainstem sites.
The Jaccard-UPGMA method grouped species into assemblages that largely reflect the same characteristics that distinguish the site clusters from each other (e.g., ppt, grain). Species clustered into a tidal fresh and oligohaline group, which subdivides into species found in mud (cluster F) versus fine sand/ mixed bottom (cluster E) (Fig. 8). The latter included the species found in the deep tidal fresh sites. The pair of unlettered taxa at the left end of cluster E were L. hoffmeisteri and Tubificidae. These taxa are the transition species that were found throughout the tidal fresh strata and, together with the small cluster D species, into the mixing zone and upper estuarine zone. Clusters C and B were found primarily in the deep lower estuarine and coastal zone stations and occasionally in the estuarine depositional sites. Cluster A was comprised of species found primarily in the depositional areas in the lower estuary, with some overlap into either the upper estuary or coastal zone sites. The four species to the right of cluster F were collectively found at only 16 sites throughout the entire system. They were present in very low abundance at all locations and are referred to here simply as species with an undefined habitat. They consisted of three amphipod species and an unidentified Spionid worm. The pair at the extreme left of the figure in cluster A were an isopod (Edotia triloba) and unidentified Rhynchocoela species. These were found throughout the entire estuary and out into the coastal zone sites, but they generally were found in low abundance.
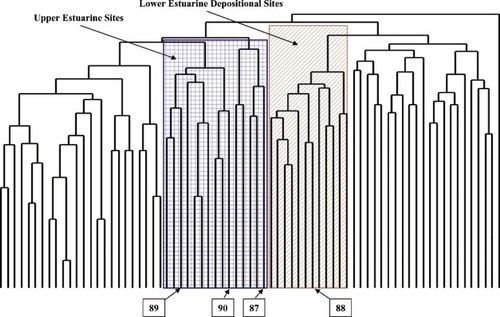
Site cluster analysis results using the Jaccard method. Upper estuary, depositional estuary, and tributary sites are noted.
The nodal intersection of the sites and species is shown in Figure 9. The letter designations of the clusters are the same as shown in Figures Fig. 7., Fig. 8.. The numbers represent the abundance of each species at each site, where 1 = 25–75 organisms/m2, 2 = 75–300 organisms/m2, and 3 = >300 organisms/m2. These are roughly the 50th, 75th, and 90th percentiles of abundance, respectively, observed on a site-by-site and species-by-species basis. For example, the organisms in species cluster A were found in high abundance primarily in site cluster F locations and generally in lower numbers at other sites. Cluster F was the depositional lower estuarine zone, which exhibited a large number of species and high abundances. Site cluster G included some species that are located exclusively in the coastal zone (on the right half of cluster G) and some that are found in the deep channels of the lower estuary sites as well as depositional lower estuarine sites. Site cluster E (upper estuary) was populated by a subset of species from the lower estuarine depositional zone and a group of three species (cluster D) that are found primarily in this zone. The mixing zone (site cluster D) had only a few species, with mostly low abundance except for L. hoffmeisteri and Tubificidae. The distribution of L. hoffmeisteri and Tubificidae (unlettered pair at the bottom of species cluster E) were the only species found consistently in all the tidal fresh sites and the mixing zone. Tubificids were found at some level in all the site clusters. The tidal fresh site clusters A to C correspond to the two main freshwater species clusters: Mud, and sand/mixed bottom. The geographic distribution of the clusters is illustrated in Figure 10.
The analyses including the tributary sites placed the pristine Bombay Hook (station 87) into the upper estuarine cluster (Fig. 11). It was located physically downbay from other sites in that cluster but was in the same salinity range and occupied by a mixture of the species typical of the upper estuary and the lower estuary depositional zone (Table 4). It has relatively high species richness for that cluster but low abundance, typical of the upper estuary.
The three St. Jones River sites (stations 88–90) show a distinct upstream-to-downstream transition (Fig. 11). The upstream site (station 89) was in the oligohaline, upper estuarine cluster. Station 90 also was in this cluster, even though it has a polyhaline salinity. It has much higher species richness than was typical of the upper estuarine node but typically has low abundance except for Tubificids and Spionids, which are taxa typical of overenriched habitats (Table 5). Station 88 near the mouth of the tributary was clustered with the other depositional lower estuarine sites in the high-salinity zone. The dominant species here also were deposit-feeding worms, including Mediomastus, which typically is found in relatively clean habitats.
The Jaccard-UPGMA results of the estuarine-only sites revealed two large clusters and two small clusters (Fig. 12) that were consistent with the breakout seen using the larger data set. Clusters A and A′ were the lower estuary depositional zone species, with the cluster A group being found in sediment with greater than 1% TOC and the cluster A′ species generally being found in sediment with less than 1% TOC. This was largely a result of the distribution of several species found primarily at stations 43 and 44. Cluster C included all but two of the deep lower estuarine/coastal zone species. Clusters B and D species primarily were from the mixing zone or were undefined groups.
| Taxa | Density (organisms/m2-) | Nodal association |
|---|---|---|
| Downstream (site 88) | ||
| Ampelisca abdita | 100 | Lower estuary depositional |
| Cirratulidaea | 25 | Lower estuary deep and |
| coastal zone | ||
| Edotia triloba | 50 | Lower estuary depositional |
| Glycinde solitaria | 25 | —b |
| Hypereteone heteropoda | 425 | —b |
| Ilyanassa obsoleta | 50 | —b |
| Leucon americanus | 325 | Lower estuary depositional |
| Mediomastusa | 8,800 | Lower estuary depositional |
| Rhynchocoela1 | 50 | Lower estuary depositional |
| Spiochaetopterus oculatiis | 25 | Lower estuary depositional |
| Spisula solidissima | 175 | —b |
| Streblospio benedicti | 16,875 | Lower estuary depositional |
| Tubificidaea | 2,550 | Tidal fresh/mixing zone |
| Urosalpinx cinera | 25 | —b |
| Middle (site 90) | ||
| Ampelisca abdita | 75 | Lower estuary depositional |
| Ampharetidaea | 25 | Lower estuary depositional |
| Capitellidaea | 25 | —b |
| Cirrophorus lyra | 25 | —b |
| Corophium tuberculatum | 25 | Lower estuary depositional |
| Cyathura polita | 25 | Tidal fresh/upper estuary |
| Dipolydora socialis | 100 | Lower estuary deep and |
| coastal zone | ||
| Heteromastus filiformis | 125 | Lower estuary depositional |
| Magelona papillicornis | 25 | —b |
| Maldanidaea | 25 | —b |
| Mediomastusa | 25 | Lower estuary depositional |
| Oligochaetaa | 150 | —b |
| Phyllodocidaea | 25 | Lower estuary deep and |
| coastal zone | ||
| Spionidaea | 625 | —b |
| Streblospio benedicti | 50 | Lower estuary depositional |
| Tubificidaea | 2,475 | Tidal fresh/mixing zone |
| Upstream (site 89) | ||
| Asabellides oculata | 25 | Lower estuary depositional |
| Cyathura polita | 50 | Tidal fresh/upper estuary |
| Edotia triloba | 150 | Lower estuary depositional |
| Gammarus tigrinus | 250 | Tidal fresh |
| Laeonereis culveri | 50 | —b |
| Leucon americanus | 25 | Lower estuary depositional |
| Limnodrilus hoffmeisteri | 350 | Tidal fresh/mixing zone |
| Tubificidaea | 950 | Tidal fresh/mixing zone |
- a Lowest practical identification level.
- b Undefined, rare, and/or not mainstem species.
The UPGMA clustering using the Pearson correlation coefficients as the input matrix placed the species into very similar groups (Fig. 13). Clusters D and E were the lower estuary depositional zone species, again with a split between high- and low-TOC groups. Cluster C was comprised of the deep lower estuarine/coastal zone species. Cluster B was made up of mixing zone and undefined species. Cluster A contained species classified as being from the lower estuarine depositional zone but that were also found in several of the upper estuarine stations in low numbers. Normalization for salinity, grain size, and TOC, whether individually or in combination, did not fundamentally change these groups, except that the species in clusters A and B were mixed to varying degrees.
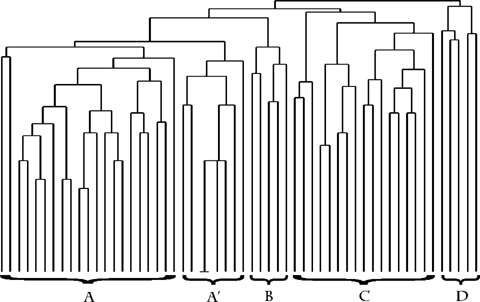
Species cluster analysis results using the Jaccard method on estuarine species. See text for group descriptions.
DISCUSSION
Delaware Bay can be segmented into six or seven natural habitat types based solely on the benthic species assemblages that are present. The nodal segmentation method can be used to improve derivation of IBI metrics, sediment-quality triad community assessments, and reference envelope calculations. It subdivides the data set into habitat blocks that contain consistent species assemblages. Therefore, it may improve our ability to distinguish between impacted and unimpacted locations within a given habitat type, because it allows for calculations that are unbiased by the inclusion of stations containing elements of other communities. (This aspect is currently being evaluated with the Chesapeake Bay data set in which confounded gradients are not as large a problem and contaminated stations can be excluded from the initial clustering to contrast communities in clean vs contaminated sites.) In the process of setting scoring thresholds for IBI metrics, the ranges of the metric values derived from a nodal analysis will better reflect the actual variation of a given habitat type. There will always be a few species that are outside their primary habitat and transitional species that may be present in a variety of habitats, such as L. hoffmeisteri.
An early attempt to derive a regional IBI for the Virginian Province Environmental Monitoring and Assessment Program [4] produced an uncomplicated index based on a diversity index and two indicator species metrics. Both indicator species metrics were salinity-normalized. Results from this index indicate relatively poor habitat conditions throughout the Delaware Bay system, including the lower estuary and coastal zone sites (Fig. 14). Most of the tidal fresh, mixing zone, lower estuarine depositional, and coastal zone sites resulted in negative benthic IBI values, which are indicative of poor habitat conditions. Positive index values were found predominantly in the upper estuarine and lower estuarine depositional areas. The failure of this approach to distinguish between contaminant-impacted sites and healthy sites lay in its simplicity, borne out of the attempt to create a regional index. Also, this approach did not explicitly address community transitions that mirror salinity gradients. It primarily considered the predominance of two indicator taxa.
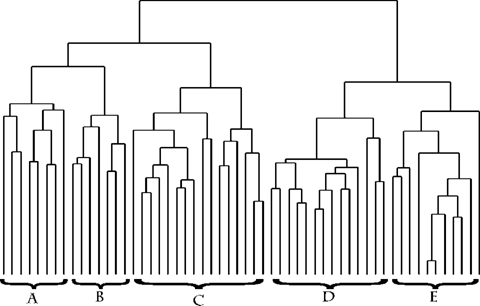
Species cluster analysis results using Pearson correlation coefficients without salinity adjustment. See text for group descriptions.
A more detailed benthic IBI derivation for the Mid-Atlantic Integrated Assessment (MAIA) project was constructed [7, 8] that subdivided estuaries in the mid-Atlantic region into five different salinity zones in an effort to improve the predictive ability of a regional IBI metric (Table 6). The cutoff thresholds for these metrics were the 10th and 50th percentiles of values in a derivation data set using data from sites deemed to be unimpacted by a priori screening for ERLs, observed toxicity, and oxygen stress (except abundance, which was considered to be bimodal). The NS&T Delaware Bay data set was part of the derivation data set, which also included data from Chesapeake Bay and North Carolina coastal estuaries. This approach does not distinguish between distinctly different community assemblages observed in the nodal analysis approach within the tidal fresh or polyhaline salinity zones (Table 7). The lower estuarine depositional sites and all the deep lower estuary/coastal zone sites are lumped into a single polyhaline habitat group in the MAIA scheme. Two or three distinct nodal communities are within the MAIA tidal fresh region. The mixing zone and upper estuarine nodes largely overlap with the MAIA oligohaline and low mesohaline habitat designations. The high mesohaline habitat only includes five sites, four in the upper estuarine node and one within the depositional lower estuarine node. Applying the MAIA metrics to the Delaware Bay data reveals that more than half the tidal fresh sites have an IBI score of three or greater, indicating nondegraded habitat (Fig. 15), including station 13, which has an ERM quotient of greater than 1.0. Eleven of the 19 oligohaline and low mesohaline sites have MAIA IBI scores of less than three, indicating degraded conditions, but six of these have an ERM quotient of less than 0.15. None of the 38 high mesohaline or polyhaline sites have an ERM quotient of greater than 0.1, yet a quarter of them have an IBI score of less than three. The only sites with potential anthropogenic impacts are stations 56 and 57, which may be influenced by ship anchorages and stream runoff, respectively. Station 64 is distinguished from all other sites by both methods. Virtually nothing lives there.
We do not intend to imply that the MAIA IBI approach is necessarily flawed. Indeed, the quantity of data and the number of permutations that were used in the exercise were extensive. The implication of the results of the nodal analysis is that habitats should be divided into groups based on more than a salinity gradient. The data clearly demonstrate that metric threshold values must be derived with consideration of the background habitat quality, including salinity, grain size, and possibly, depth. The mixing zone is a naturally stressful habitat, which is reflected in the largely depauperate species richness and abundance. Both the upstream and downstream areas are more diverse and productive, even though virtually all the upstream sites are heavily contaminated. Conversely, the extremely diverse and productive habitat in the depositional zones of the lower estuary and the coarse-grained, high-energy habitats of the channels and coastal zone sites have very little in common biologically and should not be combined. Their biological characteristics are not representative of each other, even though they have similar salinities and relatively low contamination. Similarly, the communities in the tidal fresh zone have distinctive differences that are mediated by grain-size characteristics. Similar community differences have been observed in contaminated and uncontaminated areas in the U.S. Great Lakes [31, 32].
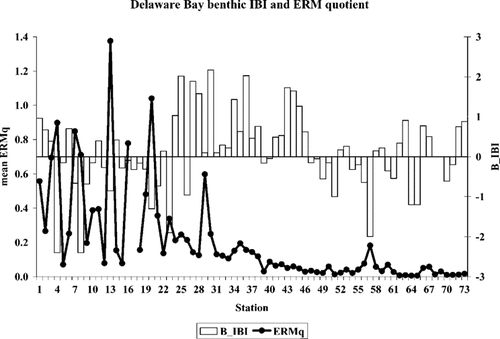
Mean effects range-median (ERM) quotient and environmental monitoring and assessment program EMAP benthic Index of Biotic Integrity (IBI) values at Delaware Bay, USA, sampling sites.
| Scoring criteria | |||
|---|---|---|---|
| 1 | 3 | 5 | |
| Tidal freshwater | |||
| Abundance (organisms/m2) Tanypodini: Chironomidae % abundance ratio | <1,401.5 or ≥7,068.2 >69.8 | 1,401.5–1,772.7 or ≥5,253.8–7,068.2 20.9–69.8 | ≥1,772.7–5,253.8 ≤20.9 |
| % Abundance of deep-deposit feeders | >90.6 | 61.7–90.6 | ≤61.7 |
| Oligohaline | |||
| % Dominance | <10.4 | 10.4–30.0 | ≥30.0 |
| % Abundance of pollution-indicative taxa | >75.8 | 35.5–75.8 | ≤35.5 |
| % Abundance of deep-deposit feeders | >64.3 | 64.3–38.9 | ≤38.9 |
| Low mesohaline | |||
| Abundance (organisms/m2) | <818.2 or ≥5,151.5 | 818.2–1,590.9 or ≥3,659.1–5,151.5 | ≥1,590.9–3,659.1 |
| Shannon-Weiner diversity (log2) | <1.5 | 1.5–2.4 | ≥2.4 |
| No. of taxa | <6.3 | 6.3–10.3 | ≥10.3 |
| % Dominance | <18.7 | 18.7–35.8 | ≥35.8 |
| % Abundance of pollution-indicative taxa | >39.5 | 7.5–39.5 | ≤7.5 |
| High mesohaline | |||
| Abundance (organisms/m2) | <636.4 or ≥6,909.1 | 636.4–1,174.2 or ≥4,159.1–6,909.1 | ≥1,174.2–4,159.1 |
| Shannon-Weiner diversity (log2) | <1.7 | 1.7–2.6 | ≥2.6 |
| No. of taxa | <6.0 | 6.0–11.7 | ≥11.7 |
| % Dominance | <22.4 | 22.4–41.9 | ≥41.9 |
| % Abundance of pollution-sensitive taxa | <2.9 | 2.9–21.3 | ≥21.3 |
| Polyhaline | |||
| Abundance (organisms/m2) | <647.7 or ≥8,719.7 | 647.7–1,454.5 or ≥5,704.5–8,719.7 | ≥1,454.5–5,704.5 |
| Shannon-Weiner diversity (log2) | <2.0 | 2.0–3.1 | ≥3.1 |
| No. of taxa | <7.0 | 7.0–19.3 | ≥19.3 |
| % Abundance of bivalvia | <0.4 | 0.4–7.5 | ≥7.5 |
- a Llansó et al. [8].
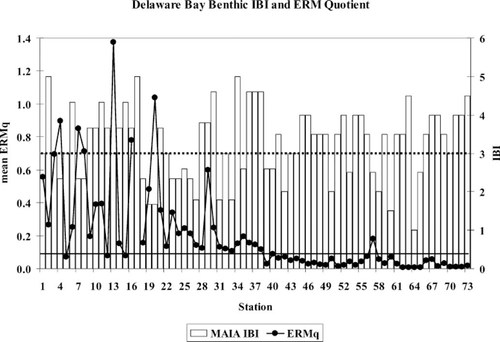
Mean effects range-median quotient (ERMq) and updated Mid-Atlantic Integrated Assessment (MAIA) benthic IBI values at Delaware Bay, USA, sampling sites. An IBI of less than 3 (dashed line) or an ERMq of greater than 0.1 (solid line) are considered to be thresholds for observed benthic impairment.
Another important implication from the nodal analysis is that IBIs probably should be developed on a more limited geographic area than the large regional areas that have been attempted [4-6]. The lack of consistency of both IBIs in successfully rating Delaware Bay sites is caused, in part, by application over a very extensive geographic area, which includes several ecological transitions. The nodal approach developed for the Delaware Bay was applied to a Chesapeake Bay data set for preliminary comparison. The Chesapeake data do not exhibit completely confounded gradients of salinity and contamination and will be evaluated further as the data set is completed. We will be able to test the nodal analysis results using species assemblage data from similar physical habitats with differing levels of contamination.
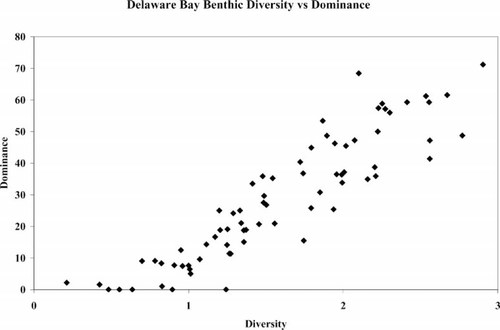
Calculated diversity and dominance at Delaware Bay, USA, sampling sites.
| Station | Salinity | MAIA salinity zone | Node | MAIA BJBI | Node no |
|---|---|---|---|---|---|
| 1 | 0.1 | Fresh | Fresh-mud | 3.00 | 1 |
| 3 | 0.1 | Fresh | Fresh-mud | 3.00 | 1 |
| 7 | 0.1 | Fresh | Fresh-mud | 2.33 | 1 |
| 2 | 0.1 | Fresh | Fresh-sand | 5.00 | 2 |
| 4 | 0.1 | Fresh | Fresh-sand | 2.33 | 2 |
| 6 | 0.1 | Fresh | Fresh-sand | 4.33 | 2 |
| 9 | 0.1 | Fresh | Fresh-sand | 3.67 | 2 |
| 10 | 0.2 | Fresh | Fresh-mixed bottom | 3.67 | 3 |
| 11 | 0.2 | Fresh | Fresh-mixed bottom | 4.33 | 3 |
| 12 | 0 | Fresh | Fresh-mixed bottom | 3.67 | 3 |
| 14 | 0.1 | Fresh | Fresh-mixed bottom | 3.67 | 3 |
| 16 | 0.1 | Fresh | Fresh-mixed bottom | 3.67 | 3 |
| 17 | 0.5 | Oligohaline | Fresh-mixed bottom | 5.00 | 3 |
| 18 | 0.7 | Oligohaline | Fresh-mixed bottom | 2.33 | 3 |
| 19 | 2.1 | Oligohaline | Fresh-mixed bottom | 1.67 | 3 |
| 22 | 3.1 | Oligohaline | Fresh-mixed bottom | 3.00 | 3 |
| 5 | 0.1 | Fresh | Mixing zone | 3.00 | 4 |
| 8 | 0.1 | Fresh | Mixing zone | 2.33 | 4 |
| 13 | 0.2 | Fresh | Mixing zone | 3.00 | 4 |
| 15 | 0.2 | Fresh | Mixing zone | 4.33 | 4 |
| 20 | 1.6 | Oligohaline | Mixing zone | 1.67 | 4 |
| 21 | 2.6 | Oligohaline | Mixing zone | 3.67 | 4 |
| 23 | 3.5 | Oligohaline | Mixing zone | 2.33 | 4 |
| 25 | 5.2 | Low mesohaline | Mixing zone | 2.60 | 4 |
| 24 | 3.1 | Oligohaline | Upper estuary | 2.33 | 5 |
| 26 | 4.5 | Oligohaline | Upper estuary | 2.33 | 5 |
| 27 | 5.1 | Low mesohaline | Upper estuary | 1.80 | 5 |
| 28 | 6.0 | Low mesohaline | Upper estuary | 3.80 | 5 |
| 29 | 7.5 | Low mesohaline | Upper estuary | 3.80 | 5 |
| 30 | 7.1 | Low mesohaline | Upper estuary | 4.60 | 5 |
| 31 | 7.8 | Low mesohaline | Upper estuary | 1.80 | 5 |
| 32 | 10.5 | Low mesohaline | Upper estuary | 3.00 | 5 |
| 33 | 11.3 | Low mesohaline | Upper estuary | 1.80 | 5 |
| 34 | 11.7 | Low mesohaline | Upper estuary | 5.00 | 5 |
| 35 | 8.3 | Low mesohaline | Upper estuary | 2.60 | 5 |
| 36 | 12.1 | High mesohaline | Upper estuary | 4.60 | 5 |
| 37 | 13.7 | High mesohaline | Upper estuary | 4.60 | 5 |
| 38 | 14.9 | High mesohaline | Upper estuary | 4.60 | 5 |
| 39 | 13.8 | High mesohaline | Upper estuary | 2.60 | 5 |
| 40 | 16.9 | High mesohaline | Lower depositional estuary | 2.60 | 6 |
| 41 | 20.2 | Polyhaline | Lower depositional estuary | 3.50 | 6 |
| 42 | 20.4 | Polyhaline | Lower depositional estuary | 2.00 | 6 |
| 43 | 19.2 | Polyhaline | Lower depositional estuary | 3.00 | 6 |
| 44 | 19.9 | Polyhaline | Lower depositional estuary | 3.00 | 6 |
| 46 | 21.4 | Polyhaline | Lower depositional estuary | 4.00 | 6 |
| 50 | 24.0 | Polyhaline | Lower depositional estuary | 2.00 | 6 |
| 56 | 30.1 | Polyhaline | Lower depositional estuary | 3.50 | 6 |
| 57 | 20.8 | Polyhaline | Lower depositional estuary | 2.50 | 6 |
| 58 | 27.7 | Polyhaline | Lower depositional estuary | 2.00 | 6 |
| 59 | 25.8 | Polyhaline | Lower depositional estuary | 3.50 | 6 |
| 60 | 28.3 | Polyhaline | Lower depositional estuary | 1.50 | 6 |
| 45 | 20.7 | Polyhaline | Lower deep estuary and coastal zone | 4.00 | 7 |
| 47 | 22.1 | Polyhaline | Lower deep estuary and coastal zone | 3.50 | 7 |
| 48 | 27.1 | Polyhaline | Lower deep estuary and coastal zone | 3.50 | 7 |
| 49 | 29.0 | Polyhaline | Lower deep estuary and coastal zone | 3.50 | 7 |
| 51 | 25.9 | Polyhaline | Lower deep estuary and coastal zone | 3.50 | 7 |
| 52 | 25.1 | Polyhaline | Lower deep estuary and coastal zone | 4.00 | 7 |
| 53 | 29.4 | Polyhaline | Lower deep estuary and coastal zone | 2.50 | 7 |
| 54 | 26.2 | Polyhaline | Lower deep estuary and coastal zone | 4.00 | 7 |
| 55 | 26.6 | Polyhaline | Lower deep estuary and coastal zone | 4.00 | 7 |
| 61 | 26.6 | Polyhaline | Lower deep estuary and coastal zone | 3.50 | 7 |
| 62 | 31.2 | Polyhaline | Lower deep estuary and coastal zone | 3.50 | 7 |
| 63 | 28.7 | Polyhaline | Lower deep estuary and coastal zone | 4.50 | 7 |
| 65 | 27.6 | Polyhaline | Lower deep estuary and coastal zone | 2.50 | 7 |
| 66 | 28.6 | Polyhaline | Lower deep estuary and coastal zone | 3.50 | 7 |
| 67 | 28.4 | Polyhaline | Lower deep estuary and coastal zone | 4.00 | 7 |
| 68 | 28.2 | Polyhaline | Lower deep estuary and coastal zone | 4.00 | 7 |
| 69 | 28.0 | Polyhaline | Lower deep estuary and coastal zone | 3.50 | 7 |
| 70 | 27.6 | Polyhaline | Lower deep estuary and coastal zone | 3.00 | 7 |
| 71 | 27.2 | Polyhaline | Lower deep estuary and coastal zone | 4.00 | 7 |
| 72 | 26.7 | Polyhaline | Lower deep estuary and coastal zone | 4.00 | 7 |
| 73 | 26.2 | Polyhaline | Lower deep estuary and coastal zone | 4.50 | 7 |
| 64 | 27.7 | Polyhaline | Site 64 | 1.00 | 8 |
The nodal habitats delineated in the Chesapeake and Delaware bays do not correspond to each other on a one-to-one basis, despite the two systems both being drowned river valleys at the same latitude and sharing a very similar species assemblage as a whole. The geology and circulation dynamics of the basins are not the same, and they produce a different mosaic of habitat types within their boundaries. A complete analysis of the Chesapeake Bay data will be performed when all the data from a three-year sampling effort become finalized. Similar analyses also will be conducted with data from San Francisco Bay, where more heavily contaminated areas are located in high-salinity areas as well as in the upper estuarine areas.
The results from the tributary sites in the St. Jones River and Bombay Hook illustrate another utility of the nodal analysis approach in deriving metrics, such as IBIs. In arriving at habitat types, it is possible to examine the biological community at a particular location in relation to what would be expected based on the nodal classification. Station 89 (upstream, very contaminated) is more similar to the mixing zone community than it is to the lower estuarine community. Although the middle station (station 90) of the St. Jones River contains many of the species associated with the depositional lower estuarine zone, it is dominated by Tubificids, a mixing zone taxon rather than the community that one would predict based on salinity alone (19.2 ppt). When the nodal analysis is performed with the tributary stations included in the entire data set, station 90 is included in the upper estuarine node rather than the depositional lower estuary node, as one would predict based solely on salinity and location. Presumably, this is a consequence of both contaminant impact and salinity stress. The station at the mouth of the St. Jones River (19.8 ppt) does cluster with the depositional lower estuarine node stations. Bombay Hook is a pristine site; however, it also is clustered in the upper estuarine node, which is consistent with its salinity. The species assemblage at that location is borderline between the upper and depositional estuarine zones, but it reflects a community that includes members of the mixing zone. The presence of C. polita or Tubificidae and, to a lesser extent, L. hoffmeisteri appears to drive this result in the Jaccard matrix calculation scheme, because at least two of these species are found at virtually all the tidal fresh, mixing zone, and upper estuarine sites. Therefore, sites with these species tend to become clustered together. Bombay Hook has relatively high abundance for an upper estuarine site, caused entirely to the number of A. abdita that are present. However, abundance does not affect the Jaccard calculations. Without A. abdita, the relative abundance at Bombay Hook is low, which is typical of the upper estuarine sites. The diversity index is 0.99, which also is typical of the salinity-stressed sites in the upper bay. In the absence of chemistry data, one might conclude, incorrectly, that the site is under contaminant stress when it is merely in a salinity transition zone and exhibits the species assemblage typical for that type of habitat. It exhibits slightly elevated metal levels, typical of a depositional zone, with 92% silt/clay, high TOC and acid-volatile sulfide, and very low organic contaminants.
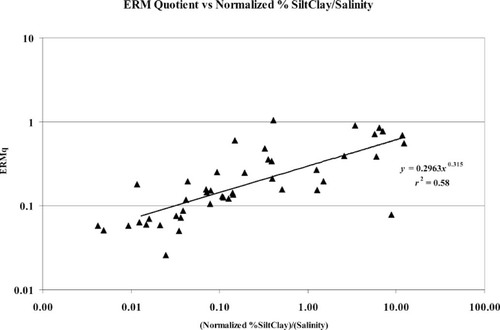
Mean effects range-median quotient (ERMq) as a function of normalized percentage silt/clay and salinity.
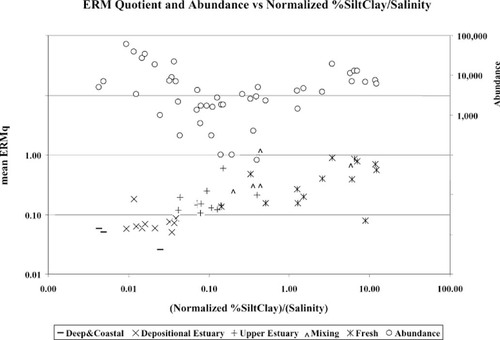
Relationship between mean effects range-median quotient (ERMq) and abundance as a function of normalized silt/clay and salinity.
The comparison of the Jaccard and Pearson correlation coefficients species clustering results using just the estuarine sites shows that each approach clustered most of the species found in depositional and coastal zone habitats with similar efficiency (Figs. Fig. 12., Fig. 13.). Normalization for salinity or other parameters did not change the groupings substantially, because little overlap occurred between the species found in each habitat to begin with. Absence of indicator species, or of an entire community, is not necessarily a sign of contaminant stress. It may simply be a consequence of unfavorable salinity or bottom type. The remaining species were mixed into two smaller groupings, depending on the method chosen. Normalization resulted in a reshuffling of the species between the two small clusters but did not fundamentally change the overall cluster structure. Species at contaminated sites (based on ERL exceedances) may be the species of interest with regard to identifying a contaminant signal in community structure.
It is unlikely that any index will be able to distinguish effectively between types of stressors (e.g., contaminants vs salinity), unless metrics are devised that can be shown to respond specifically to a contamination gradient. Recent attempts have been made to address this problem statistically [33]. Deriving metrics that respond proportionally to a contaminant gradient was a basic premise of Karr's original IBI [34, 35]. For example, station 64 is a very poor habitat by all biological measures. It is located on a mound in the ebb tidal shoal and probably is subject to severe physical stresses during tidal flux and storms. Its benthic community exhibits characteristics of a stressful habitat. However, in terms of contamination, it is a pristine site. It is a drowned dune composed of 99% sand with 0.07% TOC. This is analogous to the results from Bombay Hook. It is a stressful, but uncontaminated, habitat, and the benthic community reflects this.
Another difficulty in current application of IBIs for addressing contamination has been with the use of indicator species. Many, but not all, of the species used are opportunistic species that can thrive in harsh conditions whether or not contaminant stress exists (e.g., L. hoffmeisteri). Furthermore, the use of percentage sensitive and percentage tolerant organisms in one index provide inverse, but redundant, information. Measures of percentage tolerant and percentage sensitive species may be informative only in contaminated sites, whereas in uncontaminated sites, very little information is gained from either metric. Using diversity and dominance do not provide different information, either (Fig. 16). Inclusion of both metrics in an index is redundant and may lead to false positives.
It is widely accepted that abundance and/or biomass take on a bimodal function with respect to contaminant levels [3, 8], with high abundance at moderately polluted sites and low abundance at highly polluted sites. Data from Delaware Bay do not fit this pattern (Fig. 3). High abundance was observed at the highly contaminated areas and in the enriched, but uncontaminated, depositional areas of the estuary. As we have demonstrated, the abundance and species richness of an area are influenced strongly by salinity and grain size. Given these relationships, it may make more sense to evaluate metric thresholds based on a parameter adjusted for grain size and salinity, such as normalized percentage silt/clay (normalized silt/clay = arcsine √%) divided by salinity. This parameter is high where sediments are muddy and decreases with decreasing silt/clay content. Muddy sites in high-salinity areas yield intermediate values. The parameter is a good predictor of contaminant levels expressed as mean ERM quotients (Fig. 17). Adding abundance to the figure demonstrates that using bimodal threshold values may be misleading (Fig. 18). In this case, high-salinity and/or coarser-grained locations have high species richness and abundance. These locations were erroneously scored as impacted by chemical contamination using the bimodal threshold model. This relationship breaks down where percentage silt/clay equals zero (e.g., the coastal zone sites). This is not likely to be a problem for estuarine assessments, but it may be for ocean outfall sites. In those cases, using a parameter based on percentage sand/salinity yields an inverse, but equally strong, relationship with the ERM quotient.
A shortcoming of the nodal analysis in its current stage of development is a lack of quantitative expression for use in conjunction with a triad-type analysis. The absence of a successful approach to quantitative expression of community structure for testing purposes has been recognized for many years [36, 37]. However, statistical assessments of the range and variances of habitat parameters for an area, as defined by its resident assemblage, can be derived from the data by calculating abundance-weighted preference values based on individual species or sites or groupings. Additional analyses are in progress to address these facets. Data from Chesapeake Bay and San Francisco Bay, with less confounded contaminant and community gradients, have been assembled and are being tested using cluster analyses and other multivariate approaches.


