Effects of Flow Regulation on Shallow-Water Habitat Dynamics and Floodplain Connectivity
Abstract
Our study examined the effects of flow regulation on the spatiotemporal availability of shallow habitat patches with slow current velocity (SSCV patches) and floodplain inundation in the unregulated Yellowstone River and the regulated Missouri River in Montana and North Dakota. We mapped representative sites and used hydraulic models and hydrograph data to describe the frequency and extent of floodplain inundation and the availability of SSCV habitat over time during different water years. In the Yellowstone River the distribution, location, and size of SSCV patches varied but followed an annual pattern that was tied to the snowmelt runoff hydrograph. There was less variation in patch distribution in the Missouri River, and the pattern of habitat availability was influenced by flow regulation. Regulated flows and their effects on channel morphology and patterns of vegetation establishment resulted in 3.0–3.5 times less area of inundated woody vegetation during normal and dry years in the Missouri River compared with the Yellowstone River. The differences we observed in SSCV patch dynamics between rivers may have implications for fish populations and community structure through affecting the survival of early life stages. At a larger scale, the smaller area of vegetation inundated in the Missouri River suggests that nutrient cycling and the ecological benefits associated with a moving littoral zone are reduced by the altered flow and sediment regime in that river. Accurate assessments of the effects of flow alteration and successful efforts to restore riverine ecosystems will require consideration of physical and biotic processes that operate at multiple spatial and temporal scales.
Introduction
The character and persistence of large-river ecosystems are increasingly dependent on flow management and other human activities in river corridors. Large rivers throughout the world are affected by dams, diversions, channelization, levee construction, groundwater pumping, and changes in watershed land use (Ward and Stanford 1989; Benke 1990; Dudgeon 1992; Dynesius and Nilsson 1994). The type, magnitude, and extent of alterations strongly influence the interrelated responses of the river hydrograph, geomorphology, and ecosystem. Dams capture sediment and often reduce the magnitude and frequency of peak flows, resulting in downstream channel degradation, channel narrowing, and tributary headcutting (Petts 1984, 1985; Williams and Wolman 1984; Johnson 1994) and changes in substrate composition (Chien 1985; Stevens et al. 1995), channel morphology, and migration rates (Chien 1985; Copp 1989; Shields et al. 2000). Physical responses to channelization, levee construction, and groundwater pumping are similar and include downcutting (Daniels 1960; Prestergaard et al. 1994), reduced floodplain connectivity (Ward and Stanford 1989; Sparks 1992), and altered rates of channel migration (Shankman and Drake 1990).
Human-induced changes in the river corridor and the fluvial geomorphological responses that follow disrupt functions that support healthy river ecosystems. Successional processes and the maintenance of ecological diversity in floodplain forests require the periodic disturbances associated with flooding (Johnson 1992; Marston et al. 1995). Similarly, the structure of the riparian plant community is strongly influenced by the timing, duration, and magnitude of flooding (Scott et al. 1997; Auble and Scott 1998). Changes in riparian forests or plant communities associated with levee construction by humans often exacerbate downcutting, increase bank height, and increase the need for channel stabilization activities after alterations in flow or sediment regimes (Stanford 1994; Wick 1997). Channel stabilization and reductions in peak flows disconnect the river channel from the floodplain, reducing both channel migration rates and channel avulsion (rapid channel shift during flood flows; Shields et al. 2000). Additionally, changes in flow and sediment regimes can affect the formation and maintenance of islands, bars, and low-velocity backwater habitats that are important to a variety of terrestrial and aquatic organisms (Hesse et al. 1989; Gore and Shields 1995; Ligon et al. 1995; Shields et al. 2000). The evidence demonstrating ecological responses by various groups of organisms to alterations in flow and channels is extensive and compelling (reviewed in Poff et al. 1997). However, our knowledge of how large alluvial rivers function is limited by the range of time scales involved and the complexity of interactions among flow, sediment, and biota (Holly and Ettema 1993).
Understanding how flow alteration affects large-river ecosystems is particularly important given the level of alteration along most large alluvial rivers. In the Missouri River basin, more than 20 fish species are currently listed as rare, threatened, or of special concern by states or the federal government (U.S. Geological Survey 1998). Eight of the species of concern cited by the U.S. Geological Survey (1998) reside in the warmwater portions of the Missouri and Yellowstone rivers. The pallid sturgeon Scaphirhynchus albus is listed as endangered (U.S. Fish and Wildlife Service 1990) and two others, the sturgeon chub Macrhybopsis gelida and sicklefin chub M. meeki, have been proposed as candidates for such listing (U.S. Fish and Wildlife Service 1995). Five additional species indigenous to the Missouri and Yellowstone rivers are regarded as species of special concern (U.S. Geological Survey 1998): the paddlefish Polyodon spathula, flathead chub Platygobio gracilis, western silvery minnow Hybognathus argyritis, plains minnow H. placitus, and blue sucker Cycleptus elongatus. Proximate causes for the decline of native fishes in the Missouri River include changes in flow regime, sediment transport, habitat availability, and food web dynamics (Hesse et al. 1989).
Although the long-term viability of a species may be regulated by different factors at different life stages, poor recruitment arising from a lack of shallow-depth, slow-current-velocity (SSCV) habitat is a habitat-related bottleneck for many fish species. The SSCV habitat (for which quantitative definitions vary in different studies) has been demonstrated repeatedly to be an important growth and survival factor for young fish (Welcomme 1979; Kwak 1988; Nehring and Anderson 1993; Bovee et al. 1994; Scheidegger and Bain 1995; Copp 1997; Bowen et al. 1998; Freeman et al. 2001). The larvae and protolarvae of virtually all species share the common characteristics of diminutive size, poor swimming capability, and reliance on zooplankton, small insects, and detritus as primary food items (Hall et al. 1979; Papoulias and Minckley 1990, 1992; Muir et al. 2000). Zooplankton densities can, at times, be two or more orders of magnitude greater in backwaters than in the main channel (Mabey 1993; Ward and Stanford 1995). In addition, shallow water in combination with structural cover can reduce predation risk for small fish (Schlosser 1991; Ward and Stanford 1995). Therefore, the larvae of most fish species probably require shallow, slow-water refugia for some time between the free-embryo stage and full development of the axial skeleton, internal organs, and fins. The length of time that SSCV habitat is necessary undoubtedly varies among species.
In this study we used the general tenets of patch dynamics (Pringle et al. 1988; Townsend 1989) and flood pulse (Junk et al. 1989) concepts to guide an analysis of spatiotemporal variation in physical habitat in flow-regulated and unregulated reaches of two Great Plains rivers in the United States. Several studies since the early 1990s have evaluated the applicability of the flood-pulse concept in large, northern temperate rivers, most by relating hydrographs to fish abundance and community structure (Bayley 1991; Rutherford et al. 1995; Gutreuter et al. 1999; Galat and Zweimüller 2001). Studies of habitat patches and patch dynamics in lotic systems typically have involved zoobenthos (e.g., Hart and Resh 1980; Wickstrom and Wiegert 1980; Kohler 1985; Statzner and Higler 1986) or fishes (Angermeier and Karr 1984; Power 1984; Petty 1998) and focused on biotic and abiotic interactions at relatively small spatial scales. Because both large-scale spatial and temporal processes (flooding) and smaller scale processes (formation and persistence of habitat patches) are important in river ecosystems, analyses of the effects of flow regulation should include multiple spatial and temporal scales.
Our study examined the effects of flow regulation on the spatiotemporal availability of SSCV habitat patches and floodplain inundation. We mapped representative sites in the unregulated lower Yellowstone River and the regulated Missouri River and used hydraulic models and hydrograph data to describe both the availability of SSCV habitat patches and the frequency and extent of floodplain inundation over time during different water years. We focused on floodplain inundation because of the importance of flooding to river mechanics (Jiongxin 1997; Shields et al. 2000), habitat formation (Hesse and Sheets 1993; Ward et al. 1999), and nutrient cycling (Meyer and Likens 1979; Junk et al. 1989). We evaluated the spatial and temporal availability of SSCV habitat because of its role in primary and secondary production (Mabey 1993; Ward and Stanford 1995) and its function as a refugium and nursery habitat for young warmwater fishes (Welcomme 1979; Kwak 1988; Nehring and Anderson 1993; Bovee et al. 1994; Scheidegger and Bain 1995; Copp 1997; Bowen et al. 1998; Freeman et al. 2001). Patch density and size for SSCV habitats were compared to assess differences between rivers and illustrate how the kinds of spatial analyses typically used in terrestrial landscape ecology might be integrated into studies of lotic systems. We end by discussing the potential effects of changes in patch dynamics and floodplain inundation on fish communities.
Methods
Study area
Our study area included the lower 114 km of the Yellowstone River, from the Missouri River confluence upstream to a low-head diversion dam at Intake, Montana, and a segment of the Missouri River extending from the Yellowstone confluence 260 km upstream to Fort Peck Dam, Montana. The Yellowstone River is the longest free-flowing river in the continental United States and retains much of the character it had at the time of the Lewis and Clark expedition in 1806 (White and Bramblett 1993). Flows in the Missouri River downstream from Fort Peck Dam are substantially altered from the typical snowmelt runoff pattern evident in the Yellowstone River (Figure 1). Spring peak flows characteristic of snowmelt-driven rivers have essentially been eliminated. The greatest discharges typically occur during the late summer and fall (to aid navigation in the lower basin), when flows would naturally approach base-flow levels for the year.
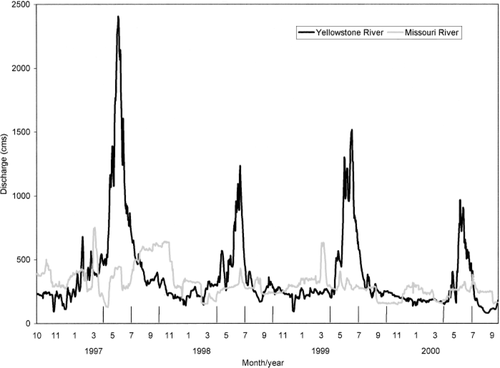
Daily stream flow hydrographs for the Yellowstone River at Sidney and the Missouri River at Culbertson for water years 1997–2000. Vertical lines represent hydroperiods defined as base flow (1 October–31 March), runoff (1 April–30 June), and recession (1 July–30 September).
Study sites were selected to physically represent segments of the Missouri and Yellowstone rivers described above and to overlie fish sampling sites delineated by federal and state agencies participating in a Missouri River benthic fish study (Dieterman et al. 1996). The lower Yellowstone River was represented by three study sites, Fairview, North Dakota, and Elk Island and Intake, Montana. The Fairview site, located at river kilometer (rkm) 12 (rkm 0 is the Yellowstone–Missouri River confluence) on the lower Yellowstone River, was 3 km long. The site contained one large depositional island, an extensive shoal, and a single tributary confluence. Fairview is characteristic of the lower 30 km of river and is representative of about 26% of the segment. Elk Island, located at rkm 80, was the most complex site, with 18–22 islands (at various discharges) and three small tributary confluences in the 5.5-km reach. One of the most striking features of this site was a very large avulsion island on the east side of the river. Elk Island is representative of about 50 km, or approximately 44% of the segment. Intake, located at rkm 100, is representative of the remaining 30% of the segment. This site was 4.9 km long and contained 13 islands or mid-channel bars but had no tributary inflows. Mean annual flow for the Yellowstone River near Sidney, Montana, was 363 m3/s (1911–1999).
Two sites, at Frazer and Culbertson, Montana, were used to describe the Missouri River study segment. Culbertson was located at rkm 58 and was 6.2 km in length. Frazer was located at rkm 224 and was 6.7 km long. Mean annual flow (during 1942–2000) for the Missouri River near Culbertson was 295 m3/s. Both sites were characteristic of the study segment downstream from Fort Peck Dam, and representation of the segment was divided equally between them. Structural complexity of these sites generally was less than that in the lower Yellowstone River sites. There were seven islands or bars in the study site at Culbertson and six at Frazer. Both sites had extensive shoals that extended out from the banks and formed between the islands. At low discharges, these shoals appeared as large, barren sandflats or mudflats. Remnants of avulsion islands are also apparent at both sites, but the side channels forming them largely have been abandoned. Although the absence of tributary confluences in the mapped area at either site could introduce a potential bias in habitat area calculations, the tributaries in the Yellowstone River study sites were small. According to the mean daily flows during the runoff periods for 1997–2000 (640 m3/s), tributaries accounted for less than 0.45% of the total wetted area of the three Yellowstone study sites. The proportionally small area of tributaries in the Yellowstone sites suggests that any bias in habitat calculations was negligible.
Study approach
As a general procedure, we used a two-dimensional hydrodynamic simulation model and a geographical information systems (GIS) approach to generate habitat classification maps of each site for flows ranging from about 28 m3/s (1,000 cubic feet per second [cfs]) to more than 2,800 m3/s (100,000 cfs). We extracted various statistics (e.g., class area, mean patch size, patch density) from each map and performed habitat time series analyses of SSCV (depth less than 1 m, velocity less than 0.25 m/s) habitat. We also used the GIS to analyze the spatial distribution of SSCV habitat and the area of inundated riparian vegetation in the river corridor at various discharges for each site.
Data collection
Input to the two-dimensional hydraulic model consisted of a topographic (x, y, z) description of the study site, a roughness parameter for each (x, y) location, inflow discharge, and downstream (exiting cross section) water surface elevation. Topographic data for floodplains, permanent islands, and other above-water features were obtained from aerial photogrammetry. Echo sounding and conventional ground surveys were used to obtain bathymetric data for the underwater channel bed (see Cluer 1999 for a similar application). All data were projected as Universal Transverse Mercator (UTM) coordinates, referenced to the nearest National Geodetic Survey benchmark.
Contractors conducted the photogrammetric analysis using 1:40,000-scale positive transparencies (U.S. Geological Survey National Aerial Photogrammetry Program). We used survey-grade GPS and conventional surveying techniques to obtain ground control and calibration data for the photogrammetric analysis. In addition, we surveyed the tops and toes of banks and the perimeters and surfaces of islands, bars, and shoals to ground-truth and supplement the photogrammetry data.
Bathymetric data were collected by using a boat-mounted echo sounder in conjunction with a survey-grade GPS receiver. Channel features such as margins, bars and islands, secondary channels, and tributaries were traced with the echo sounder. Additional data were collected longitudinally along traces spaced 10–20 m apart between the channel feature traces. Where the water was too shallow for echo sounding (<30 cm deep), we used an electronic total station (which measures horizontal and vertical distances and angles) or a GPS rover.
Water surface elevations and positions were measured at intervals of 200–300 m along both sides of the channel to generate a map of the water surface throughout each study site. In subsequent postprocessing, echo sounder depths were subtracted from corresponding water surface elevations to obtain the elevation of the streambed at each sounded point. Because the discharge varied throughout the measurement period, a staff gauge was installed near the center of each site and read at periodic intervals (1–2 h). From the recorded times and stage change data, we could normalize the bathymetric and water surface data to a single discharge and water surface profile before calculating the bed elevations.
At the completion of the water surface profile survey, discharge was measured at one or more locations in each site. The measured discharges were used to set boundary conditions for the calibration of the two-dimensional hydraulic model. At sites with multiple channels, we also measured the flow in some of the larger side channels. Although not necessary as boundary conditions, the additional discharge measurements were used to fine-tune the models to correctly partition discharge around the islands.
Hydraulic simulation
The River-2D two-dimensional (depth-averaged) model developed at the University of Alberta (Ghanem et al. 1995, 1996) was used to simulate depths and water velocities at unmeasured flows. We chose this model because it can predict regions of supercritical flow and associated transitions and can accommodate lateral wetting/drying boundaries of the surface flow without user intervention.
A two-dimensional finite-element computational mesh consisting of linear triangular elements was generated for each site. The mesh was created in an unstructured fashion with the primary criterion for refinement being topographic matching, assessed visually by overlaying contour maps in the mesh generation program. At each node, bed elevation and roughness height were specified and were assumed to vary linearly over each triangle. The computational domain was extended about 120 m in the upstream and downstream directions to minimize the effect of inflow and outflow boundary conditions on flow characteristics at the upstream and downstream limits of the study sites.
For calibration, we provided boundary conditions of inflow discharge and the measured water surface elevation at the outflow. Calibration was achieved by scaling the roughness values for different parts of each study site. Our primary criterion for calibration was matching the predicted and measured water surface profiles for the site. In general, this criterion was satisfied if the predicted water surface elevations were within 2 cm/km of the measured values. Calibrations were fine-tuned by matching the partitioning of discharges around islands and bars.
Simulation runs required boundary conditions (inflow discharge and outflow water surface elevation) from stage−discharge relations that were either developed on-site or extrapolated from a nearby U.S. Geological Survey stream gauge. A file of node attributes was created at the completion of each simulation, for input to habitat mapping and spatial analysis programs. These files contained information regarding location (coordinates), predicted depth, and predicted velocity at each node in the mesh.
Habitat mapping
The Arc/Info GIS (ESRI 2000) was used to construct grid maps from the attribute files generated by the hydraulic simulations. These grids were reclassified into categories of depth and velocity and then combined to create composite maps of depth–velocity classes. We then converted the grid maps to a polygon format (i.e., from raster to vector format) to facilitate spatial analysis. We generated composite habitat maps representing 18 different discharges (23–2,946 m3/s) for the three Yellowstone River sites and 13 discharges (28–2,720 m3/s) for the Missouri River sites.
Three spatial metrics were selected to describe the availability and distribution of SSCV habitat over time: normalized class area, mean patch size, and patch density. The basic unit for spatial analysis is the patch, defined as a relatively homogeneous ecological unit that is more alike in some attribute (or combination of attributes) than is the landscape as a whole (McGarigal and Marks 1995). A class is an aggregation of all like patches within a landscape. In the context of this study, a patch is equivalent to a single polygon of SSCV habitat in the mosaic, whereas a class is the sum of all polygons belonging to the same depth–velocity categories. Normalized class area was calculated as total class area divided by the length of the main channel in the site. Class areas were normalized to compensate for the different lengths of the study sites. Likewise, patch density was calculated as the number of patches (polygons) of SSCV habitat divided by main-channel length. Mean patch size was calculated as total area of a class divided by the total number of patches.
We postulated that the location of a habitat patch might influence its biological value. For example, a patch of SSCV habitat located over a sand bar might not be as valuable as the same patch type located in a secondary channel or on the floodplain. We analyzed the distribution of SSCV habitat among seven mesohabitats within each study site: main channel, main-channel margin, secondary channels, secondary-channel margins, sand bars, vegetated islands, and floodplain.
Mesohabitats were manually digitized from orthorectified aerial photos in conjunction with maps of the water's edge at different discharges. Edges of banks and permanent islands were located where the same water line occurred at several discharges. A channel margin was defined as a polygon extending from the edge of a bank into the channel for 10 m. Locations of secondary channels were determined from the photographic image, superimposed with the water lines from high-flow simulations. Conversely, locations of sand bars were delineated as exposed areas from low-flow water lines. Vegetated areas were digitized directly from the aerial photographs. The distribution of SSCV habitat patches among the seven mesohabitat types was determined by intersecting the polygons from both maps. Where a SSCV polygon was intersected by one or more mesohabitat polygons, it was partitioned according to the boundaries of the mesohabitat feature and reclassified.
Floodplain connectivity was evaluated by quantifying the area of tree canopy in the inundation zone (CIZ) at various discharges. In this study, we included canopied areas on permanent islands as well as on the actual floodplain, but we made no distinction between cottonwood (Populus deltoides) stands and willow thickets (predominantly Salix extigua and S. amygdaloides). Polygons of canopied areas were digitized manually from the orthophotos and clipped with the area of inundation as determined from the hydraulic simulations. The result was a map of cooccurrence of surface water with canopy at different discharges. This method was chosen because semipermanent vegetation is a source of allochthonous nutrient input, provides structural cover for small fish, and is correlated with the extent of the present-day floodplain.
Habitat time series
We based the habitat time series analysis on the daily discharge records for water years 1997–2000. This period coincided with the benthic fish-sampling program conducted by the Montana Department of Fish, Wildlife, and Parks (Dieterman et al. 1996) and included a range of water year types. Water year 1997 was wetter than normal (recurrence interval, approximately once in 5 years) 1998 and 1999 were near normal, and 2000 was drier than normal. Stream flow records for the Yellowstone River were obtained from the U.S. Geological Survey gauge at Sidney, Montana, and those for the Missouri by using the gauges at Wolf Point and Culbertson.
Time series of normalized class area, patch density, mean patch size, and normalized CIZ values were constructed for each site following the basic procedures outlined in Bovee et al. (1998). Habitat values for each day in the time series were weighted according to the length of stream represented by each site and then were averaged. This procedure allowed us to estimate the characteristics of the river segments from individual site data.
Each time series was parsed into hydroperiods based on hydrologic and biological considerations. The base-flow hydroperiod was defined from 1 October to 31 March for each year. The runoff period was defined from 1 April to 30 June. This hydroperiod encompasses the annual snowmelt runoff, as well as the spawning period of most of the fish species endemic to the upper Missouri River basin. The period from 1 July through 30 September was defined as the recession hydroperiod, during which stream flows transition from runoff to base flow.
Results
Normalized Class Area
Throughout the recession and base-flow periods, the average area of SSCV habitat was 47% greater in the Yellowstone River than in the Missouri River. During the peak runoff periods, however, this habitat type was less in the Yellowstone River than in the Missouri River (Figure 2). Precipitous declines in Yellowstone River SSCV habitat occurred at moderately high discharges associated with the rising and falling limbs of the hydrograph (Figures 1 and 2). In the Yellowstone River, SSCV area decreased at discharges greater than 500 m3/s, reached a minimum at 1,100 m3/s, and then rebounded rapidly when the discharge exceeded 2,000 m3/s. Within the range of 500–2,000 m3/s, the flow was too deep or swift to provide appreciable SSCV habitat within the main channel, yet was not high enough to inundate vegetated islands or floodplains. Once the flow inundated the side channels and islands, the amount of SSCV area increased rapidly. A similar pattern of decrease in SSCV habitat area with increasing discharge occurred on the Missouri River during the 1997 recession and early 1998 base-flow periods (Figure 2), when excess storage was released from Fort Peck Reservoir between July and November.
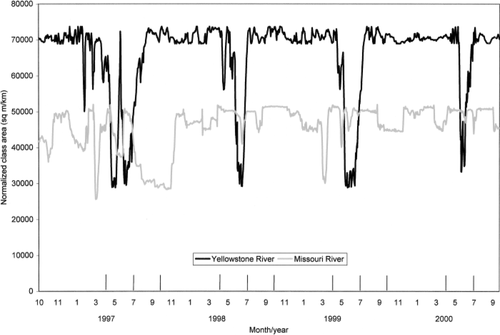
Time series of normalized class areas (m2/km) for shallow, slow-current-velocity habitat in segments of the Yellowstone and Missouri rivers for water years 1997–2000.
Patch Density and Mean Patch Size
Patch density and size were consistent over time in the Missouri River but varied greatly in the Yellowstone River (Figures 3, 4). Throughout the recession and base-flow periods, patch density was about the same in both rivers, but patches in the Yellowstone were 35–50% larger (Figure 4). During runoff, however, patches of SSCV habitat in the Yellowstone River were more abundant and considerably smaller than those typical during recession and base flow. This phenomenon suggests that SSCV habitat may become more dispersed in the Yellowstone River during runoff periods, and more contiguous during recession and base flow. This pattern of change in patch distribution was not as evident in the Missouri River.
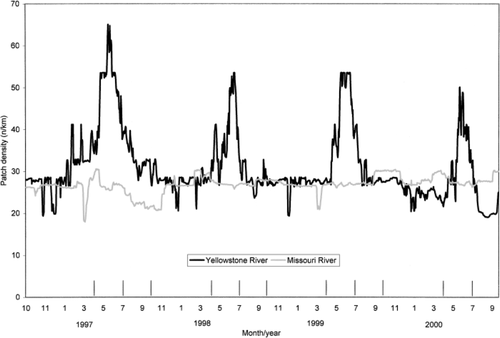
Time series of patch density (number/km) for shallow, slow-current-velocity (SSCV) habitat in segments of the Yellowstone and Missouri rivers, for water years 1997–2000
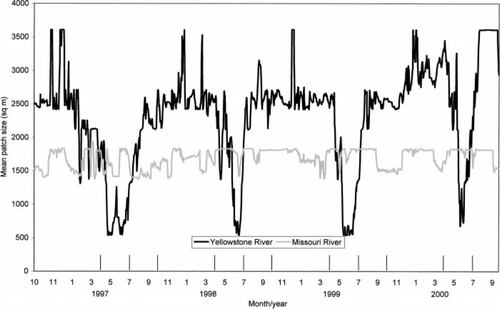
Time series of mean patch size (m2) for SSCV habitat in segments of the Yellowstone and Missouri rivers for water years 1997–2000
Spatial Distribution of SSCV Habitat
During runoff in a wet year (1997), most of the SSCV habitat in the Yellowstone River was associated with side-channel margins, vegetated islands, and floodplains (Table 1; Figure 5). In the Missouri River, this habitat was found predominantly in side channels, along the main channel and over unvegetated sand bars (Figure 6). As discharge decreased in the Yellowstone River, SSCV habitat migrated and expanded into side channels, bars, and the margins of vegetated islands. Locations of SSCV habitat generally remained the same in the Missouri River, but habitat area decreased. This reduction in habitat area was caused by greater discharges during 1 July–30 September (typical recession period) than during 1 April–30 June (typical runoff period) in the Missouri. Under base-flow conditions, SSCV habitat in the Yellowstone River migrated farther away from the small secondary channels, occurring more extensively along the main channel and in the larger side channels. During the same period, SSCV habitat in the Missouri occurred primarily over extensive sand bars, in the main channel, and in some of the larger side channels.
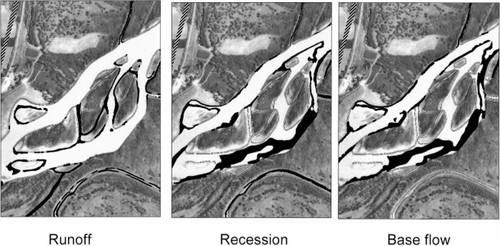
Distribution of SSCV habitat (black shading) during runoff, recession, and base flow in a portion of the Elk Island site on the Yellowstone River during the 1997 water year. Hatching represents the model boundary
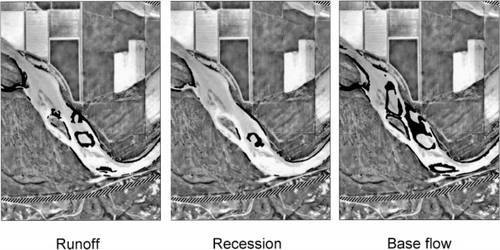
Distribution of SSCV habitat (black shading) during runoff, recession, and base flow in a portion of the Culbertson site on the Missouri River during the 1997 water year.
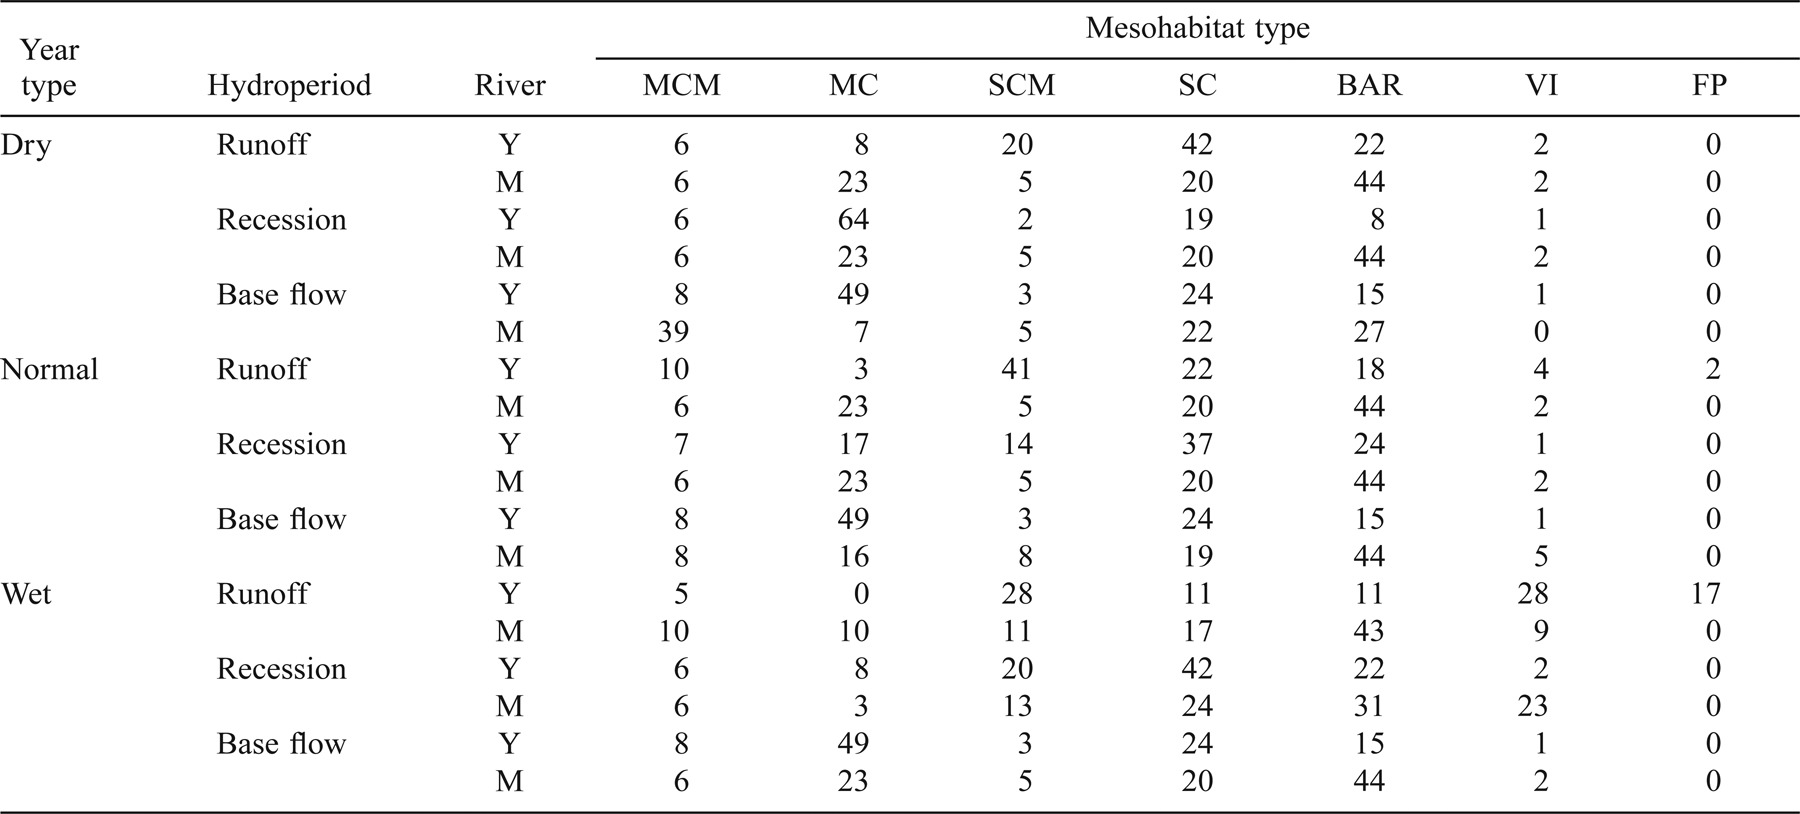
A similar pattern was observed in normal and dry water years (1998–2000), with a few notable exceptions (Table 1). In the Yellowstone, SSCV habitat during runoff was less associated with vegetated islands and floodplains and more closely tied to side channels and channel margins. The pattern of migration and expansion of SSCV habitat into large secondary channels and main-channel margins during recession and base flow was similar during all water years in the Yellowstone. In the Missouri, the pattern of habitat distribution during normal and dry years was the reverse of the wet year distribution. As was true for 1997, most of the SSCV habitat in the Missouri occurred over sand bars and in main-channel margins; during the base-flow period, however, instead of increasing in area the patches became smaller during normal and dry years. This difference is related to releases from Fort Peck Dam to augment base flows in the fall to serve downstream navigation.
Floodplain Connectivity
During years of normal to below-normal runoff, the CIZ area in the Yellowstone River was 3.0–3.5 times larger than in the Missouri River (Figure 7). The greatest difference occurred during the 1997 runoff, when the average CIZ in the Yellowstone River was 4.5 times larger and the maximum 6.4 times larger than in the Missouri River. Observed differences in floodplain inundation between rivers resulted largely from the lower flows in the Missouri River compared with the Yellowstone rather than from differences in canopy area.

Time series of canopy area in inundation zone (m2/km) in segments of the Yellowstone and Missouri rivers for water years 1997–2000. Vertical lines represent hydroperiods defined as base flow (1 October–31 March), runoff (1 April–30 June), and recession (1 July–30 September)
Discussion
The lower Yellowstone River and the Missouri River below Fort Peck Reservoir are close geographically, yet the characteristics of the present-day streams are fundamentally different. The hydrologic regime of the Yellowstone River maintains natural timing and magnitudes associated with runoff, recession, and base flows. Regulation of the Missouri River by Fort Peck Dam has resulted in a highly modified hydrologic regime; peak flows are substantially truncated, recession is poorly defined, and discharges during the base-flow period are commonly higher than during the runoff period. Whereas discharges during 1997–2000 ranged over an order of magnitude (i.e., more than 10-fold) between runoff and base flow in the Yellowstone River, they differed by barely twofold in the Missouri River.
Changes in flow and sediment regime since the closure of Fort Peck Dam have resulted in decreased bed elevations and reduced channel migration rates downstream. Between 1936 and 1973, mean bed elevations between the dam and 76 km downstream decreased by as much as 1.7 m (Williams and Wolman 1984). Rates of channel migration have decreased by a factor of four since closure of Fort Peck Dam (Shields et al. 2000). These geomorphological responses to alteration in flow and sediment regime in the Missouri River have resulted in differences in channel dynamics and vegetation succession between the two rivers, as manifested in the patch dynamics of SSCV habitat and the extent of floodplain inundation. A limitation of this study was that differences in habitat availability and floodplain inundation were based on measurements of the existing channel and hydrologic regimes. We did not account directly for the influence of predevelopment differences in channel form and processes. Sites were selected to be representative of the two rivers. However, the number of sites we were able to study was limited (two sites in the Missouri River and three sites in the Yellowstone River), and there may be differences in how the rivers function at locations that were not sampled.
The Yellowstone River exhibited a consistent temporal pattern of SSCV patch distribution from the runoff peak through base flow. Although the amplitude of the pattern varied somewhat from year to year, the same sequence of events occurred in wet, normal, and dry years. As discharge increased on the rising limb of the runoff hydrograph, SSCV patches in the Yellowstone River became smaller but more abundant, resulting in a dispersed patch distribution. At flows typical of the mean annual flood (around 1,500 m3/s), about 51% of the SSCV habitat in the Yellowstone River was located in connected side channels and in extended areas of back-flooded tributaries (eupotamon and parapotamon respectively, as described by Ward and Stanford 1995). Overbank flooding was not extensive along the Yellowstone River during the study period, so the advancing littoral as described by Junk et al. (1989) and Bayley (1991) occurred more on the permanent, vegetated islands than on the floodplain. Secondary channels, classified as eupotamon (Ward and Stanford 1995), tended to be relatively long and narrow compared with those in the Missouri. Periodic wetting and drying in these small channels allowed colonization by hydrophilic vegetation such as willow and dogwood Cornus spp. In addition, leaf litter and snow tended to collect in these channels during the dry periods of autumn and winter, providing a ready source of partially decomposed organic material in spring. During recession, SSCV patches in the Yellowstone River migrated toward the main channel through the larger side channels and formed large contiguous patches. The total area of SSCV habitat during recession and base flow was approximately double the amount available during runoff, and mean patch size increased from around 1,700 m2 during runoff to 2,600 m2 at base flow.
Although extensive areas of SSCV habitat occurred in the Missouri River, the patches were comparatively static. Because of the relatively constant discharge, the wetting and drying of vegetated areas was less common in the Missouri River. Patches of SSCV habitat generally remained in the same locations over time, with little variation in size or number. In addition, the persistence of shallow water (perhaps in combination with a highly mobile substrate) in the secondary channels appeared to prevent establishment of higher woody plants. Consequently, 85% of the SSCV habitat of the Missouri River occurred over sandbars, in large secondary channels, and in the main channel, all of which had little or no vegetation. Only during the 1997 recession and early 1998 base-flow periods was a substantial area of vegetated island habitat inundated in the Missouri River (Figure 7). This minor flooding period resulted from releases of excess storage from Fort Peck that had accumulated during the high 1997 runoff period. The unusual timing of peak flows during 1997–1998 probably reduced any beneficial effects of inundation for aquatic and riparian organisms with life cycles tied to natural flow patterns.
Our analysis of CIZ areas serves as a corollary to the SSCV patch dynamics observed in the two rivers. The maximum area of flooded woody vegetation was 3.0–3.5 times greater during runoff in the Yellowstone River than in the Missouri during normal and dry years and more than 6 times higher during 1997 (Figure 7). Comparison of CIZ versus discharge relations among sites indicated that less extensive floodplain inundation in the Missouri River is attributable to low discharges rather than differences in canopy area between rivers. The observed inundation of vegetated areas during the 1997 runoff supports the concept of a moving littoral in the Yellowstone River of greater extent than indicated by SSCV habitat area alone.
During recession and base flow, SSCV habitat patches in the Yellowstone migrated toward the main channel and consolidated into large contiguous patches. Several aspects of these patch dynamics may be beneficial to growth and survival of age-0 fish. First, the recession from vegetated side channels and islands may result in an export of nutrients, zooplankton, terrestrial and benthic invertebrates, and organic debris to SSCV areas in the main channel. This phenomenon has been widely reported in various floodplain rivers (Castella et al. 1984; Welcomme 1985; Shaeffer and Nickum 1986; Saunders and Lewis 1988). Second, small fish may benefit from the increase in patch size that occurred during recession and base flow. As the patch sizes increased, shallow, slow water was superimposed over a variety of mesohabitats, effectively increasing the diversity of the SSCV areas. For example, during a typical Yellowstone River recession flow of around 425 m3/s, SSCV habitat was distributed among main-channel margins, the main channel, side channels, side-channel margins, and sand bars (Table 1). Such spatial heterogeneity may provide opportunities for segregation of species and size classes, thereby reducing interspecific competition and predation risk. The increased size of the Yellowstone River SSCV patches might also allow a reduction in larval densities within a patch, further reducing competition and predation risk. The continued migration of SSCV patches toward the main-channel areas would facilitate transition to flowing water habitats for the fluvial specialist and fluvial-dependent species during ontogenic shifts in habitat use.
Because there was little variation in discharge between the runoff, recession, and base-flow periods, SSCV habitats in the Missouri River generally were static. They remained in similar locations year-round and did not fluctuate appreciably in size or number. Furthermore, there was little contact between SSCV areas and terrestrial vegetation. During all hydroperiods, the spatial distribution of SSCV habitat was more homogeneous in the Missouri River than in the Yellowstone River. At a discharge of around 280 m3/s, typical of all periods in a normal water year, SSCV habitat area in the Missouri was most commonly associated with the main channel, large side channels, and sandbars (Table 1). Relatively little SSCV habitat was created in the margins of the main channel or side channels. We suspect that in both rivers, colonization of SSCV habitats by drifting larvae is facilitated by eddies and countercurrents around channel irregularities. However, the SSCV areas that could be colonized in the Missouri River were less extensive, less diverse in mesohabitat location, and possibly not as productive as those in the Yellowstone River.
Conclusions
Changes in flow and sediment regime in the Missouri River since the closure of Fort Peck Dam have altered river geomorphology downstream (Williams and Wolman 1984; Shields et al. 2000). We postulate that the interrelated effects of changes in geomorphology and altered flow regime contributed to differences in the dynamics of SSVC habitat patches and the extent of floodplain inundation between the Missouri and Yellowstone rivers. In the Yellowstone River, the distribution, location, and size of SSCV patches followed an annual pattern tied to the snowmelt runoff hydrograph: small, dispersed patches in side channels and tributary backwaters migrated to the main channel during recession and formed large, contiguous patches. Because of relatively constant discharge, variation in mean patch size, patch density, and location of patches was smaller in the Missouri River than in the Yellowstone River. Similarly, more consistent flows, and their effects on channel morphology and patterns of vegetation establishment resulted in 3.0–3.5 times less area of inundated woody vegetation during normal and dry years in the Missouri River than in the Yellowstone River. Based on evidence from other studies, the differences we observed in SSCV patch dynamics between the two rivers may have implications for fish populations and community structure by affecting the survival of early life stages. At a larger scale, the smaller area of inundated canopy in the Missouri River than in the Yellowstone suggests that nutrient cycling and ecological benefits associated with a moving littoral zone are reduced by alteration in flow and sediment regime in the Missouri River.
Accurate assessment of the effects of flow alteration and efforts to restore riverine ecosystems will require consideration of physical and biotic processes that operate at multiple spatial and temporal scales. This study demonstrated effects of flow alteration on large scale (flooding) and small scale (habitat patch) variables. Our next step entails using fish collection data to help evaluate the biological significance of these results. In addition to the scales we studied, future work should examine effects at intermediate spatiotemporal scales that influence longitudinal connectivity in lotic systems.
Acknowledgments
We thank Mike Ruggles and Dave Fuller with the Montana Department of Fish Wildlife and Parks for logistical support and help with field work. We extend our appreciation to Bob Waltermire with the U.S. Geological Survey for expert help with GIS questions. Reviews and comments by Tammy Newcomb, Butch Roelle, Mike Scott, Jim Terrell, and an anonymous reviewer greatly improved the manuscript. Funding for this work was provided by the U.S. Bureau of Reclamation and the U.S. Geological Survey.


