Associations between Water Quality and Daily Growth of Juvenile Shortnose and Lost River Suckers in Upper Klamath Lake, Oregon
Abstract
Poor water quality from hypereutrophic Upper Klamath Lake in south-central Oregon has been suspected of contributing to the recruitment failure of two endangered endemic fish species, the Lost River sucker Deltistes luxatus and the shortnose sucker Chasmistes brevirostris. We used otolith daily increment widths as a proxy for juvenile somatic growth to construct two growth models: (1) a linear mixed-effects (LME) model examining the lifetime effects of lakewide averages of potentially stressful daytime water temperature, pH, and nighttime dissolved oxygen (DO), and (2) a simple linear regression model examining the effects of locally measured water temperature, pH, and daytime DO on growth of fish over 3 d before the fish's capture. Graphical relationships between daily growth and biweekly un-ionized ammonia failed to show a sublethal effect on the growth of suckers captured in areas where un-ionized ammonia surpassed levels lethal to both species. For both species, our LME models indicated that at temperatures greater than approximately 22°C, low nighttime DO (less than 4 mg/L for Lost River suckers and less than 1 mg/L for shortnose suckers) caused enough stress to reduce growth, whereas at temperatures less than approximately 22°C, any stress from low nighttime DO was not reflected in reduced growth. We attribute the pattern to the species' tolerance of low DO, the short duration of nighttime events, the fish's increased oxygen demand at higher temperatures, and growth compensation due to increased food resources associated with low DO. The combination of low DO and high temperature has also been implicated in adult fish kills in Upper Klamath Lake. Because 34% of the time lakewide August average temperatures exceeded 22°C, extended periods of warm temperatures and high primary production could affect the sizes of recruits surviving into fall. Both growth models suggested that shortnose suckers might be more tolerant of poor water quality than Lost River suckers.
Introduction
The shortnose sucker Chasmistes brevirostris and Lost River sucker Deltistes luxatus are endemic to the Upper Klamath Basin of southern Oregon and northern California. Upper Klamath Lake in south-central Oregon is the primary refuge for both species (Buettner and Scoppettone 1990). Although historically abundant, these species were listed as endangered (USFWS 1988) because populations were declining in size and aging, which was due to apparent recruitment failures since the early 1970s. Population declines have been linked to high fishing pressure (Bienz and Ziller 1987), water diversions, habitat reduction, hybridization, competition with and predation by exotic species, and poor water quality associated with agricultural and timber harvest practices around the lake and its tributaries (USFWS 1988).
Poor water quality in hypereutrophic Upper Klamath Lake has been suspected of contributing to recruitment failure, and improving water quality has become a primary management objective. During summer, massive blooms of the blue-green alga Aphanizomenon flos-aquae occur in Upper Klamath Lake and contribute to large diurnal fluctuations in dissolved oxygen (DO) and pH (Phinney et al. 1959; Bortleson and Fretwell 1993; Kann and Smith 1999). In addition, postbloom algal decay contributes to high, toxic levels of un-ionized ammonia and low nighttime levels of DO (Phinney et al. 1959; Bortleson and Fretwell 1993; Martin and Saiki 1999). The resulting poor water quality has been implicated in adult fish kills during summer (Perkins et al. 1996, 2000). Low summer lake levels, caused by the natural hydrological cycle and by diversions at the southern outlet of the lake, may worsen water quality (Barbiero and Kann 1994; Wood et al. 1996).
Year-class survival is related to lake level and weather (D. Markle, Oregon State University, unpublished data), but the relationships among water quality, lake level, algal blooms, and sucker growth are unknown. Early growth rates are important and can influence the duration of early life history stages and associated mortality rates, ultimately influencing recruitment (Houde 1987). If a relationship between otolith increment width and somatic growth is validated (Secor and Dean 1989), daily otolith increments allow estimates of these growth histories (Campana and Neilson 1985; Bradford and Geen 1987). Daily otolith increment deposition has been validated for both shortnose and Lost River suckers (Hoff et al. 1997), and our preliminary analyses indicated that, under nonlethal conditions, otolith and juvenile somatic growth are coupled in both species (Simon et al. 1996). However, during stressful conditions, otolith growth and somatic growth can become uncoupled, as somatic growth slows or stops and metabolic-dependent otolith growth continues or increases (Gutiérrez and Morales-Nin 1986; Molony and Choat 1990; Bradford and Geen 1992).
In this study we describe juvenile Lost River and shortnose sucker growth throughout their first summer and relate variation in daily otolith growth to daily water quality variables. Using daily increment widths as a proxy for daily growth, we investigated the relationship between otolith and somatic growth, developed general growth models, and applied those models to a smaller subset of suckers.
Study Area
Upper Klamath Lake is located in south-central Oregon at the semiarid base of the Cascade Mountains' eastern slope, northwest of Klamath Falls, Oregon (Figure 1). The largest of the Klamath River system lakes, Upper Klamath Lake has a mean surface area of 360 km2 and a mean depth of 2.4 m (Wood et al. 1996). Lake elevation is controlled at the southern outlet by Link River Dam and typically ranges between 1,261.1 and 1,263.0 m above sea level (Buettner and Scoppettone 1990).

Map of Upper Klamath Lake, Oregon, showing years and locations where water quality characteristics were measured, 1994–2001. Abbreviations are as follows: WQ = locations where daytime water temperature, daytime pH, and nighttime dissolved oxygen concentrations were measured; NH3-N = sites where the daytime un-ionized ammonia concentration was measured.
Historical records indicate that Upper Klamath Lake has been eutrophic since its discovery by European settlers (Wood et al. 1996); however, the lake has become hypereutrophic and developed near-monoculture blooms of A. flos-aquae from late spring through early fall. These blooms, which occur lakewide and produce thick scums that vary in density and lake location (Bortleson and Fretwell 1993), coupled with decreasing summer lake levels, contribute to wide interannual, intraannual, and diurnal fluctuations in water quality. Summer water temperatures can reach 30°C at the surface and commonly are 22–24°C in the upper 1–2 m. Summer DO concentrations often exceed 16 mg/L during peak algal photosynthesis but can drop to 0.2 mg/L throughout the water column because of algal respiration, algal decay, and water column stability. The pH is photosynthetically elevated, commonly varies between 8 and 10, and may exceed 10 during peak algal productivity (Phinney et al. 1959; Kann and Smith 1999; Martin and Saiki 1999). Bloom decay, agricultural runoff, and sediment leaching are possible sources of ammonia to Upper Klamath Lake (Wood et al. 1996). Un-ionized ammonia is toxic to fishes at relatively low concentrations (Tucker et al. 1984; Rasmussen and Korsgaard 1996; Saiki et al. 1999), and in 1997 un-ionized ammonia concentrations in Upper Klamath Lake reached levels toxic to suckers, as judged by median tolerance limits computed by Saiki et al. (1999).
Methods
Sample collection
Shortnose and Lost River suckers were collected from Upper Klamath Lake in 1991 and 1993–2001 with a variety of gears, including a larval fish trawl (0.8 × 1.5 m with a 2.5-m Nitex net of 1,000-μm-bar mesh), a 6.1-m beach seine (2-m × 2-m × 2-m bag and 4.8-mm-bar mesh), a 5-m diameter multifilament cast net (6.3-mm-bar mesh), and a 5-m semiballoon otter trawl (16-mm-bar mesh, 6-mm-bar mesh liner, and attached tickler chain). Larval and juvenile suckers were collected during annual surveys from late spring through early fall and preserved and stored in 95% ethanol. Late-season samples from beach seine, cast net, and otter trawl were selected for otolith analyses. Bottom water temperature, pH, and dissolved oxygen were measured at the time of capture at each site using a Hydrolab Reporter Multiprobe and Surveyor 3 Display Logger.
Lakewide water quality data
Average daily water temperature, pH, and DO were obtained from 11 open-water sites in Upper Klamath Lake from 1994 through 2001 (Figure 1). Averages were calculated at times that water quality would be most stressful to fishes (1100–1500 hours for water temperature and pH; 0400–0800 hours for DO). Biweekly depth-integrated ammonia nitrogen samples at each of nine Upper Klamath Lake sites (Figure 1) were collected by combining three replicate hauls from a weighted 5-cm-diameter plastic tube that extended the length of the water column. This composite sample was then mixed and portioned off to appropriate collection bottles for the analysis of ammonia nitrogen at each station (APHA 1985). The toxic un-ionized fraction of ammonia was then computed based on water column mean pH and temperature (Emerson et al. 1975).
Otolith preparation
All suckers brought back to the laboratory were identified to species, and standard lengths were measured to the nearest 0.1 mm. Right lapilli, removed using a dissecting microscope and fine probes, were cleaned in 10% bleach for several minutes, rinsed twice with distilled water, and given a final rinse of 95% ethanol to remove any residual moisture (see Brothers 1987).
Each lapillus was mounted distal side up with thermoplastic resin on a petrographic slide. To gain proximity to the core, otoliths were ground by hand along the sagittal plane with 1,500-grit wet/dry sandpaper and polished with a synthetic velvet cloth and 0.05-μm alumina powder. The otolith was flipped several times during grinding and polishing to create a thin section showing visible increments along the entire diameter of the otolith (see Secor et al. 1991).
Daily increments were counted and measured to the nearest 0.0001 μm via a digital imaging system equipped with Optimas 5.0 (1995) software. A counting transect from core to edge along the leading growth axis was consistently used for counting and measuring otolith increments. An otolith radius was determined by summing the individual increment widths measured along the growth axis. All counts and measurements were made without information regarding species, fish length, or catch date. Otoliths from 1991 to 1997 were read once; otoliths from 1998 to 2001 (N = 473) were read three times on different dates to obtain an estimate of precision. An average percent error of 2.19% was estimated using procedures outlined in Beamish and Fournier (1981), indicating relatively high reading precision. The median age (and increment widths associated with that age) obtained from the three reads was used in all subsequent analyses.
To determine otolith–fish size relationships, we regressed otolith radius on standard length for all species–year combinations. Hatch dates, determined by subtracting the age of each fish in days from its date of capture, were used to assign fish to five cohorts, established by dividing the entire hatching period into 20-d groups: cohort 1 = March 31–April 19, cohort 2 = April 20–May 9, cohort 3 = May 10–May 29, cohort 4 = May 30–June 18, cohort 5 = June 19–July 8. The 20-d groupings approximated the duration that larvae were vulnerable to our sampling gears. Residuals from the regressions were then plotted against cohort to test assumptions for constant and independent variance of residuals.
Modeling the baseline growth curves
We assumed that the growth trajectory of a fish was determined by genetic, ontogenetic, and temporally varying environmental factors. To isolate environmental effects, one must specify a baseline growth curve, (i.e., a trajectory of increment width versus age that would be expected for fish growing in identical, unchanging environments) and properly account for serial correlation of increment widths in an individual. In the absence of empirical information on the form of such a curve, we experimented with a variety of possible baselines and developed a species-specific smoothed trajectory for each fish, which we created by averaging increment widths for each age of that species collected in 1991 and 1993–2001 (Figure 2). We limited the number of fish used to construct our baselines to specimens caught from mid-July through early October of each year (449 Lost River and 561 shortnose suckers) to facilitate species identification and to ensure that fishes would have experienced wide ranges in water quality. Even though the horizontal axis in our baseline represents age, not calendar date, there is a general tendency for points on the left to come from earlier in the season than points on the right. Consequently, residuals from our baseline still retain potential for confounding ontogenetic and environmental influences on growth rate.
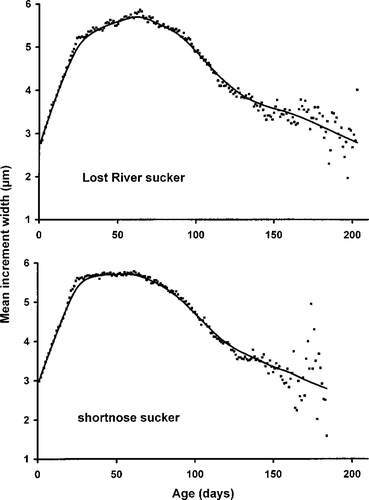
Mean increment width versus age for Lost River and shortnose suckers collected in Upper Klamath Lake, computed by averaging increment widths over all years (1991 and 1993–2001). Trend lines are nonparametric smoothed curves used as baseline growth curves in the linear mixed-effects models.
The linear mixed-effects model
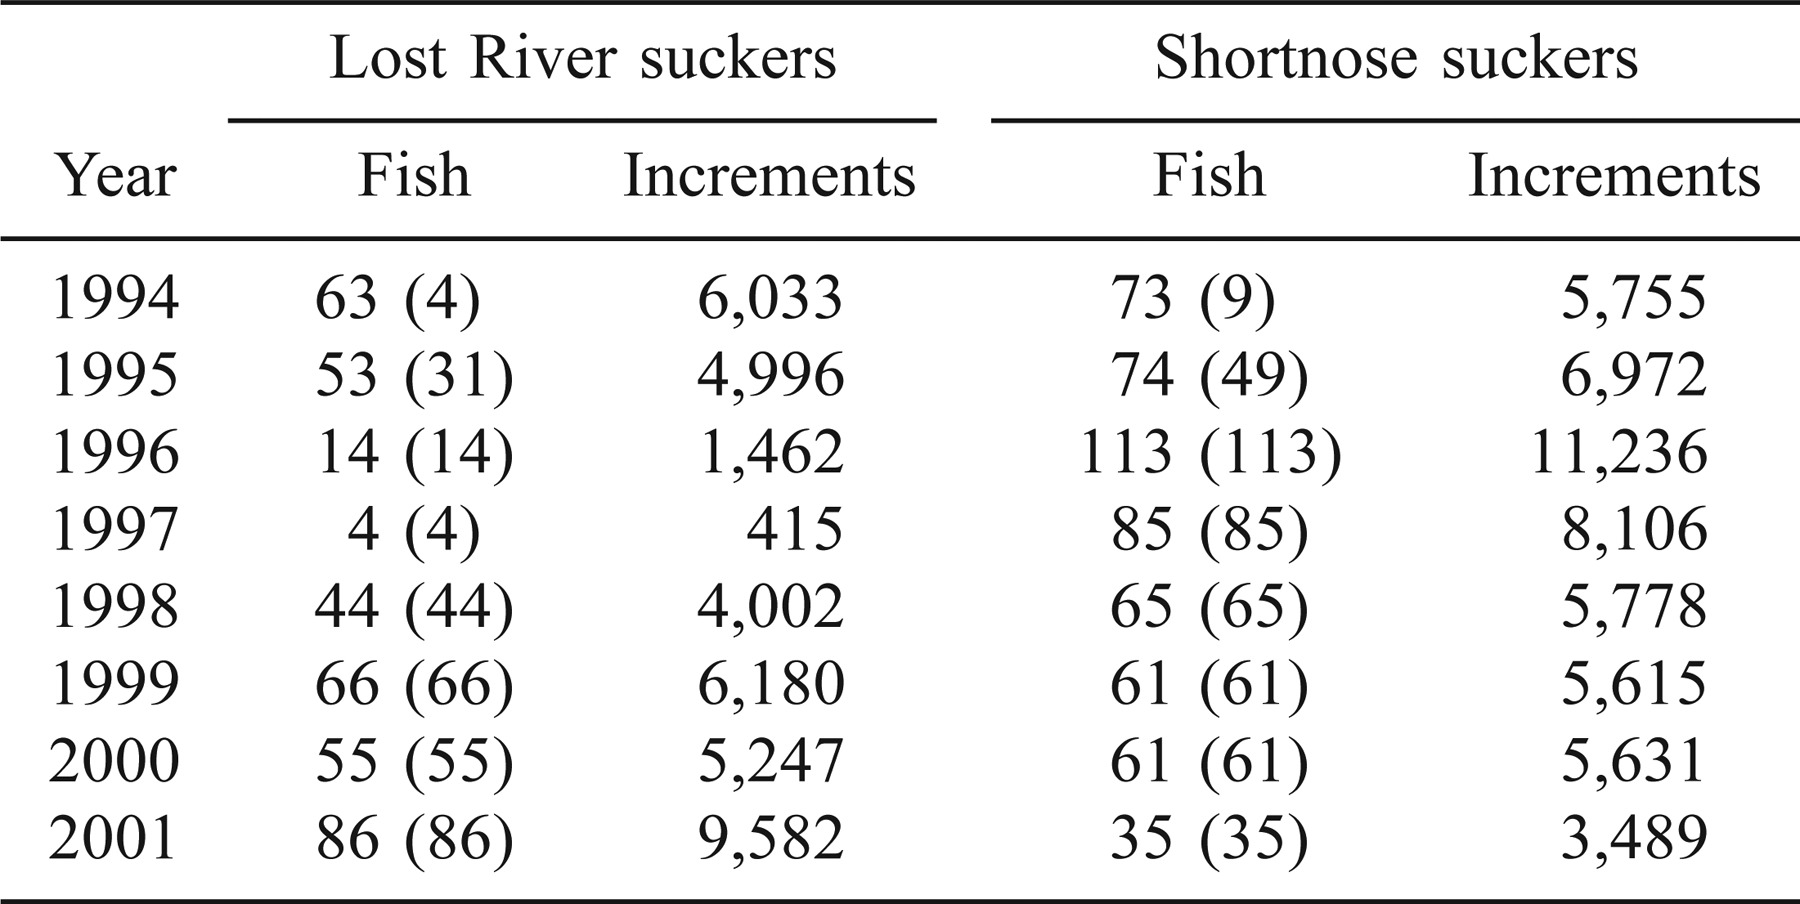
Our analyses were based on time series of daily growth increments measured in lapillar otoliths from 952 fish (16–124 mm SL) collected from 1994 through 2001 (Table 1).
Our general model for the increment width of fish i at age tj (d) is

where f(tj) is the nonlinear function of time that we have chosen as our baseline growth curve; ni is a random effect due to fish i; xj is a row vector of the environmental variables recorded on the date that this fish was age tj; β is a vector of regression parameters; and ϵi1, ϵi2, …, ϵini are sequential errors for fish i, assumed to represent a first-order autoregressive process abbreviated AR(1). That is, increment width is the sum of a baseline value, a random effect due to the individual fish, effects of the lakewide average environmental variables, and random error. The AR(1) structure implies that the correlation of the errors from an individual fish on days i and j is ρ|i − j|, where ρ is the autoregression coefficient (−1 < ρ < 1).
Our strategy was to subtract the baseline increment width from the observed increment width and then model the increment width residual (IWR) as

This is a linear mixed-effects model (LME; Laird and Ware 1982; Diggle et al. 1994) with serial autocorrelation of the random errors within fish. We fit the model using the S-PLUS function lme, choosing restricted maximum likelihood as the parameter-estimation method (e.g., see Venables and Ripley 1997).
Our decision to use lakewide average water quality variables in our LME models was based upon the logic and methods of Fortin et al. (1996) and LeBreton and Beamish (2000). In all modeling, including that discussed in the next section, we started with models containing dissolved oxygen, pH, water temperature, and all pairwise interactions of those three predictors; we then sequentially removed terms that were not significant (α = 0.01 for interactions and α = 0.05 for main effects).
Modeling increment widths near the time of capture
A major uncertainty of the time-series approach discussed above is the extent to which the lakewide average values of the environmental variables approximate the conditions experienced by individual fish captured at specific locations in the lake. Consequently, we developed another approach in which widths of recently deposited increments were related to environmental conditions at the times and places that individual fish were collected.
We identified 782 fish (304 Lost River and 478 shortnose suckers; Table 1) collected from 1994 through 2001 for which all environmental information at the time and place of collection was available. For each fish, we calculated the average increment width for the 3 d preceding capture and looked for associations of this average increment width with locally measured pH, DO, and water temperature. We used the following linear regression model:

where yi is the average of the last three increment widths for fish i, agei is the age at capture of fish i; β0 is an intercept, β1 is the regression coefficient for age at capture, xi is a row vector of the environmental variables recorded at the time of capture, β = (β2, …, βk)′ is a vector of the corresponding regression coefficients, and ϵi is random error. Age was included only when it had a statistically significant association with average increment width. Unlike the time-series approach, this approach (1) models the effect of age simultaneously with the effects of environmental variables (the relationship is assumed to be linear—an assumption that seems reasonable for the mostly older fish included in this analysis; Figure 2); (2) avoids the need to model serial correlation of measurements within fish because each fish's growth is summarized by a single number, thereby allowing the use of simpler statistical tools; and (3) because fish sampling occurred during daylight hours, uses daytime DO rather than nighttime DO.
Results
Sucker Distribution
Lost River and shortnose suckers were captured lakewide throughout the study period (Figure 3). Cast-net and beach seine data indicated that suckers were most abundant along the southern and southeastern shorelines of the lake but were captured in other areas, albeit less frequently. Trawl data indicated that juvenile suckers were captured lakewide, and no obvious trends were evident in the distribution.
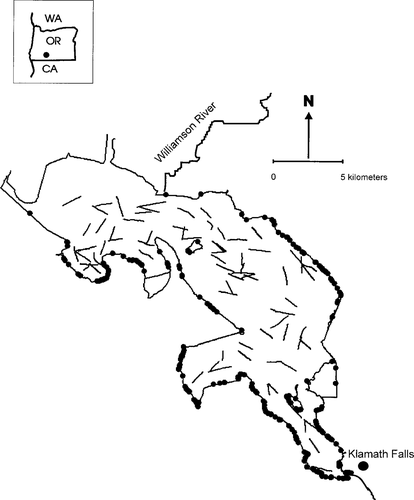
Map of Upper Klamath Lake, Oregon, showing locations where Lost River and shortnose suckers were captured during annual surveys with otter trawls (lines), beach seines, and cast nets (circles), 1994–2001.
Lakewide Water Quality
Lakewide averages of nighttime (0400–0800 hours) DO, daytime (1100–1500 hours) pH, and daytime water temperature were highly variable from 1994 through 2001 (representative years are shown in Figure 4). Lakewide nighttime DO and daytime pH displayed wide interannual and intraannual variability from late spring through early fall, with the lowest DO concentrations typically occurring in August (Figure 4). Mean daytime water temperatures increased steadily through spring and early summer, peaked in late July and early August, then gradually decreased over the remainder of the year for all years studied. Sites where suckers were captured also exhibited a wide range of water quality characteristics over the 8 years studied (water temperature = 10.19–28.31°C, pH = 6.72–9.83, daytime DO = 1.01–15.04 mg/L).

Lakewide average daytime water temperature, daytime pH, and nighttime DO concentration for three representative years (1994, 1998, and 2001). Gaps in trend lines represent days when water quality probes failed in the field.
Somatic Growth–Otolith Growth Relationships
Relationships between otolith length and fish length were estimated using linear regression (Table 2). Regressions of otolith radius on standard length (SL) were significant for all species–year combinations (P < 0.001). Except for both Lost River and shortnose suckers in 1998 and 2000, coefficients of determination were high for all regressions. Assumptions for constant and independent variance of residuals were met for all regressions (P > 0.05), with one exception: residuals from Lost River suckers in 1998 showed a significant negative correlation with cohort (P = 0.031), indicating that otolith growth and somatic growth became uncoupled for Lost River suckers that year. Younger, faster-growing fish had smaller otoliths than older, slower-growing fish of the same length. Because (1) Lost River suckers collected in 1998 were represented by only two cohorts (cohorts 3 and 4), with a relatively small proportion from cohort 4 (8 of 44), (2) the F-statistic for the regression (4.99) approached the critical value of F (i.e., 4.08), and (3) Lost River suckers captured in 1998 represented the only species–year combination that exhibited otolith growth–somatic growth uncoupling, we ran the LME model both with and without Lost River suckers from 1998 to see if differences existed between the two models.

Growth Models
The linear mixed-effects analyses
Results of the linear mixed-effects model on increment data from 385 Lost River suckers and 567 shortnose suckers from 1994 through 2001 indicated that two of three main effects (mean nighttime DO and mean daytime water temperature) and the interaction between DO and water temperature were significantly associated with IWR (Table 3). The effects of DO and water temperature were influenced by the interaction between the two variables. When the LME model for Lost River suckers excluded the 1998 fish that exhibited otolith growth–somatic growth uncoupling, the coefficients were of the same sign and magnitude, and there were no appreciable differences between the two Lost River sucker LME models (Tables 3, 4). We used all hydrolab data from 1994 to 2001 in our LME models. However, not all hydrolabs were in use every year during the study period (see Figure 1). When we eliminated dates from both Lost River and shortnose sucker LME models on which fewer than three hydrolabs were used to determine lakewide averages, there were again no appreciable differences between full and reduced LME models (Tables 3, 5).

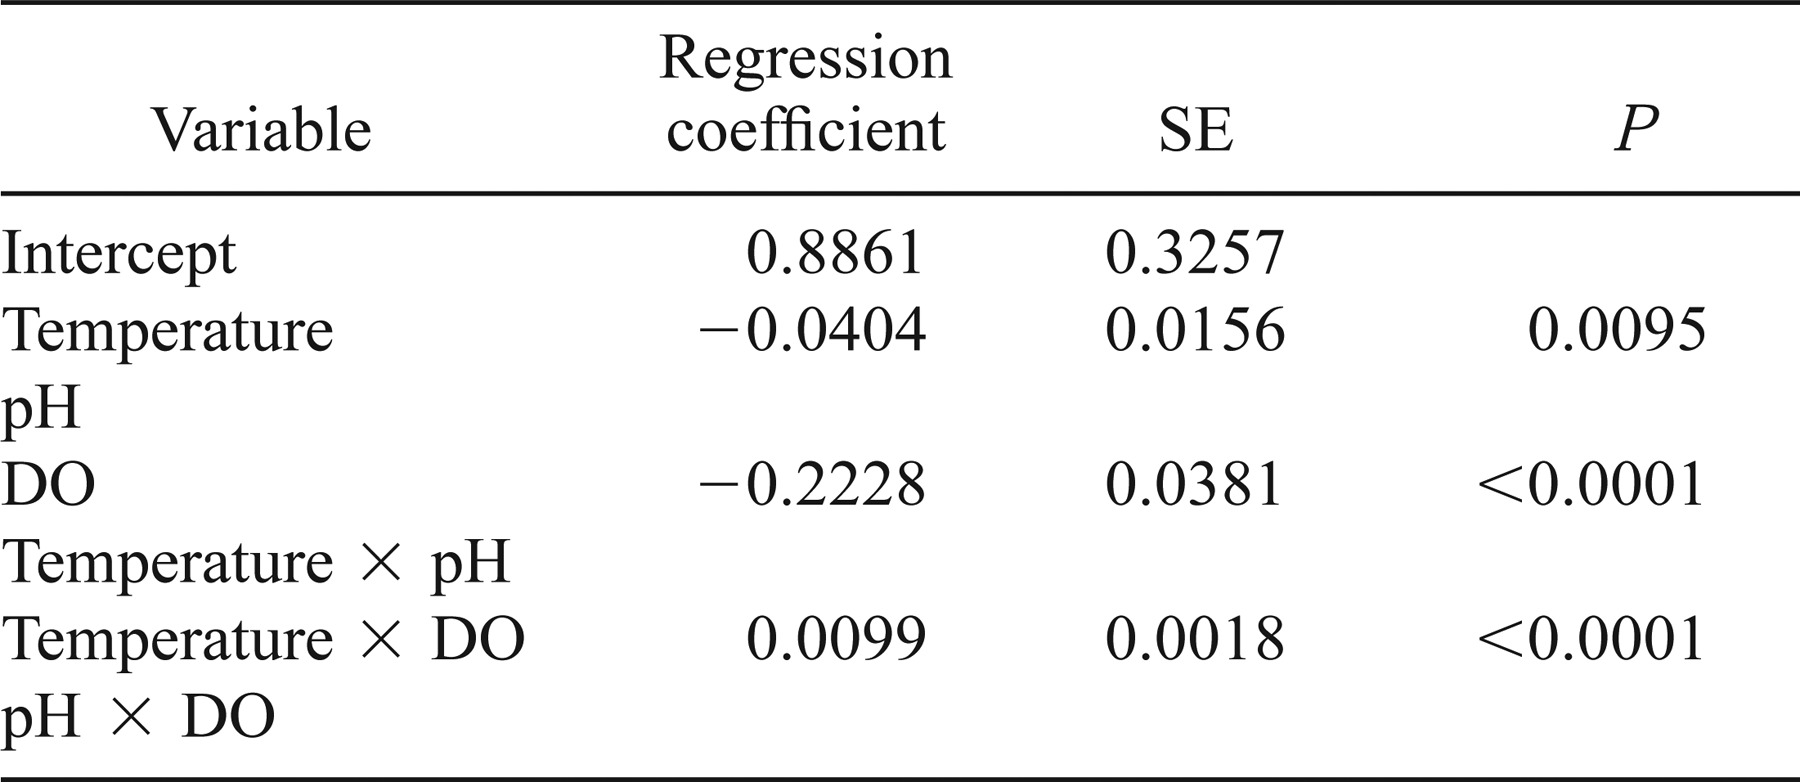

Because of the importance of the interaction term in the models, the model predictions are more easily appreciated by holding one variable constant. We selected two DO concentrations and two water temperatures experienced by suckers to illustrate the model predictions (Table 6). According to Table 6, the effect of water temperature on the model-predicted IWR (IWR′) for Lost River suckers was negative at nighttime DO of 2 mg/L and positive at nighttime DO of 10 mg/L; for shortnose suckers, IWR′ was positive for both DO values. The effect of nighttime DO on IWR′ was negative at low water temperature (13°C) and positive at high water temperature (23°C) for both species.

The dynamics of the models, using typical water temperature and DO combinations (daytime water temperature, 10–25°C; nighttime DO, 0.1–12.0 mg/L), indicate that in the full model (Table 3) temperature did not have a positive effect on growth until nighttime DO concentrations exceeded 4.0 mg/L for Lost River suckers (Figure 5) or 1.0 mg/L for shortnose suckers (Figure 6). Similarly, high nighttime DO did not have a positive effect until water temperatures exceeded 22.4°C for Lost River suckers (Figure 5) or 21.9°C for shortnose suckers (Figure 6). The IWR′ was at a maximum when both water temperature and nighttime DO concentration were relatively high.
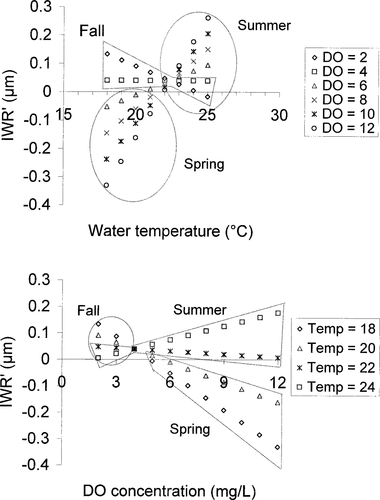
Linear mixed-effects model predictions of increment width residuals (IWR′) generated from Lost River sucker increment width data, 1994–2001, using temperature (Temp; °C) and dissolved oxygen (DO; mg/L) data from Upper Klamath Lake from spring through early fall.
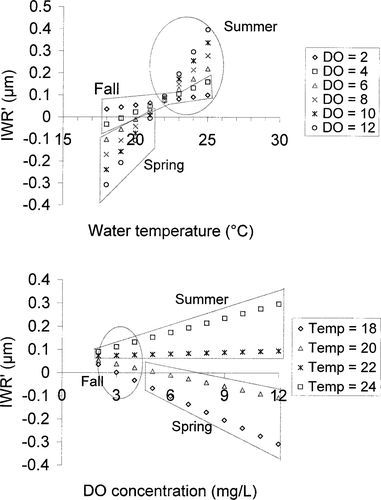
Linear mixed-effects model predictions of increment width residuals (IWR′) generated from shortnose sucker increment width data, 1994–2001, using temperature (Temp; °C) and dissolved oxygen (DO; mg/L) data from Upper Klamath Lake from spring through early fall.
Mean residuals from the full LME models decreased early in the year (April 10–May 18) and then stayed relatively flat, becoming positive and highly variable in late summer as sample sizes decreased (Figure 7).

Mean linear mixed-effects model increment width residuals (IWR′) for Lost River and shortnose suckers plotted over time. The IWR′ values are means from suckers caught in Upper Klamath Lake from 1994 to 2001.
Biweekly sampling of un-ionized ammonia in 1997 precluded its use in our LME models; therefore, we used IWR rather than IWR′ to explore relationships between un-ionized ammonia and increment width (Figure 8, upper panel). The four Lost River suckers caught in 1997 were excluded from the analysis; only increment widths from shortnose suckers were analyzed. High concentrations of lakewide daytime un-ionized ammonia occurred on July 3, July 17, and July 31 (1.1020, 0.8454, and 1.4631 mg/L, respectively). Peaks in un-ionized ammonia did not appear to correspond to changes in IWR (Figure 8, upper panel). When restricted to samples from Wocus Bay, the area with the highest un-ionized ammonia concentrations (4.1364 mg/L on July 31), increment widths from seven shortnose suckers captured there again showed no relationship between IWR and peaks in un-ionized ammonia (Figure 8, lower panel).

The upper panel shows mean observed increment width residuals (IWR) for all (N = 85) shortnose suckers captured in Upper Klamath Lake in 1997 and the corresponding lakewide average daytime un-ionized ammonia concentrations (NH3-N). The lower panel shows mean IWR values for shortnose suckers captured in Wocus Bay in 1997 (N = 7) and the corresponding daytime un-ionized ammonia concentrations recorded from Wocus Bay. The dashed horizontal lines in both panels represent a published shortnose sucker 96-h median tolerance limit (LC50) for un-ionized ammonia (Saiki et al. 1999).
The time-of-capture analyses
The time-of-capture (TOC) model was calculated for 304 Lost River suckers and 478 shortnose suckers (Table 7). Results from both models indicated that more predictors were significant compared with LME models; in fact, all main effects and interaction terms were significant in the shortnose sucker TOC model. The effects of water quality on mean increment widths used in these models are best illustrated graphically, using combinations of pH and water temperature experienced by suckers on their date of capture and a mean daytime DO level of 7.0 mg/L (Figure 9). Lost River sucker mean increment width was positively associated with water temperature at all levels of pH, and pH was negatively associated with growth (i.e., growth was better at lower pH values). Shortnose sucker mean increment width was positively associated with water temperature only at pH levels greater than 7, and pH was negatively associated with growth at temperatures less than or equal to 23°C.

Time-of-capture model predictions generated from Lost River sucker (upper panel) and shortnose sucker (lower panel) mean increment widths, 1994–2001, using actual values of water temperature and pH experienced by the fish, at an average daytime dissolved oxygen concentration of 7.0 mg/L
Discussion
Our LME models were robust with respect to reduced data sets, the results being very similar to those from models with all possible fish (Table 6). The results were also consistent with the observation that otolith growth is positively influenced by temperature (Gutiérrez and Morales-Nin 1986; Karakiri and von Westernhagen 1989; Bradford and Geen 1992). The highest mean water temperature used in the LME models was 25.11°C, well below the critical mean thermal maximum of 32.7°C for shortnose suckers (Castleberry and Cech 1993) and below Saiki et al.'s (1999) values for the mean 96-h concentration that is lethal to 50% of the specimens (LC50) of 30.51°C for juvenile Lost River (∼33–39 mm SL) and 30.35°C for juvenile shortnose suckers (∼32–33 mm SL; standard lengths estimated by weights provided by Saiki et al. 1999). Alone, average water temperature in Upper Klamath Lake should not have had a negative impact on juvenile sucker growth.
Lost River sucker and shortnose sucker LME models showed that growth was significantly associated with a water temperature–DO interaction. Water temperature was positively associated with growth when DO exceeded 4.0 mg/L for Lost River suckers or 1.0 mg/L for shortnose suckers. DO was positively associated with growth at temperatures above 22.4°C for Lost River suckers or 21.9°C for shortnose suckers. Thus, at temperatures greater than approximately 22°C, growth required higher nighttime DO; at temperatures less than approximately 22°C, growth was better when nighttime DO was low. The combination of low DO and high temperature has also been implicated in adult fish kills in Upper Klamath Lake (Perkins et al. 2000).
We interpret these results to mean that at temperatures greater than approximately 22°C, low nighttime DO caused enough stress to reduce growth, whereas at temperatures less than approximately 22°C, any stress from low nighttime DO was not reflected in growth because increased food resources associated with low DO compensated. Although low DO can cause reduced growth and increased mortality in other fishes (Haywood et al. 1980; Baltz et al. 1998), Meyer and Hansen (2002) showed that juvenile Lost River suckers had to die before an adverse functional effect of low DO, high pH, or high un-ionized ammonia levels could be measured. Similarly, the 96-h LC50 for DO is 1.62 mg/L for juvenile Lost River suckers (∼31–39 mm SL) and 1.34 mg/L for juvenile shortnose suckers (∼28–40 mm SL; Saiki et al. 1999). To the extent that low nighttime DO is caused by Aphanizomenon biomass, it is also positively associated with Daphnia prey biomass during summer (Ehinger 1992; Kann 1998), and Daphnia is an important food item for juvenile suckers (Buettner and Scoppettone 1990).
Temporally transient (<96-h) low nighttime DO (<2.0 mg/L) apparently had no effect on growth at lower temperatures, but as oxygen demand increases with increasing water temperature (Phillips 1969), those low DO concentrations did effect growth above 22°C. Mean daily water temperature in August exceeded 22°C about 34% of the time between 1994 and 2001, so nighttime DO stress in summer could have measurable cumulative effects on growth during particularly warm years. Although poor water quality has negative physiological effects on Lost River and shortnose suckers (Castleberry and Cech 1993; Kann and Smith 1999; Martin and Saiki 1999; Saiki et al. 1999), our data suggested that the impact on growth was confounded by temperature. However, as long as temperatures were below approximately 22°C, the low DO associated with high productivity did not measurably affect growth.
Our LME models also had an important seasonal component to their interpretation. Early season (June) Aphanizomenon blooms occurred at lower temperatures (16–20°C), produced a higher pH (>9) and higher nighttime DO (7–10 mg/L), and were associated with active growth of algae and higher lake levels. Late-season (August) blooms occurred at higher temperatures (18–24°C), produced a lower pH (8–9) and lower nighttime DO (4–6 mg/L), and were associated with algal decomposition and lower lake levels (USFWS 2001). Temperatures above 22°C would generally be experienced by older (>100 d), larger juveniles whose greater oxygen demand may make them less tolerant of low nighttime DO than smaller juveniles.
Shortnose suckers appeared to be more tolerant of poor water quality than Lost River suckers. In the TOC model at a DO of 7 mg/L and pH of 10, their growth increased with temperature at a higher rate than Lost River suckers (Figure 9). Similarly, growth of shortnose suckers increased with temperature at all DO concentrations in the LME model (Figure 6) whereas Lost River sucker growth decreased or was flat at DO concentrations less than 4 mg/L (Figure 5).
The association between pH and growth was insignificant in LME models, a somewhat surprising result given laboratory studies (Daye and Garside 1976; Geen et al. 1985; Randall and Wright 1989). Falter and Cech (1991) reported mean maximum pH tolerance was 9.55 for shortnose suckers, and Saiki et al. (1999) reported mean 96-h LC50 values of 10.30 for juvenile Lost River suckers (∼28–33 mm SL) and 10.39 for juvenile shortnose suckers (∼39–40 mm SL). The highest mean pH used in the LME models was 10.09 (June 25, 1994), greater than Falter and Cech's (1991) estimate and approaching Saiki et al.'s LC50 values. This lack of an association between pH and growth may be due to the fact that site-specific pH exceeded Falter and Cech's (1991) tolerance limit on only 7.4% of the sampling dates, and the average pH values used in our LME models exceeded this critical value only 5.7% of the time. Martin and Saiki (1999), in a study examining the effects of water quality on caged Lost River suckers, failed to record a mortality when pH averaged 10.30, and hypothesized that either high pH was not sustained long enough to have an adverse affect or that other environmental conditions ameliorated lethal effects of high pH.
Mean un-ionized ammonia concentrations in Upper Klamath Lake exceeded the mean 96-h LC50 values of 0.78 mg/L for juvenile Lost River suckers (∼33–39 mm SL) and 0.53 mg/L for juvenile shortnose suckers (∼31–48 mm SL; Saiki et al. 1999) on at least three occasions during late June and late July 1997. The lakewide average un-ionized ammonia concentration on July 31 was nearly three times the 96-h LC50 value for shortnose suckers, whereas the concentration in Wocus Bay was eight times the LC50 value. We could not detect sublethal growth effects, and during a well-documented (Perkins et al. 2000) fish kill affecting adults and large juveniles in 1997, we failed to find dead or dying juvenile suckers in samples with beach seines, cast nets, and otter trawls. Un-ionized ammonia is toxic to fish at relatively low concentrations (Ball 1967), and at sublethal levels, may reduce oxygen uptake, increase ion loss due to increased urine flow, inhibit sodium uptake, decrease food assimilation, and increase susceptibility to parasite epizootics (Colt and Tchobanoglous 1978; Soderberg et al. 1983; Rasmussen and Korsgaard 1996). Unfortunately, the fortnightly sampling pattern of un-ionized ammonia precluded its use in our LME models. These results agree well with those of Meyer and Hansen (2002), who found that Lost River suckers died before showing other effects of high un-ionized ammonia concentrations.
Despite the presence of relatively poor water quality throughout the course of the study, we saw continuous growth in sucker body length and no indication of sublethal effects on growth until water temperatures exceeded 22°C and nighttime DO fell below 4 mg/L for Lost River suckers or 1 mg/L for shortnose suckers (Figures 5, 6). There was little evidence of somatic growth–otolith growth uncoupling. Our models tended to overestimate early-season growth when water quality was generally good and underestimate late-season growth when water quality was generally poor. For this study, our complex LME models used water quality data with good temporal but poor spatial resolution; our TOC models used data with good spatial resolution but they were only available for a single date. We prefer the LME modeling approach because results were robust, similar between species, and biologically meaningful. Poor water quality can be highly localized in a large lake and undetected by a lakewide average, and fish can simply avoid those areas with no consequence in growth. However, as the number and size of areas with poor water quality increase, lakewide averages will be more likely to detect the events, and fish will be more likely to display the consequences in their growth. Further, differences in IWR must be related to variations in large-scale, extrinsic factors if they are to be used in the construction of ecophysiologically relevant growth chronologies (LeBreton and Beamish 2000). The use of lakewide average water quality variables in our LME models ensured that the occurrence of significant poor water quality would be reflected in those models, and would not be as localized as was the case in our TOC models.
Acknowledgments
This work is part of long-term studies of Upper Klamath Lake suckers supported by U.S. Bureau of Reclamation. We are grateful to Mark Beuttner for continued interest, discussion, and support. Paul Murtaugh (Department of Statistics, Oregon State University) developed modeling approaches and provided statistical assistance. Mike Berg (U.S. Bureau of Reclamation) provided daily water quality data. Dave Simon, Jerry Hoff and Dan Logan provided field and laboratory assistance. Dave Simon, Mark Beuttner, Ron Larson, Mike Cooperman, and Larry Dunsmoor provided comments on earlier drafts of the manuscript. Specimens were collected under federal permit MARKDF (and amendments through 2001) and Oregon State permit number 91332 and renewals; collection procedures were approved by the Oregon State University Institutional Animal Care and Use Committee. This is contribution number 11959 of the Oregon Agricultural Experiment Station.


