Empirical Assessment of Indices of Prey Importance in the Diets of Predacious Fish
Abstract
Determining the importance of prey taxa in the diets of predacious species is a frequent objective in fisheries research. Various indices of prey importance are in common use, and all give different results because of their emphasis on different aspects of fish diets. We explored these differences by empirically comparing four well-known indices—percent weight (%W), percent occurrence (%O), percent number (%N), and percent index of relative importance (%IRI)—as well as a modified %IRI (%MIRI), as applied to an extensive data set on the diets of six fish species in Spirit Lake, Iowa. Correlations among all indices were positive but were weaker among component indices (%W, %O, and %N) than between the two compound indices (%IRI and %MIRI); correlations among component indices were also weaker than correlations of compound with component indices. Correlation strength of %MIRI with the three component indices varied greatly (%N < %O < %W), whereas the correlation strength of %IRI with component indices was similar. Importance values based on %W, %MIRI, and %N depend more on prey size than those based on %IRI and %O. The %W and %MIRI emphasized the importance of large prey taxa, whereas %N emphasized small prey in diets; %IRI and %O were similarly unbiased with respect to prey size. The %O yielded substantially higher importance values than all other indices. Thus, for use as a general index of dietary importance, we believe %IRI provides the optimal balancing of frequency of occurrence, numerical abundance, and abundance by weight of taxa in fish diets.
Introduction
Importance of prey taxa is a frequently used quantitative description of fish diet and the relationship of diet to other characteristics of fish populations and communities (Bowen 1996). Biologists are interested in the importance of prey taxa to predator growth, consumption, competition, predation, and relationships between prey importance and availability. Accurately quantifying importance of prey taxa and understanding the contributions of various prey to predator well-being is essential for effective management of fisheries resources (Bowen 1996).
Several indices have been used to express the relative importance of prey taxa, including percentage by number (%N), weight (%W), volume (%V), and occurrence (%O); index of relative importance (IRI); and modified index of relative importance (MIRI). Among them, %W (or %V) has been the most popular index to describe prey importance and its relationships with fish well-being and prey availability (e.g., Hubert and Sandheinrich 1983; Wahl and Stein 1993; Hartman and Brandt 1995; Rand and Stewart 1998; Persson and Hansson 1999), followed by IRI (e.g., Sammons et al. 1994; Cortes et al. 1996; Swenson and McCray 1996). Occasionally, %O, %N, and MIRI are used as indices of prey importance (e.g., Pitcher 1980, 1981; Chapman et al. 1989; Bridcut and Giller 1995; Gaughan and Potter 1997).
No index is without bias, and biases attributed to dietary indices have stimulated different opinions on their use for several decades (Hynes 1950; Berg 1979; Wallace 1981; Cortes 1997; Hansson 1998). There are two major opinions in this literature. One is to use a component index such as %W, %N, or %O, chosen largely on the basis of specific purposes of a study or on researcher preferences. A second perspective supports use of compound indices such as IRI and MIRI, which is based on the idea that a combination of different component measures presents a more balanced view of dietary importance (Pinkas et al. 1971; Pitcher 1980 and 1981; Bigg and Perez 1985; Cortes 1998). Considerable disagreement exists between these perspectives (MacDonald and Green 1983; Bowen 1996; Cortes 1997; 1998; Hansson 1998).
Using an extensive database of diets of six fish species collected during 3 years in Spirit Lake, Iowa, we explored similarities and differences among the above-mentioned importance indices. Our objectives were to (1) compare importance of prey taxa rated by different indices, (2) examine biases in importance ratings among indices related to differences in prey size, (3) assess advantages and disadvantages of dietary indices, and (4) recommend a preferred index for most situations.
Methods
Black crappie Pomoxis nigromaculatus, largemouth bass Micropterus salmoides, northern pike Esox lucius, smallmouth bass M. dolomieu, walleye Stizostedion vitreum, and yellow perch Perca flavescens were collected in Spirit Lake, Iowa, from early May to late October, 1995–1997. These six species are the predominant predator game fish in the lake. Seventy-four percent of our fish were collected using an AC, boat-mounted electrofisher and the rest were collected with a variety of gears, including beach seine, fyke nets, gill nets, and angling. Total length (nearest 2.5 mm) and weight (nearest 14 g) of each fish were measured. Only fish 150 mm or larger were retained for study. Stomach contents flushed out using a water pump (Baker and Fraser 1976) were immediately put on ice in a cooler and frozen within a few hours to preserve for identification in the laboratory. All fish were released alive immediately after stomach flushing. Zooplankton was excluded from the analysis because water from the lake was used for stomach flushing, which could have introduced zooplankton in stomach samples.
Prey fish were identified to species, and invertebrates were identified to the lowest possible taxon (phylum, class, or order) in the laboratory. Other vertebrate prey were identified to class. Wet weights of prey fish and crayfish were estimated using length–weight equations developed in this study. Dry weights of other invertebrates were estimated using length–weight equations found in the literature (Smock 1980; Meyer 1989). Invertebrate wet weight was assumed to be 5 times dry weight (Morin and Dumont 1994).
Each of the three sampling years was divided into three seasons: spring (May and June), summer (July and August), and fall (September and October). Each predator species was divided into small (<230 mm in total length for black crappie and yellow perch, <305 mm for largemouth bass, smallmouth bass, and walleye, and <560 mm for northern pike) and large (fish of greater lengths) size-groups. A unit of comparison (hereafter referred to as a unit) consisted of all predators of a given species and size-group collected during a particular season and year
We calculated %W, %O, %N, percent IRI (%IRI), and percent MIRI (%MIRI) for each prey taxon in each unit as follows:
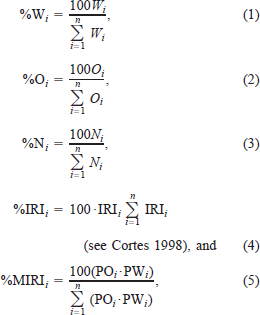
where n is the total number of prey taxa found in a unit, Wi and Ni are the total wet weight and number of prey i in a unit, respectively, Oi is the number of predator stomachs containing prey i in a unit, and IRI = %Oi(%Wi.+ %Ni). In this study, we focused our attention on differences among the indices and how these differences affect interpretations of prey importance.
We calculated relative size of a prey taxon (hereafter referred to as prey size ratio) as the logarithm of the ratio of %W to %N for each unit. For comparisons, prey taxa with prey size ratios of zero or more were designated as large; those less than zero were considered to be small. We plotted %W, %N, %O, %MIRI, and %IRI for all units against the prey size ratio of taxa to illustrate the influence of prey size on importance as reflected by these indices. We arbitrarily defined major prey taxa as those with importance values of 20% or more and used chi-square analysis to compare differences among the five indices in designating taxa as major status. These analyses were run separately for small and large prey, as defined by the prey size ratio. Finally, we selected six units from our database as examples to illustrate the consequences of using different indices for interpreting major prey taxon importance.
Results
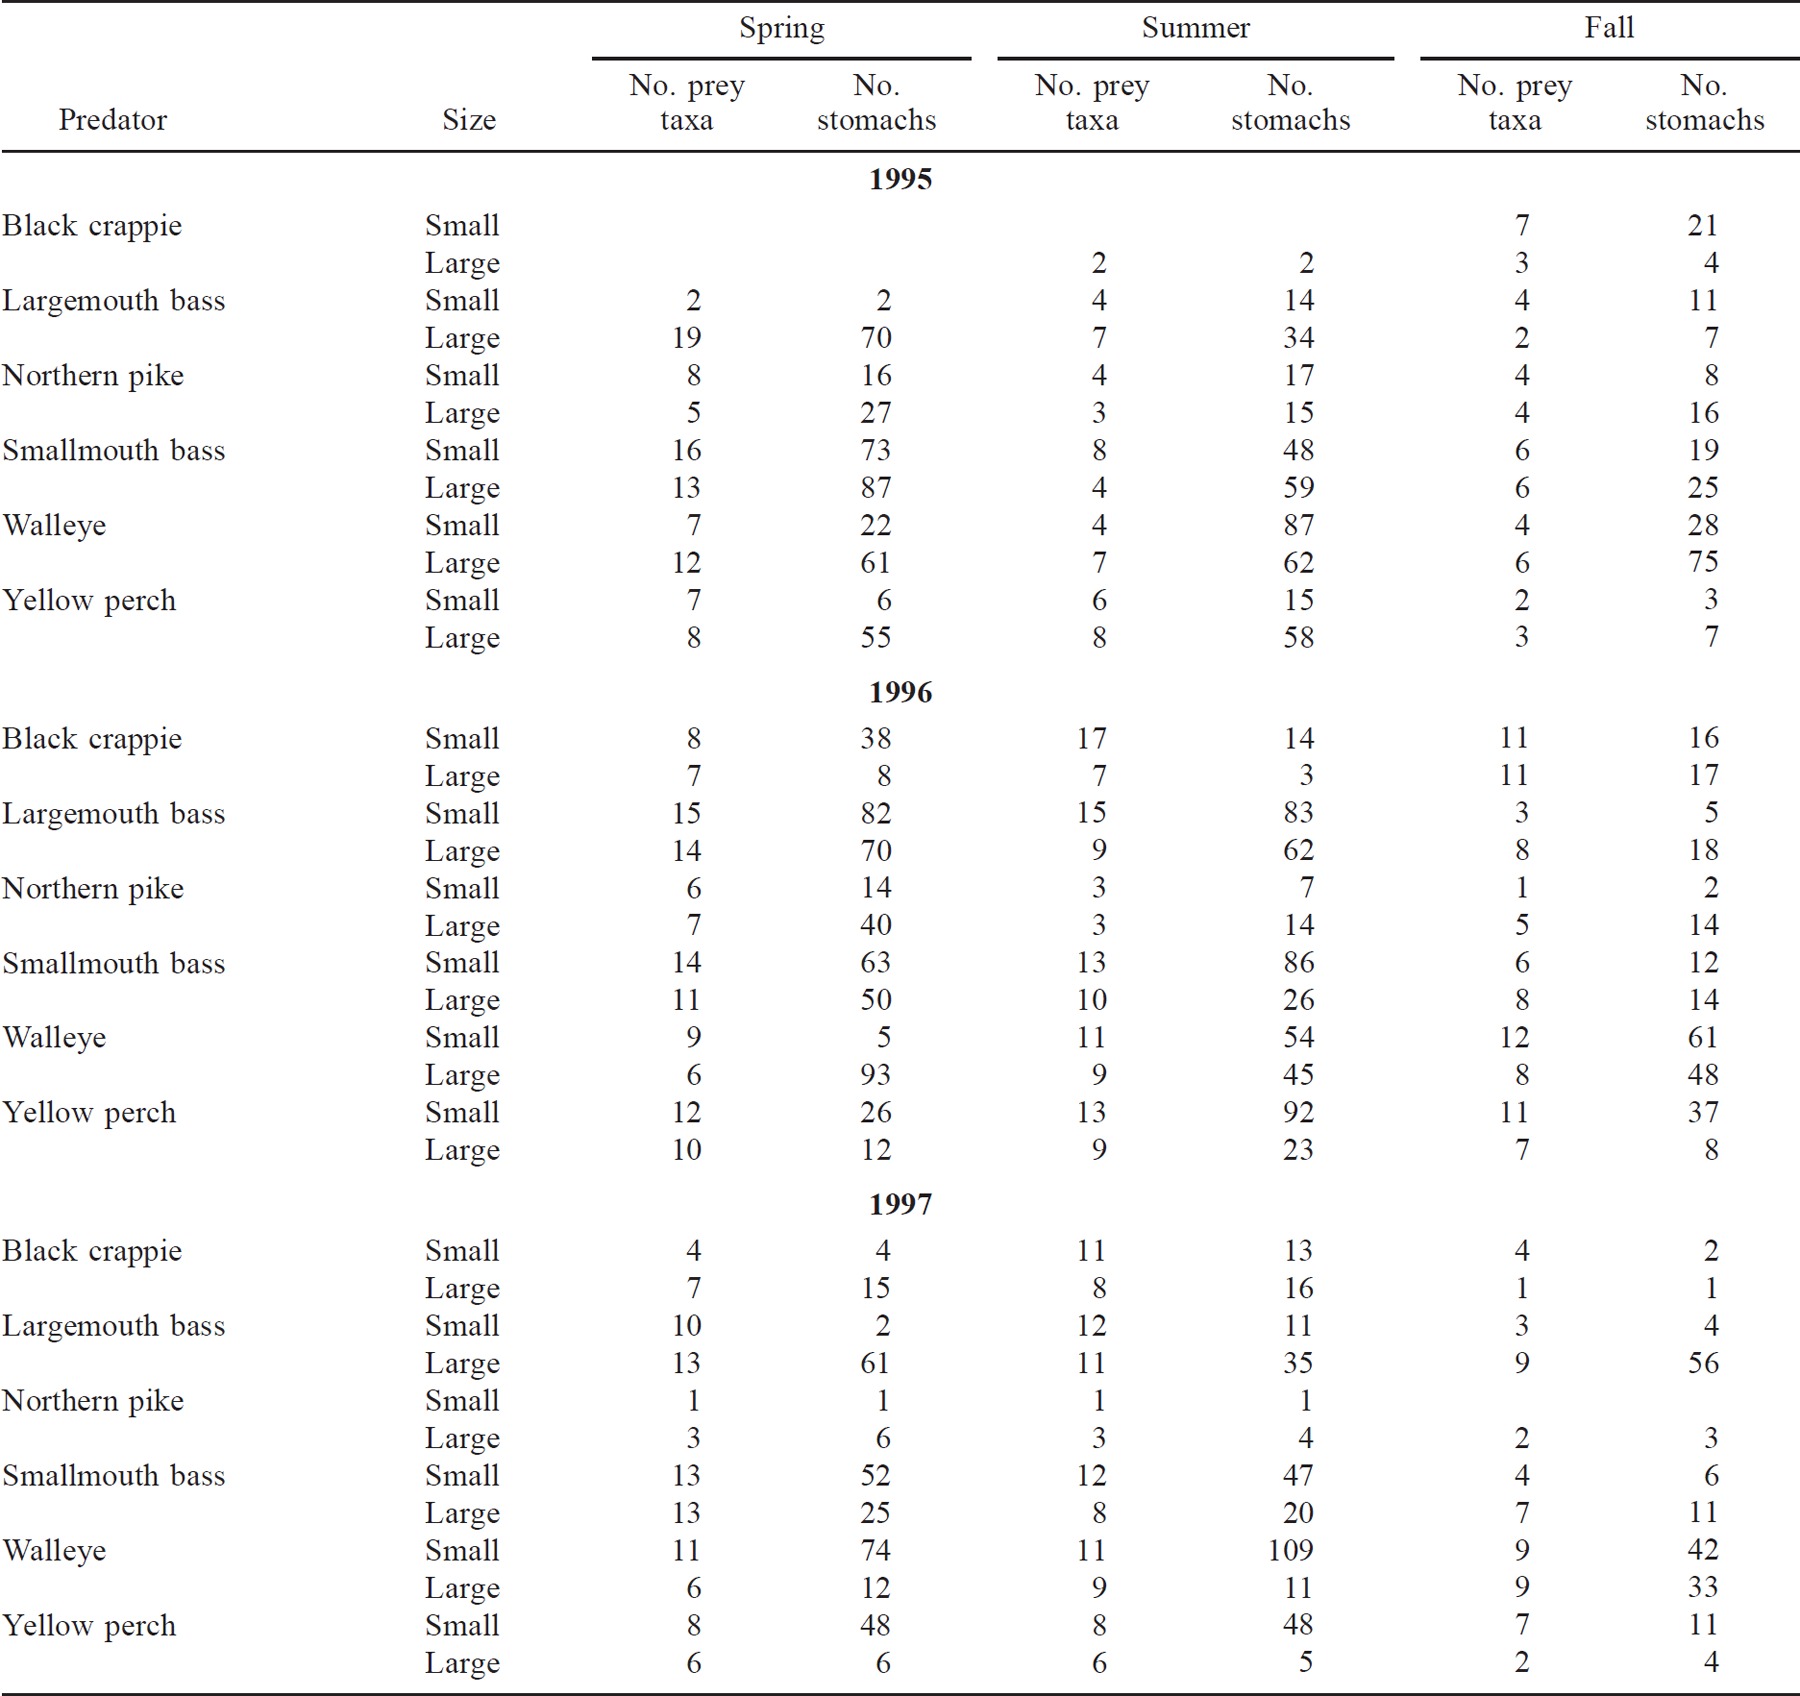
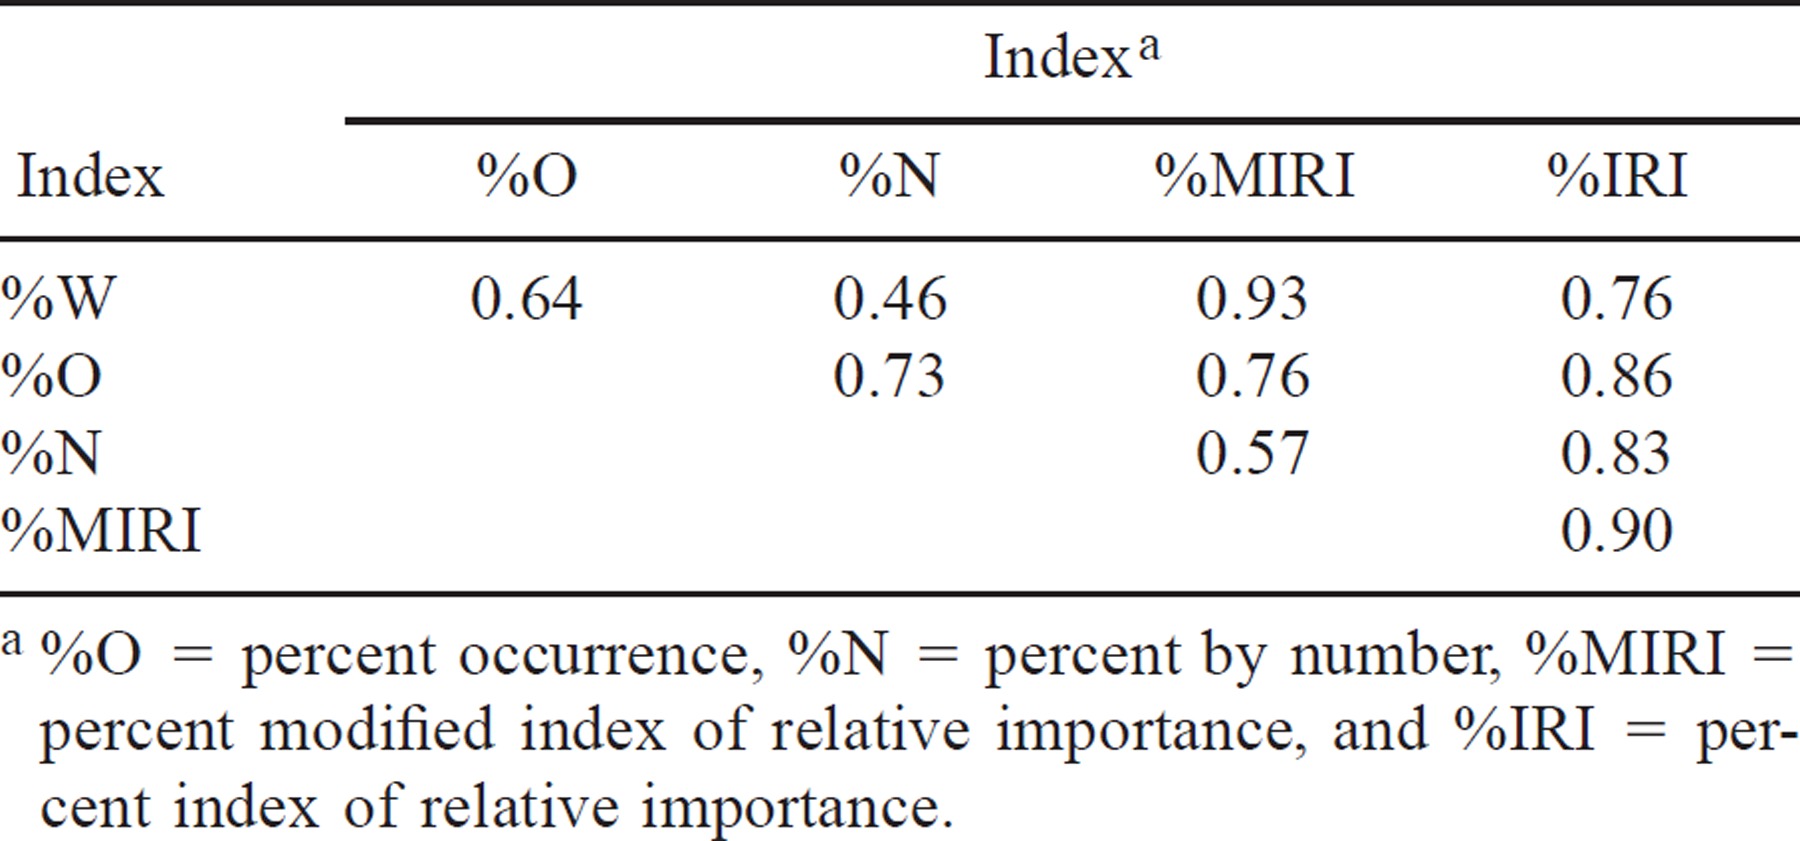
Our sampling yielded 104 comparison units for the six predator species examined. The number of stomachs examined per unit varied from 1 to 109, and the number of prey taxa in the diets varied from 1 to 19 within a unit (Table 1). In total, 3,115 stomachs containing food were examined, and 787 values of each importance index were obtained. Overall averages for %W, %N, %IRI, and %MIRI were 13.2%. Percent occurence averaged higher (19.5%) and consequently yielded more major prey taxa than the other four indices. Individual values for all five indices ranged widely, from less than 1% to 100%. As expected, correlations among all indices were positive, although the strength of association varied considerably (Table 2). In general, correlations among the component indices (%W, %O, and %N) were weaker than (1) correlations between the two compound indices and (2) correlations of either compound index (%IRI and %MIRI) with component indices. Correlation strength of %MIRI with the three component indices varied greatly (%N < %O < %W), whereas the correlation strength of %IRI with component indices was similar (Table 2).
A plot of the five importance indices versus the prey size ratio by taxa illustrated how values can differ greatly among importance indices, depending on prey size (Figure 1). Percent by weight and %MIRI rated more large prey taxa as major taxa, whereas %N rated more small prey taxa as major taxa, and %IRI and %O were unbiased with respect to prey size. Of the 787 prey importance values based on size ratios, 378 were categorized as large prey and 409 as small prey. In the large prey group, 123 (%W), 104(%MIRI), 71 (%IRI), 113 (%O), and 36 (%N) prey importance values were ranked as major, whereas for the small prey group, respectively, 38, 46, 78, 148, and 112 prey importance values were ranked as major. The numbers of prey taxa ranked as major by the five indices were significantly different within each prey group (χ2 = 126.5 and 74.6 for the small and large prey groups, respectively; P < 0.0001).
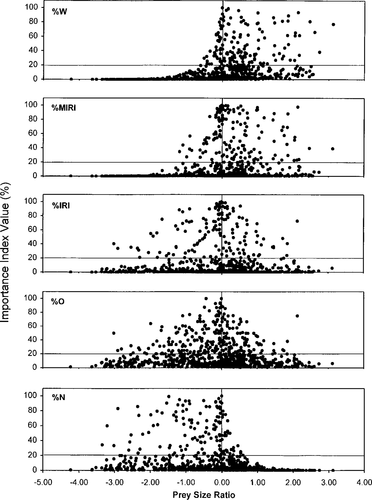
Relationships of importance values for percent by weight (%W), percent modified index of relative importance (%MIRI), percent index of relative importance (%IRI), percent occurrence (%O), and percent by number (%N) to prey size ratio (loge[%W/%N]). Points to the left of the vertical line are small prey taxa; points to the right of or on the vertical line are large taxa; and points above or on the horizontal line indicate major prey taxa; points below are minor taxa
Examples drawn from individual units clearly illustrate the large differences in importance rating that can result from using different indices (Figure 2). As detailed above and in Figure1, these differences are usually explained by prey size. For example, amphipods and bluegill could be ranked as either major or minor prey depending on which index was used to characterize importance in the diets of small black crappies in fall of 1995 (Figure 2a). Being relatively large (prey size ratio = 1.86), bluegills had a very low importance value for %N. However, the large size of bluegills resulted in large values for %W and %MIRI. Importance values for amphipods showed the opposite pattern, reflecting their relatively small size (prey size ratio = −1.00) in the diets. The %IRI and %O indicated roughly equivalent importance of these two taxa, balancing abundant amphipods with the large but relatively few bluegills in the diets of small black crappies. The nonadditivity of %O is evident by the sum of all importance values totaling greater than 100 (Figure 2a).
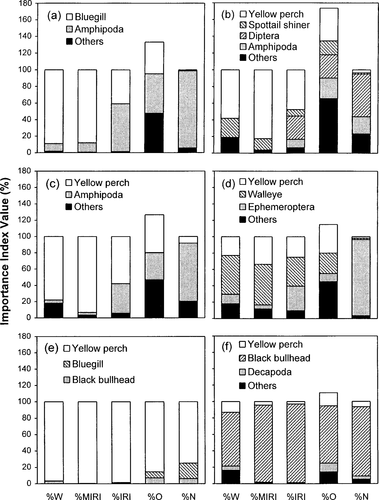
Examples of differences in the importance of prey by taxon, as indicated by five importance indices applied to (a) small black crappies in the fall of 1995 (“others” include Coleoptera, Ephemeroptera, Diptera, Hemiptera, and Hymenoptera); (b) large walleyes in the spring of 1995 (“others” include black crappies, Iowa darters Etheostoma exile, johnny darters Etheostoma nigrum, logperch Percina caprodes, Ephemeroptera, Gastropoda, Hirudinea, Nematoda, Odonata, and Trichoptera); (c) small yellow perch in the summer of 1995 (“others” include logperch, Diptera, Gastropoda, and Hemiptera); (d) large smallmouth bass in the summer of 1997 (“others” include black crappies, freshwater drum Aplodinotus grunniens, largemouth bass, logperch, and Decapoda); (e) large northern pike in the summer of 1996; and (f) large largemouth bass in the fall of 1997 (“others” include black crappies, bluegills Lepomis macrochirus, common carp Cyprinus carpio, Iowa darters, Amphipoda, and Hirudinea)
Similar patterns were seen in the diets of large walleyes in spring of 1995, small yellow perch in summer of 1995, and large smallmouth bass in summer of 1997 (Figure 2). For large walleyes, importance of prey yellow perch (prey size ratio = 1.19) and spottail shiners Notropis hudsonius (prey size ratio = 1.17) was emphasized by %W and %MIRI, whereas dipterans (prey size ratio = −2.04) and amphipods (prey size ratio = −1.36) were rated much higher in importance by %N. In contrast, %IRI and %O indicated intermediate relative importance of the four prey taxa (Figure 2b). For small yellow perch, importance of yellow perch (prey size ratio = 0.98) was emphasized by %W and %MIRI, whereas amphipods (prey size ratio = −1.27) were rated substantially higher in importance by %N; however, %IRI and %O indicated similar importance of the two prey taxa (Figure 2c). For large smallmouth bass, preyed-on yellow perch (prey size ratio = 1.08) and walleyes (prey size ratio = 1.48) were rated more important by %W and %MIRI than were ephemeropterans (prey size ratio = −0.91), %N showing the reverse. Again, %IRI and %O gave relatively balanced importance values for these three prey taxa (Figure 2d). In these four cases, %W and %MIRI emphasized importance of larger taxa, whereas %N emphasized smaller taxa. Percent occurrence and %IRI strike a balance between the number and weight of prey in the diets. However, the nonadditivity of %O can be a problem when comparing importance between sample groups having different numbers of prey taxa in the diets because the sum of %O tends to increase with the number of prey taxa (Cortes 1997).
There were many comparisons, however, for which the five indices produced similar results. This typically occurred where importance values of the component indices were similar, as in the diets of large northern pike in summer of 1995 and large largemouth bass in fall of 1997 (Figure 2). This parity among indices is more likely when there are few prey taxa (Figure 2e) or the predominant prey taxa are similar in size (Figure 2f).
Discussion
By rating and comparing prey taxa in the diets of fish on an importance scale, one makes the tacit assumption that some taxa are more important than others to the growth, survival, recruitment, size structure, condition, reproductive success, or other aspects of the ecology of predator species. Accurately characterizing the true importance of prey taxa is thus crucial to this process (Bowen 1996). Clearly, differences in importance ratings among the various indices demonstrated here and elsewhere (e.g., Cortes 1997; Hansson 1998) raise questions about their meaning. Either one or more of the indices are misleading or erroneous, or the indices emphasize different definitions of dietary importance. Which kind of prey taxon is more important, one consisting of tiny individuals in high numerical abundance, but never accounting for a large proportion of the total prey weight, or one consisting of large individuals in low numerical abundance, but accounting for a very high proportion of the total prey weight when eaten? The answer to this and the more general question of which importance index is the most accurate is complicated and has never been resolved.
Use of %W as an index of prey importance implies that the amount of prey found in stomachs accurately reflects consumption, which in turn relies on the assumption that prey of different shapes, size, and composition are digested at similar rates (Bigg and Perez 1985). On the contrary, digestion rates are well known to be influenced by prey size, shape, energy content, and other factors (Cochran and Adelman 1982; dos Santos and Jobling 1988; Hopkins and Larson 1990; Kaiser et al. 1992; Bassompierre et al. 1998; Andersen 1999). For example, residence time in the stomach is known to increase markedly with prey size (e.g., Chapman et al. 1989). This, no doubt, increases the probability of identifying large prey taxa in stomach samples relative to smaller prey. Accordingly, we noticed that most of the unidentifiable (and thus largely digested) fish in the stomach samples were relatively small. Thus, in addition to the inherent emphasis of %W on large prey taxa, we believe that a potential sampling bias further emphasizes large prey taxa by %W.
For example, using %W, Rand and Stewart (1998) reported that adult alewives Alosa pseudoharengus were more important than juvenile (young-of-year and yearling) alewives in the diets of salmonines. Using %W, Hartman and Brandt (1995) found that mysids were unimportant in the diets of weakfish Cynoscion regalis, whereas bay anchovies Anchoa mitchilli were very important. Using a bioenergetics model to estimate consumption based on %W, Hartman and Margraf (1992) found that walleyes' consumption of smaller invertebrates was far lower than their consumption of larger prey fish, indicating that small prey were less important than large prey in walleye diets. In all these studies, the important prey taxa were the larger taxa in the diets. Given the inherent emphasis on large taxa evident in our comparative analysis, it is reasonable to question the robustness of importance ratings based on %W alone.
Similar to %W, %MIRI also emphasizes the importance of large prey taxa. Although %MIRI was originally developed for overcoming disparity between small and large prey in diets of marine mammals (Pitcher 1980, 1981), our results suggests that it responds very similarly to %W. This is primarily because %O tends to increase importance values of all prey taxa regardless of prey size or number.
In contrast to %W, which may be viewed as a measure of the contribution of prey taxa to nutrition of the average predator, %O can be viewed as a measure of predator propensity toward prey taxa and accessibility of those taxa. Predator population feeding strategy is reflected in %O (Cortes 1997), and without this association, we are left to assume that all individuals in a fish population share the same food resources. Clearly, this assumption conflicts with the well-documented individual variation in fish diets (Bridcut and Giller 1995; Schindler et al. 1997; Fry et al. 1999). For example, Hubert and Sandheinrich (1983) found that decapods made up 38% of the dry weight of stomach contents from yellow perch at one sampling location in West Lake Okoboji, Iowa, although decapods were found in only 2 of the 38 stomachs examined. Elrod and O'Gorman (1991) and Hartman (1998) both noted that, despite contributing less in terms of %W, invertebrate prey occurred in larger percentages in the diets of predator fish than did fish prey. Balancing the different criteria for importance represented by these two measures has been elusive. Indeed, a majority of studies to date avoided the issue entirely, simply choosing one of the component indices (usually %W) without justification or rationale for their choice.
Our study indicated that, in contrast to %W, %N overemphasized small prey taxa in diets. Among 148 prey taxa rated as major by %N, 112 had prey size ratios less than zero. Because %N has seldom been used as an importance index in previous studies, we were unable to make comparisons with our study.
We believe that a compound index of prey importance should contain a balance of information on (1) the contribution of prey taxa to nutrition of the predator population as a whole and (2) the likelihood of taxa occurring in the diets of individual predators. Our results indicate that %IRI fulfills these requirements. The IRI was originally developed by Pinkas et al. (1971) to overcome the limitations of component indices. Accordingly, we define %IRI as the contribution of prey taxa to nutrition of the predator population as a whole, mediated by the abundance of and likelihood that individual predators will encounter and eat these prey. We believe that for many studies wishing to convey a general notion of the importance of various prey taxa, this is the optimal mix of importance characteristics. The balanced importance ratings and minimal size bias observed in our comparisons of %IRI with other indices support this conclusion.
Compound diet indices have been criticized on several grounds, including redundancy of the components in a compound index (MacDonald and Green 1983), nonadditivity of the %O component (Hansson 1998), and loss of information (Berg 1979; Bowen 1996). We acknowledge the validity of these criticisms and that %IRI cannot avoid all of these problems; however, we assert that %IRI preserves the original goal of compound indices. That is, it provides a balanced, general picture of the importance of prey taxa in the diets of predators. We further acknowledge that there may be situations, such as similar size among dominant prey taxa, in which use of a component index may be preferable to %IRI. We believe that definitive answers regarding the strengths and weaknesses of these indices await more comprehensive studies, particularly ones that test the relationship of indices with growth, survival, and other important aspects of the ecology of fish predators.
Acknowledgments
We thank Eric Bookmeyer, Bruce Hinrichs, John Paulin, Mark Pelham, Mark Sexton, Dillon Streets, Ed Thelen, and Dray Walter for assistance in the field and laboratory; Don Bonneau, Jim Christianson, and Tom Gengerke for agency support and encouragement; Phillip Dixon and Paul Hinz for statistical advice; and Don Bonneau, Bill Clark, Philip Dixon, John Downing, Barry Johnson, Joe Morris, and Mark Pelham for ideas and comments on an earlier draft of this manuscript. Financial support was provided by the Iowa Department of Natural Resources and Iowa State University.


