Effects of Zooplankton Spatial Variation on Growth of Larval Striped Bass: An Experimental Approach
Present address: Department of Biological Sciences, Florida International University, University Park, Miami, Florida 33199, USA.
Present address: Cooperative Research Units, Biological Resources Division, U.S. Geological Survey, c/o U.S. Fish and Wildlife Service, 1875 Century Boulevard, Atlanta, Georga 30345, USA.
Abstract
We quantified growth and mortality rates of larval striped bass Morone saxatilis in laboratory experiments simulating variability of prey abundance and composition along the riverine to lentic gradient in Lake Marion, South Carolina. Larvae were reared from 4 to14 d posthatch in three treatments: (1) low-prey, which simulated average prey abundance and composition in riverine and transitional habitats; (2) medium-prey, which simulated average abundance and composition in lentic habitats; and (3) high-prey, which simulated peak (patch) abundance and composition in lentic habitats. Larvae did not grow (weight-specific growth, G = −0.80 to −0.062/d; −0.02 to −0.01 mm/d) in the low-prey treatment but grew in the medium- and high-prey treatments (G = −0.035 to 0.105/d; 0.02–0.17 mm/d). Additionally, mortality also varied significantly among prey treatments. Larvae in the medium- and high-prey treatments experienced minimal mortality (Z = 0.041–0.085/d), whereas mortality was greater in the low-prey treatment (Z = 0.072–0.238/d). These results suggest that large-scale (km) spatial variability of zooplankton and other prey in Lake Marion may affect growth and survival of larval striped bass. Cohorts of striped bass transported to lentic habitats in the upper portion of Lake Marion should experience better growth and survival than cohorts in riverine or transitional habitats.
More than 100 years ago, Ryder (1884) wrote “certain living aquatic food seems to swarm at particular times and in fixed localities. As this kind of food is absent or abundantly present, so will the young fish perish or survive.” Since that time, fisheries scientists have conducted numerous studies addressing the effects prey availability has on larval growth and survival (reviewed by Leggett and Deblois 1994). In fact, Ryder's suggestion foreshadowed Cushing's (1972, 1990, 1996) match–mismatch hypothesis, which focused on the importance of temporal overlap between peaks in larval abundance and seasonal peaks in zooplankton production.
Prey availability is thought to influence recruitment dynamics through starvation mortality and through the interaction between larval growth and vulnerability to predators. Exactly how larval growth rate affects vulnerability to predators is the source of continued debate (Miller et al. 1988; Bailey and Houde 1989; Leggett and Deblois 1994; Paradis et al. 1996). Although larval escapement ability increases with growth, which reduces vulnerability, larval swimming speed may also increase, leading to more frequent encounters with predators (Miller et al. 1988; Fuiman and Magurran 1994). Thus, the relationship between vulnerability to predators and relative body size of larvae may be dome-shaped (Bailey and Houde 1989; Paradis et al. 1996). Nevertheless, the general consensus is that because mortality is usually greater in the larval stage than in juvenile and adult stages, faster growing cohorts should have reduced mortality because they pass rapidly through the vulnerable larval stage (Houde 1987; Cushing 1996).
Temporal and spatial overlap between larval fish and their prey is thought to have important effects on growth rate (Cushing 1972, 1990; Fortier et al. 1995; Gotceitas et al. 1996). The spawning behavior of adult fish, including the timing and location of spawning, can therefore be important to the survival of offspring. Year-class strength of fishes that are pelagic spawners may be affected by transport of eggs and larvae to nursery areas with varying availability of prey. For example, striped bass Morone saxatilis spawn in rivers, and their semibuoyant eggs and early larval stages are subject to transport downstream. Because the abundance and composition of prey vary along gradients from rivers to estuaries (or rivers to reservoirs for naturalized populations), transport processes may affect the growth and survival of striped bass larvae (Setzler-Hamilton et al. 1981; McGovern and Olney 1996).
In Lake Marion, South Carolina, adult striped bass spawn in the river systems flowing into the upper portion of this reservoir. The hatching location for eggs is largely determined by stream flow and water temperature and can vary from riverine habitats in the tributaries to transitional and lentic habitats within the upper portion of Lake Marion (Bulak et al. 1993). In a 3-year study, Bulak et al. (1997) determined the hatching date and location for multiple cohorts of striped bass larvae. By estimating hatching dates from otoliths of surviving juveniles (age 0), they determined which cohorts contributed most to recruitment. Cohorts hatching in or near the lake had greater survival rates than cohorts hatching in riverine habitats. Bulak et al. (1997) and Chick and Van Den Avyle (1999) demonstrated that zooplankton densities in lentic habitats are often (4 of 6 years) as much as two orders of magnitude greater than in riverine or transitional habitats (Figure 1). Chick and Van Den Avyle (1999) demonstrated that this large-scale (km) spatial variability of prey could affect the foraging success (% feeding, μg prey ingested) of larval striped bass. Prey abundance and composition in the lentic habitat usually offered better foraging opportunities for larval striped bass compared with riverine and transitional prey assemblages.
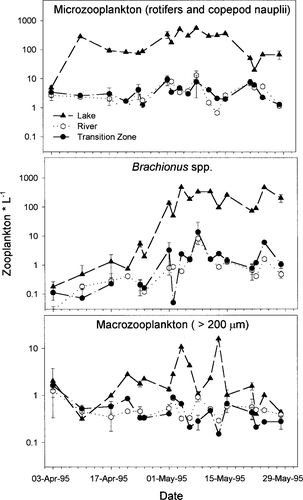
Mean densities of microzooplankton (rotifers—Brachionus spp. omitted—and copepod nauplii), Brachionus spp., and macrozooplankton (organisms >200 μm—copepods, cladocerans, insect instars) from three areas in Lake Marion, South Carolina. Data are from vertical-haul plankton samples collected in April and May 1995. The three areas were at least 8 km apart from each other. Error bars represent SE. See Chick and Van Den Avyle (1999) for site description and sampling methodology
To better understand how large-scale spatial variability of zooplankton in Lake Marion may affect striped bass larvae, we designed a laboratory experiment to determine whether our previously reported differences in foraging success could lead to measurable differences in larval growth and mortality rates. We reared striped bass larvae in prey treatments that encompassed the range of prey abundance and composition found along the riverine to lentic gradient in Lake Marion. Conducting growth experiments in laboratory settings is challenging, and problems such as high larval density, insufficient adjustment of prey levels, and failure to account for factors that increase availability of prey to larvae (e.g., small-scale patchiness, water column turbulence) have hindered previous studies (reviewed by Houde 1978; Hunter 1981; Chesney 1989; MacKenzie et al. 1990; Kiorboe and MacKenzie 1995). We attempted to avoid these problems by using a larval density that would not obscure treatment effects, by monitoring and adjusting prey levels frequently, and by including a treatment simulating the greatest abundance of zooplankton that larvae might encounter in Lake Marion.
Methods
Overview
We reared larval striped bass in blue, cylindrical, plastic containers with 15 L of water under a range of zooplankton conditions similar to those in upper Lake Marion. Each container was stocked with 50 3-d-old larvae. Although this density (3.33 larvae/L) is greater than typical field densities, several studies have demonstrated that this density is low enough to successfully test treatment effects on growth and survival of striped bass larvae (Houde and Lubbers 1986; Chesney 1989; Tsai 1991). Larvae that died within the first 24 h were replaced. Starting at 5 d posthatch, zooplankton were added to the containers in three treatments: low-prey, medium-prey, and high-prey (Table 1, described further below). Treatments were assigned to containers at random, and each was replicated 15 times. To obtain estimates of larval growth and mortality, we harvested all larvae from three containers for each treatment at 2-d intervals beginning at 6 d posthatch and ending at 14 d posthatch. We repeated this experiment three times during April and May of 1996 with different broods of larvae for each experiment.
Experimental protocol
Experiments were conducted at the former Moncks Corner Hatchery, Moncks Corner, South Carolina, which is maintained by the South Carolina Department of Natural Resources (SCDNR). We obtained striped bass larvae from the J. D. Bayless Hatchery (SCDNR) in Saint Stephens, South Carolina. For each experiment, we used a mix of larvae that were the progeny of three females and nine males. Larvae were reared in freshwater (to simulate conditions in Lake Marion) from a deep artesian well (hardness = 142.4 mg as CaCO3/L), and we replaced 1/3 of the water in each container every 2 d. The containers were kept partially submerged in a water bath with temperature regulated by 300-W aquarium heaters and an in-line 186-W chiller unit. Temperature within the containers varied as much as 2.5°C daily, and aeration maintained dissolved oxygen levels near saturation. Average temperatures were 21.5°C (range = 20–24°C), 22.6°C (range = 21–24°C), and 23°C (range = 21–24)°C during the first, second, and third experiments, respectively. Lighting was provided for 12 h each day by 40-W fluorescent lights. Average illumination within the containers was 6.8μE·m−2·s−1. Experimental temperature and light conditions were similar to those found at a depth of 2 m during the spring in Lake Marion.
The three zooplankton treatments corresponded to the range of conditions observed among sites in Lake Marion during 1995 (Figure 1; Chick and Van Den Avyle 1999). The low-prey treatment simulated conditions in riverine and transitional habitats (mean = 6.7 zooplankton/L; range = 1.7–22.2 zooplankton/L), and the medium-prey treatment simulated average conditions in lentic habitats (mean = 348.2 zooplankton/L; range = 5.8–1,011.5 zooplankton/L). We observed small-scale (m) patchiness within these sites averaging as much as twofold for microzooplankton (rotifers and copepod nauplii) and as much as 10-fold for macrozooplankton (adult copepods, cladocerans, and insects; Chick and Van Den Avyle 1999). To simulate peak (patch) abundance of prey, the high-prey treatment included twice the microzooplankton density and ten times the macrozooplankton density used in the medium-prey treatment (Table 1). Whereas it may be unrealistic to expect larvae to constantly remain in a prey patch, our intentions were to simulate the best possible foraging environment larvae might encounter in Lake Marion. Zooplankton were grouped into three categories for enumeration: rotifer Brachionus spp., the most frequently consumed prey item in our previous feeding study; microzooplankton (rotifers other than Brachionus spp. and copepod nauplii); and macrozooplankton (adult copepods, cladocerans, and insects).
We collected zooplankton daily from the Cooper River, South Carolina, for use in these experiments. We separated micro- and macrozooplankton with a sieve fitted with 200-μm mesh. Brachionus spp. were not very common in these collections, so we reared B. calyciflorus (a species native to Lake Marion) in 78-L plastic containers to ensure we could maintain the desired density of Brachionus. The containers were aerated, and the Brachionus spp. were fed a commercial zooplankton diet formulated for rotifers.
Prey abundance in the three treatments was monitored and adjusted as often as four times each day to maintain the desired levels. We counted zooplankton from 250-mL samples siphoned from three randomly selected containers for each treatment. The need for adjustments increased with larval age. For larvae aged 6–10 d, prey adjustments averaging 5% of the desired level (i.e., compensating for a 5% reduction) were made twice each day; adjustments increased to 20% three or four times each day for larvae aged 11–14 d. We used aeration to keep zooplankton evenly distributed within the containers. Periodic sampling from several areas within a container, with a 2.54-cm-diameter polyvinyl chloride (PVC) pipe to collect a discrete volume of water, confirmed that zooplankton were uniformly distributed.
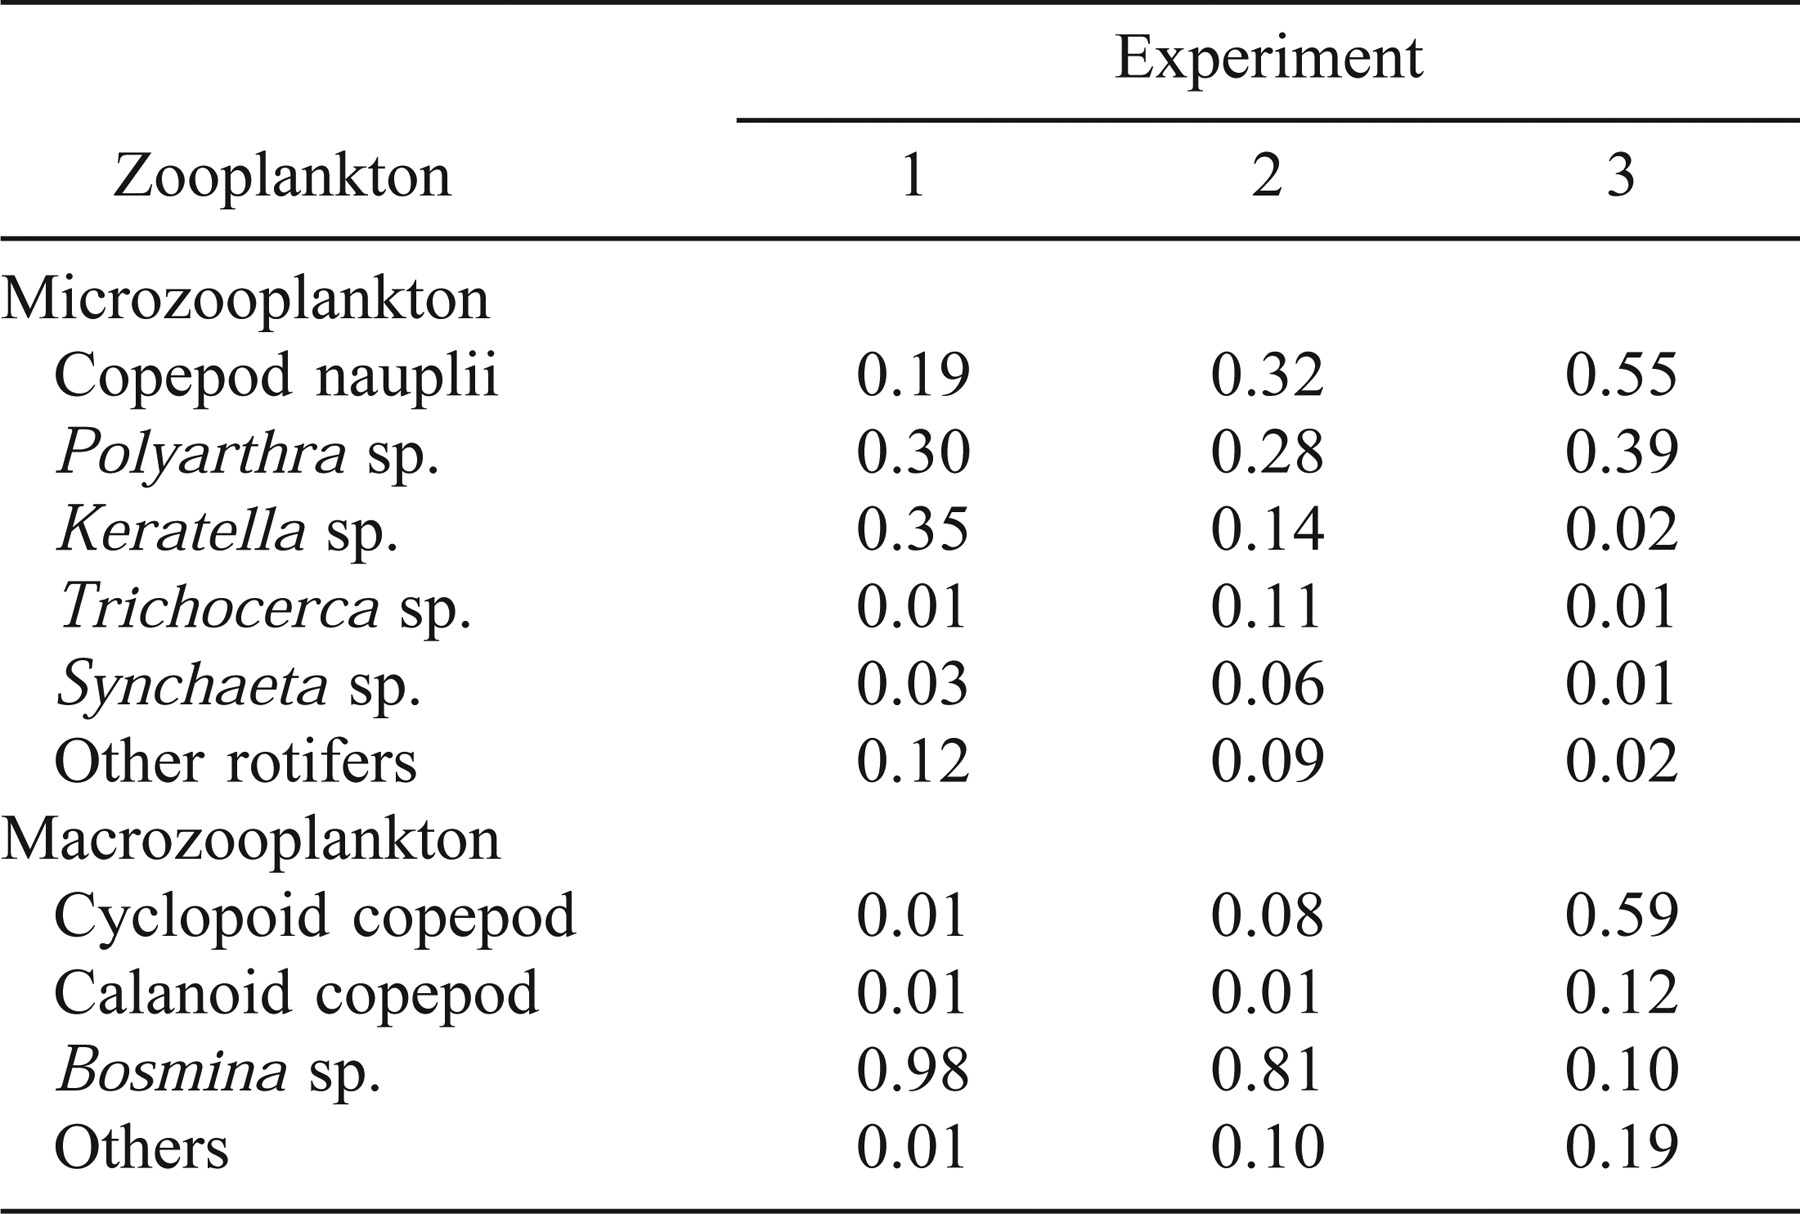
Whereas we maintained the total abundance of microzooplankton, macrozooplankton, and B. calyciflorus at constant levels in each treatment, the taxonomic composition of microzooplankton and macrozooplankton varied among experiments because of seasonal changes in the Cooper River fauna (Table 2). Additionally, cold laboratory temperatures during the first experiment caused high mortality in the B. calyciflorus cultures, and we were not able to keep this taxon at the desired levels during that time. We compensated by increasing the density of microzooplankton (see Table 2 for composition) to maintain the total prey abundance at the desired levels.
Analyses
To obtain estimates of foraging success, growth, and survival rates, we harvested all larvae from three replicates of each treatment and preserved them in 5% buffered formalin. We later checked for the presence of prey in the guts of all larvae with a dissecting scope at 40× magnification. Standard length (SL) was measured with an ocular micrometer to the nearest 0.1 mm for up to 25 larvae per container. Dry mass was measured for groups of up to 10 larvae (combined) in each container. We dried larvae at 60°C for 12 h, measured group mass to the nearest 0.001 mg, and calculated mean dry mass per larva for each container. To examine dietary patterns, we identified prey in the stomachs of at least 10 larvae per treatment, and made permanent mounts of their stomach contents by following the methods described in Chick and Van Den Avyle (1999).
For each experiment, we examined variation in the proportion of larvae feeding among treatments and ages using a two-way analysis of variance (ANOVA). Tukey's multiple-comparison procedure was used to examine differences among treatment levels when main effects were significant. Proportion data were arcsine transformed to correct for heteroscedasticity. Linear regression was used to examine larval growth and mortality rates. All analyses were conducted with the SAS statistical software package (SAS 1996). We used the α = 0.05 level of significance for all statistical analyses.
Because zooplankton were first introduced when larvae were 5 d old, we analyzed larval growth for ages 5–14 d. We estimated the daily growth coefficient, G, with the linear form of the exponential model:

where d = age (in days) − 5 (for larvae aged >5 d), Wd = dry mass per larva (mg) aged d, W5 = dry mass per larva aged 5 d, and ε is an error term. An F-test was used to determine if G varied among treatments. We also examined larval growth in length to better assess individual variability in growth and to facilitate comparison with other published studies. Growth in length was analyzed by using linear regression of SL (mm, untransformed) with age (d) for each treatment, and we used an F-test to examine differences in slope among treatments. Examination of residual plots suggested that transformations of length data were unnecessary.
The daily mortality coefficient, Z, was estimated by using the linear form of the exponential model

where d = age (in days) − 4 (for larvae aged >4 d), Nd = number of surviving larvae per container at age d, N4 = number of larvae aged 4 d, and ε is an error term. For this analysis, we fixed the y-intercept at N4 = 50 because our stocking density was 50 larvae per container and final stocking adjustments were made at age 4 d. We used an F-test to compare Z among treatments.
Results
The proportion of larvae feeding and growth and mortality rates all varied among the zooplankton treatments. In general, the low-prey treatment was not conducive to larval growth and survival, whereas the medium- and high-prey treatments offered favorable conditions. Larval performance, however, was not uniform among experiments. The most conspicuous difference was slower growth of larvae in experiment 1 relative to experiments 2 and 3.
The proportion of larvae feeding was consistently greater in the high- and medium-prey treatments than in the low-prey treatment (Figure 2). In all three experiments, differences in the proportion feeding were significant (ANOVA, df = 2, 44; P ≤ 0.0001) among prey treatments. In experiment 1, all three treatments differed significantly (Tukey P ≤ 0.05) with proportion feeding greatest in the high-prey treatment and least in the low-prey treatment. For experiments 2 and 3, the proportion feeding did not differ significantly between the medium- and high-prey treatments (Tukey P ≥ 0.05), but both were significantly greater than the low-prey treatment (Tukey P ≤ 0.05).
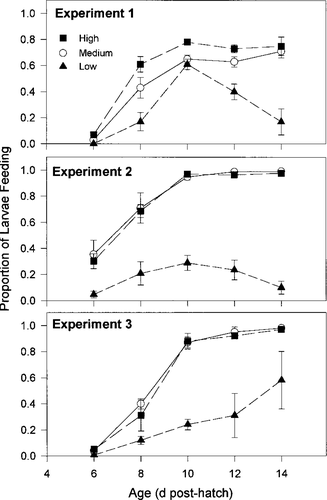
Mean proportion of larvae feeding for each treatment by age from three experiments conducted in April and May 1996. The total number of larvae from which these proportions were calculated was 1,613 for experiment 1, 1,496 for experiment 2, and 1,404 for experiment 3. Black boxes denote the high-prey treatment, open circles denote the medium-prey treatment, and black triangles denote the low-prey treatment. Error bars are ±SE
The proportion feeding also varied significantly (ANOVA, df = 4, 44; P ≤ 0.0001) among ages in all three experiments. Consistent increases in the proportion feeding occurred as larval age increased from 6 to 10 d. After 10 d, the proportion feeding reached a plateau between 0.60 and 0.98 in the medium- and high-prey treatments and, except in experiment 3, began to fall below 0.20 in the low-prey treatment (Figure 2). Differences in proportion feeding among the zooplankton treatments were less apparent for larvae aged 6–8 d than for ages 10–14 d, but this significant interaction (ANOVA, df = 8, 44; P ≤ 0.01–0.0004) did not mask the overall treatment effect.
Larvae lost mass in the low-prey treatment of all experiments. The daily growth coefficient, G, did not differ significantly from 0 for the medium- and high-prey treatments in experiment 1, but substantial growth occurred in these treatments during experiments 2 and 3 (Table 3; Figure 3). Growth rates in the high- and medium-prey treatments of experiment 2 did not differ significantly (F = 1.01; df = 1, 41; P > 0.05) but both were significantly greater than the growth rate in the low-prey treatment (F = 12.39, 11.38; df = 1, 41; P ≤ 0.0001). In experiment 3, growth rates in all three treatments differed significantly (F ranged from 6.18 to 10.74, df = 1, 41; P < 0.05) with G greatest in the high-prey treatment and lowest in the low-prey treatment; G ranged from −0.007 to 0.105/d in the high-prey treatment, from −0.035 to 0.086/d in the medium-prey treatment, and from −0.080 to −0.062/d in the low-prey treatment (Table 3). In general, the regression models for experiments 2 and 3 fit the data well with R2 ranging from 0.60 to 0.91.
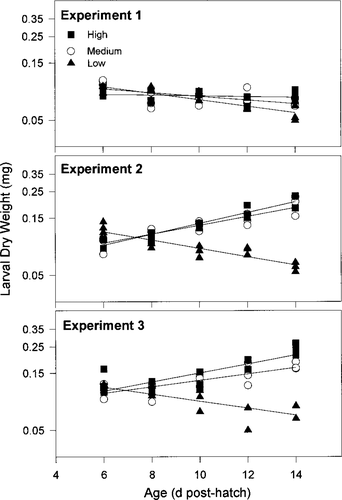
Larval growth in mass for each treatment from three experiments conducted in April and May 1996. Depicted are the mean dry mass (mg/larva) for the three replicates of each treatment. Black boxes denote the high-prey treatment, open circles denote the medium-prey treatment, and black triangles denote the low-prey treatment. Lines were fitted through linear regression (see Methods for details)
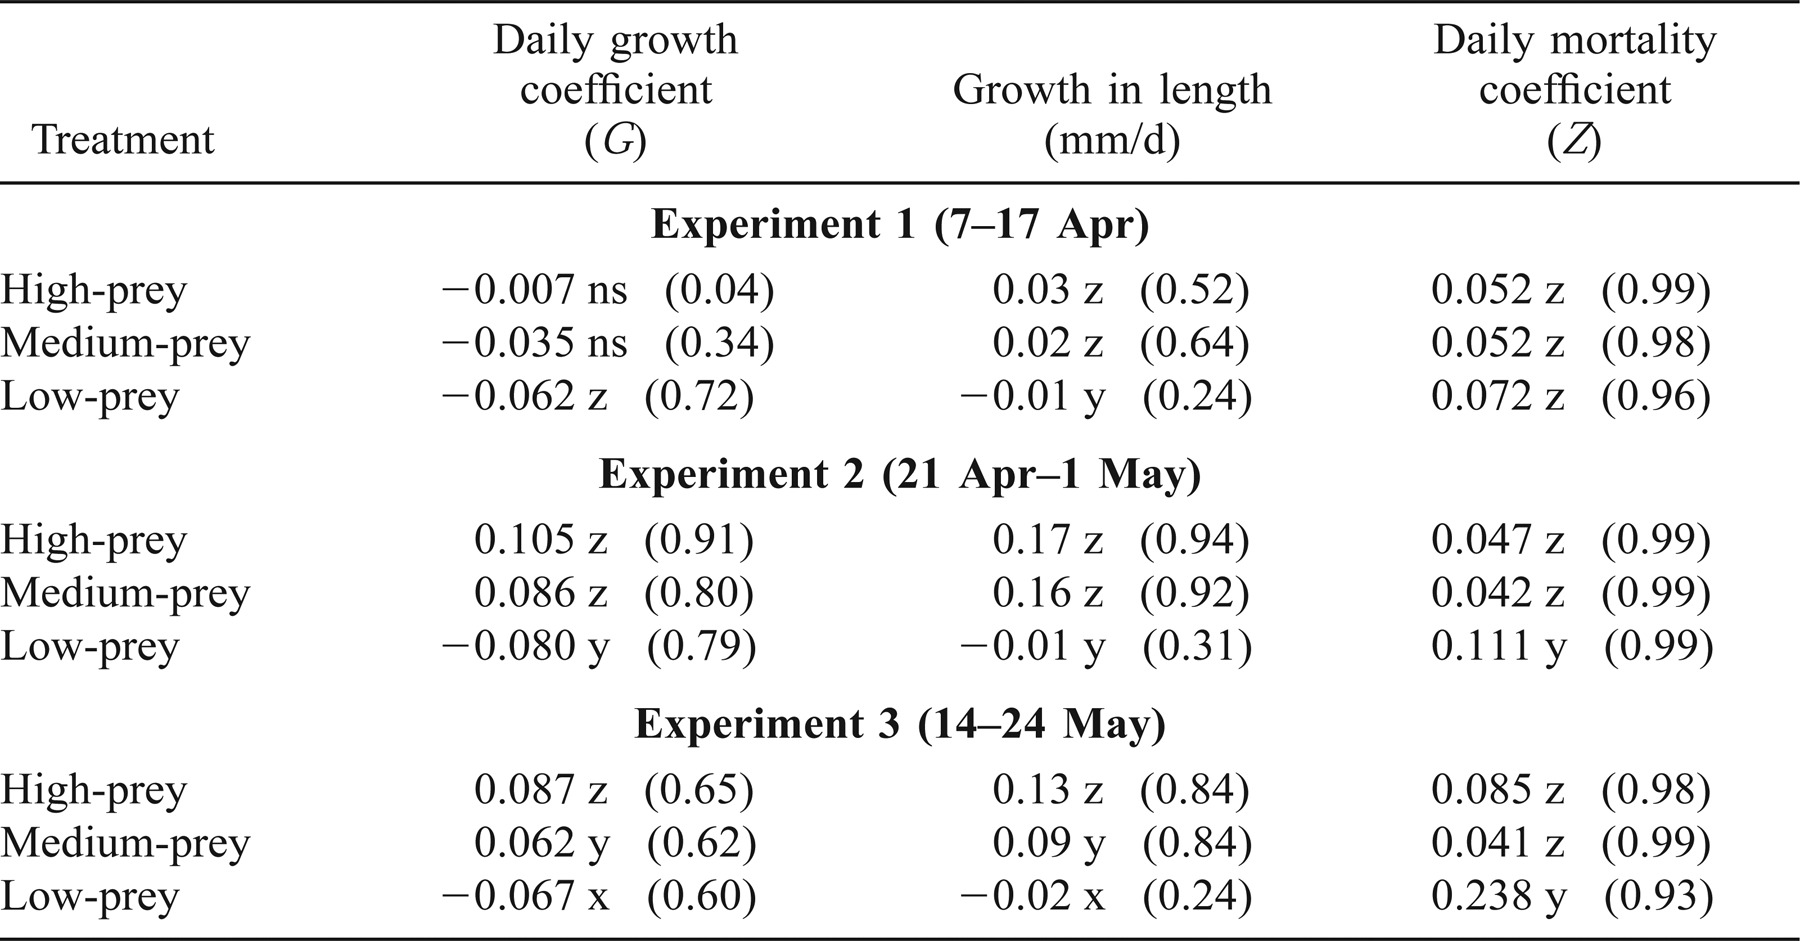
Patterns of growth in SL were generally similar to those in mass. Growth was negative in the low-prey treatment in all three experiments, though not significantly so in experiment 1. Growth rates (mm/d) ranged from 0.03 to 0.17 for the high-prey treatment, from 0.02 to 0.16 for the medium-prey, and from −0.02 to −0.01 for the low-prey treatment (Table 3). In experiments 1 and 2, the growth rates of the high- and medium-prey treatments differed significantly from the low-prey treatment (F ranged from 5.14 to 19.69, df = 1, 41; P ≤ 0.0001) but were not significantly different from each other (F = 2.74, 3.33; df = 1, 41; P > 0.05; Table 3). In experiment 3, the growth rate in all three treatments differed significantly (F ranged from 4.84 to 11.71; df = 1, 41; P < 0.05) with the fastest growth in the high-prey treatment and slowest in the low-prey treatment. Although growth in length was significant and positive for the high- and medium-prey treatments in experiment 1, the rates were very low and practically negligible (Table 3).
There was notable variation in the length distribution of 14-d-old larvae (Figure 4). Variation was more pronounced for the high- and medium-prey treatments than for the low-prey treatment. The mean coefficient of variation (CV) more than doubled from 2.8% at age 6 d to 6.8% at age 14 d for these treatments, whereas less of a change occurred in the low-prey treatment (CV = 3.1% and 4.6% for ages 6 and 14 d, respectively). In all experiments, some larvae grew slowly even in the high-prey treatment. Other larvae were of substantially larger sizes at 14 d than would have been achieved at the mean growth rates.

Length-frequency distributions for larvae at ages 6 (white bars) and 14 d (black bars) for the three prey treatments in each of the three experiments conducted in April and May 1996. Histograms depict the combined length frequency of larvae from three replicates of each treatment
Zooplankton composition and water temperature variation might have influenced differences in growth rates among experiments. Brachionus spp. (almost exclusively B. calyciflorus) were the most frequently consumed prey item in experiments 2 and 3 but were less important during experiment 1 when we were unable to maintain the desired abundance of B. calyciflorus (Figure 5). Shifts in the composition of macrozooplankton in the Cooper River were especially pronounced. Bosmina spp. were numerically dominant in experiments 1 and 2, but cyclopoid copepods were most abundant in experiment 3 (Table 2). The diet of larval striped bass, in part, mirrored these changes. Bosmina spp. were important prey during the first experiment but were consumed less frequently in experiments 2 and 3 (Figure 5).
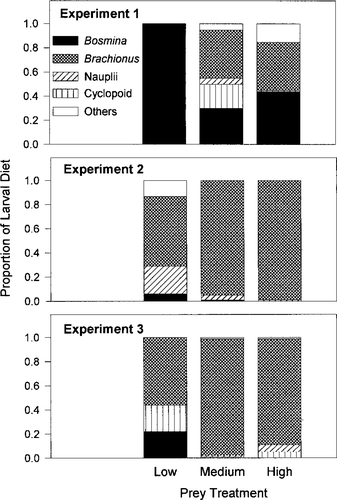
The average proportion (numbers consumed) of Bosmina, Brachionus calyciflorus, adult and copepedite cyclopoid copepods, copepod nauplii, and other organisms ingested by larval striped bass during three experiments conducted in April and May 1996
The daily mortality coefficient, Z, was minimal in the high- and medium-prey treatments, ranging from 0.05 to 0.09/d (4.8–8.6%/d) in the high-prey treatment and from 0.04 to 0.05/d (3.9–4.8%/d) in the medium-prey treatment (Table 3; Figure 6). Mortality was greater for larvae reared in the low-prey treatment with Z ranging from 0.07 to 0.24/d (6.7–21.3%/d; Table 3). Among the three treatments in experiment 1, Z did not vary significantly (F range, 0.01–0.68, df = 1, 42; P > 0.05), whereas in experiments 2 and 3, Z was significantly greater in the low-prey treatment than the high- and medium-prey treatments (F range, 3.56–6.55, df = 1, 42; P < 0.05; Figure 6). The greatest mortality occurred for larvae reared within the low-prey treatment in experiment 3.
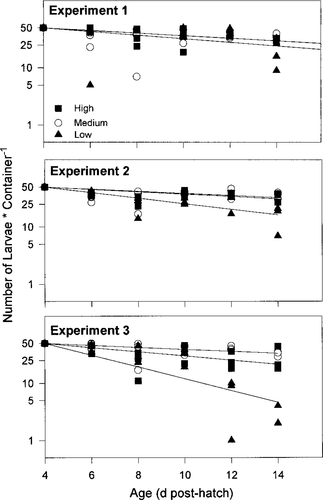
Larval mortality for each treatment during three experiments conducted in April and May 1996. Depicted are the numbers of larvae surviving in the three replicates of each treatment. Black boxes denote the high-prey treatment, open circles denote the medium-prey treatment, and black triangles denote the low-prey treatment. Lines were fitted through linear regression (see Methods for details)
Discussion
Our results suggest that variation in the abundance and composition of zooplankton along the riverine to lentic gradient in Lake Marion may significantly affect the growth and survival of first-feeding striped bass larvae. Conditions typical of riverine and transitional habitats, simulated by the low-prey treatment, were not conducive to larval growth, whereas treatments simulating lentic conditions (medium- and high-prey treatments) supported greater growth and survival. These results, together with those of Chick and Van Den Avyle (1999) and Bulak et al. (1997), suggest that larval cohorts transported to lentic habitats in Lake Marion are likely to have faster growth rates than cohorts in riverine or transitional habitats. Because slower growing cohorts are likely to have greater mortality from predators, parasites, and diseases and greater overwinter mortality, cohorts transported to lentic habitats may also have greater survival rates (Houde 1987; Cooper 1996; Cushing 1996; Conover et al. 1997). The results of our study support and provide a mechanism for the assertion by Bulak et al. (1997) that substantial recruitment to the juvenile stage in Lake Marion derived primarily from the few cohorts of eggs that were transported to lentic habitats during favorable times.
At least three types of zooplankton variability are thought to be important to larval growth: seasonal variation, large-scale spatial variation, and small-scale patchiness. The importance of seasonal variation in zooplankton production is most often associated with Cushing's (1972, 1990) match–mismatch hypothesis. Research on several fishes has provided support for Cushing's hypothesis that temporal overlap between larval abundance and seasonal peaks in the production of prey has important effects on recruitment success (Leggett and Deblois 1994; Fortier et al. 1995; Gotceitas et al. 1996). A number of studies also have suggested that variation of zooplankton at large spatial scales can influence the growth and survival of fishes with early life history stages subject to hydrodynamic transport (Simpson 1987; Canino et al. 1991; McLaren and Avendano 1995; Napp et al. 1996). This suggests a simple modification of the match–mismatch hypothesis to include spatial, as well as temporal, overlap between larvae and the production of their prey (Skreslet 1989; Gotceitas et al. 1996; Chick and Van Den Avyle 1999). The results of our research and that of Bulak et al. (1997) suggest that recruitment dynamics of striped bass in Lake Marion may be regulated by spatial and temporal match–mismatch between larvae and suitable prey resources (Chick and Van Den Avyle 1999).
The most conspicuous difference in the zooplankton assemblages among riverine, transitional, and lentic habitats in Lake Marion was greater abundance of microzooplankton, especially rotifers, in the lentic habitat (Bulak et al. 1997; Chick and Van Den Avyle 1999). Brachionus spp. was the most frequently consumed prey taxon in both this study and our previous foraging experiments; foraging on other rotifer taxa was limited. In experiment 1, when we were unable to maintain the desired abundance of B. calyciflorus, larval growth in the high- and medium-prey treatments was negligible. The scarcity of B. calyciflorus in experiment 1 probably accounted for this lack of growth because larvae in these treatments fed almost exclusively on this taxon and grew at faster rates during experiments 2 and 3. Nevertheless, we cannot rule out the possibility that temperature or brood effects influenced these differences.
Our study did not fully address all issues related to larval transport in Lake Marion. Larvae hatching within riverine habitats may eventually be transported to lentic habitats. How long detrimental effects from poor foraging in riverine and transitional habitats will persist after larvae are transported to lentic habitats is an important question. Gotceitas et al. (1996) found that reductions in the size of cod larvae reared for a relatively brief period (11 d) at low-prey levels (high-prey levels thereafter) could persist for 20 d or more compared with larvae reared under continuous high-prey conditions. Given that cod begin foraging at 5–7 d posthatch (i.e., 4–6 d foraging at low-prey levels), this suggests that even brief periods of mismatch between larvae and suitable prey resources may be important. More research is needed to determine the long-term effects associated with various durations of mismatch between larvae and suitable prey resources.
Laboratory studies on growth and ingestion rates of larval fish have often been unable to demonstrate successful growth under natural abundance of zooplankton (reviewed by Hunter 1981; Chesney 1989; Meng 1993). In part, this has stimulated research into factors that can increase availability of prey to fish larvae, such as small-scale patchiness and the effects of turbulence (Chesney 1989; Mikheev et al. 1992; Doving et al. 1994; Kiorboe and MacKenzie 1995). In this study, growth rates of larvae reared at patch abundance of zooplankton were fairly similar to those of larvae reared at average lentic abundance of zooplankton. This result is especially striking, given that the high-prey treatment was constant through time rather than variable. Large-scale spatial variability of zooplankton in Lake Marion may be more important to larval striped bass than small-scale patchiness. Small-scale patchiness and the effects of turbulence, however, are probably important to the foraging success and growth of many larval fishes including striped bass in other systems (Setzler-Hamilton et al. 1981; Chesney 1989). The failure of laboratory studies to simulate these conditions and the inability of many studies to demonstrate larval growth at realistic prey densities are important criticisms of laboratory studies (MacKenzie et al. 1990). Nevertheless, this study and those of Houde (1978) and Chesney (1989) demonstrate that laboratory studies can successfully examine variation of larval growth rate among realistic abundances of zooplankton.
Growth rates in this study were slow compared with other studies reporting growth rates as great as 0.9 mm/d and daily growth coefficients as great as 0.179/d (Table 4). Conover et al. (1997) demonstrated that growth rates for Santee–Cooper striped bass are relatively slow compared with more northern population, an example of countergradient variation in growth. Nevertheless, faster growth rates than observed in our study have been reported for this population from field (0.67–0.91 mm/d; Bulak et al. 1997) and pond studies (0.41–0.83 mm/d; Secor and Dean 1989). Several factors might have contributed to the relatively slow growth rates observed in our study. Because growth rates were fairly similar in the medium- and high-prey treatments, it is doubtful that further increases in prey abundance would have increased growth. It also is unlikely that growth rates were limited by density-dependent effects (i.e., interspecific competition) for the same reason.
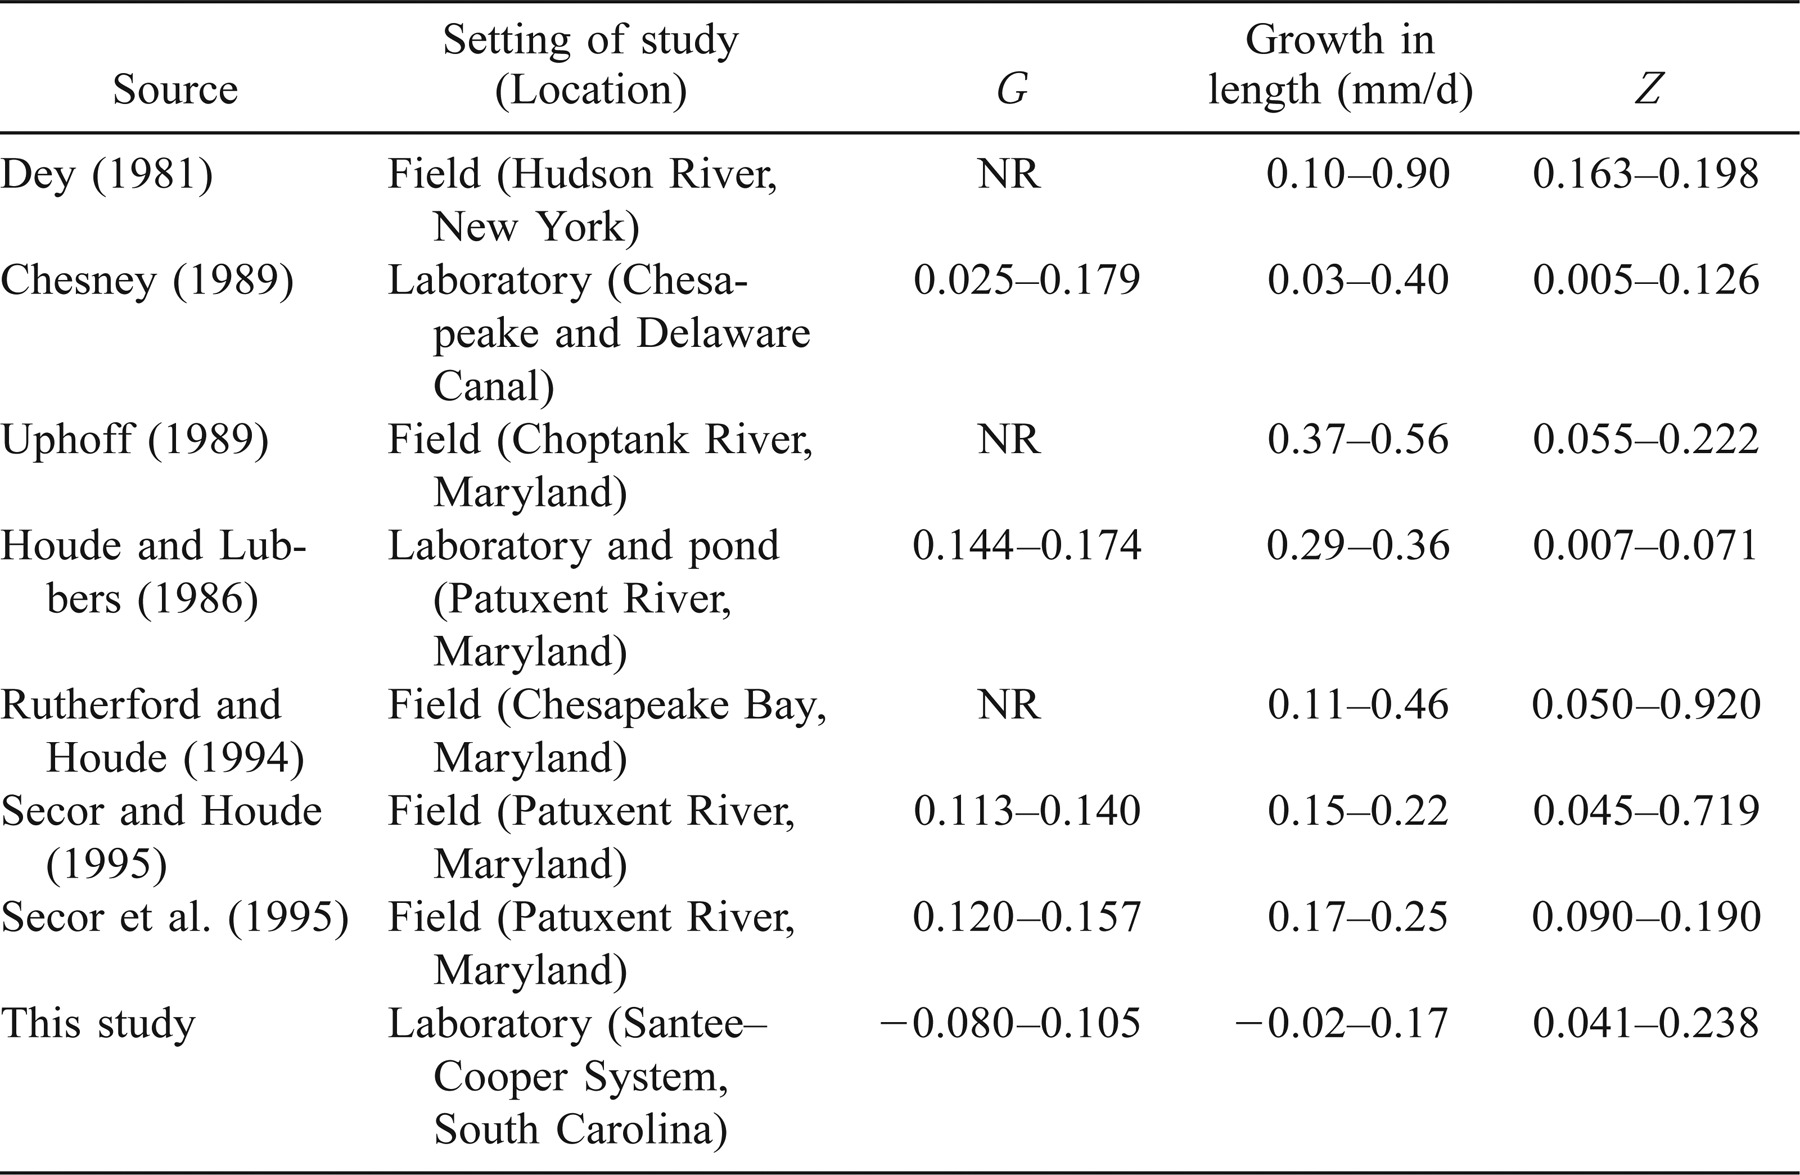
The faster growth rates observed in previous studies might have resulted from higher quality prey items. Growth rates observed in the high- and medium-prey treatments in this study may represent the upper limit to growth for the type of prey available. Crustacean zooplankton, such as nauplii and adult stages of the copepod Eurytemora affinis, cladocerans, and nauplii of brine shrimp Artemia spp. (in laboratory studies), were important prey items in most studies cited in Table 4. Although crustacean zooplankters were presented to larvae in this study, the most frequently consumed prey item was B. calyciflorus, which is substantially smaller than most crustacean zooplankters.
Differences in our experimental design, particularly the ages of larvae and duration of the study, also may account for the slower growth rates in our study compared with previous studies. We evaluated larval growth between the ages of 6 and 14 d posthatch, whereas the studies cited above and in Table 4 typically examined growth through age 25 d or older. The relationship between larval striped bass length and age is typically exponential or sigmoidal, with the fastest growth rates occurring after age 15 d (Dey 1981; Secor et al. 1995). Chesney (1989) reported substantial increases in per capita feeding after age 15 d. In our study, the proportion of larvae feeding did not reach a maximum plateau until 10 d posthatch. Additionally, we reared larvae in freshwater to simulate conditions in Lake Marion, whereas most of the studies in Table 4 reared larvae in brackish conditions (3–5‰ salinity). Salinity between 0.5‰ and 10.0‰ has been found to be more favorable for rearing larval striped bass than freshwater (Geiger and Parker 1985; Uphoff 1989).
The mortality observed in this study fell within the range reported from studies of other striped bass populations (Table 4). Mortality in the low-prey treatment was somewhat greater than might have been expected based on other published laboratory studies (Eldridge et al. 1981; Houde and Lubbers 1986; Chesney 1989). Striped bass larvae are thought to be relatively resistant to starvation mortality because they have been able to live in laboratory situations from 19 to 32 d posthatch without food (Eldridge et al. 1981; Rogers and Westin 1981; Bennett et al. 1995). That we found significant variation in mortality among our treatments is somewhat surprising given that our experiment ended at 14 d posthatch and that the low-prey treatment was not a starvation (i.e., no-prey) treatment.
Studies of other striped bass populations also have suggested that spatial overlap between larvae and zooplankton might be important to larval growth and survival (Setzler-Hamilton et al. 1981; McGovern and Olney 1996). This study, Bulak et al. (1997), and Chick and Van Den Avyle (1999) provide strong evidence that large-scale (i.e., km) spatial variation in the abundance and composition of zooplankton in Lake Marion may have important effects on larval growth and survival. In other systems, reservoir discharge patterns have been managed to improve the reproductive success of striped bass (Rulifson and Manooch 1990). Our findings suggest the possibility that flow rates in the tributaries of Lake Marion might be managed to improve the recruitment of striped bass as discussed by Bulak et al. (1997) and Chick and Van Den Avyle (1999).
Acknowledgments
This research was funded by the Electric Power Research Institute (EPRI) through a fellowship in their population biology program. Jim Bulak, Jim Cowan, and Edward Chesney provided valuable suggestions on the design of this research. We are grateful to Gary Grossman, Gene Helfman, Karen Porter, and Richard Wiegert for their comments on earlier versions of this manuscript. We thank Van Garner, Anthony Overton, Carl, Ruetz, Laura Townley, and Thomas Waldrop for assistance in the field and laboratory. We thank Tom Curtis, Forest Sessions, the staff of the J. D. Bayless Hatchery, and the South Carolina Department of Natural Resources for logistical and personnel support and valuable assistance with this research. The Georgia Cooperative Fish and Wildlife Research Unit is jointly sponsored by the University of Georgia, the U.S. Geological Survey Biological Resource Division, the Georgia Department of Natural Resources, and the Wildlife Management Institute.


