Vertebral Bone Mass, Size, and Volumetric Density in Women with Spinal Fractures
Abstract
Bone densitometry provides a measure of bone mass expressed as bone mineral content (BMC) or areal bone mineral density (aBMD). BMC is unadjusted for bone size while aBMD is adjusted for the projected area of the region scanned but not its depth. Because patients with fractures often have reduced bone size, the deficit in BMC or aBMD relative to controls may be partly the result of the comparison of a smaller bone in patients with fractures with a bigger bone in controls without fractures. We asked, what proportion of the deficit in BMC and aBMD found in women with spine fractures relative to controls is attributable to smaller vertebral size? We measured BMC (g), volume (cm3, derived from projected area3/2), aBMD (g/cm2), and volumetric BMD (vBMD, g/cm3) of the third lumbar vertebra by dual-energy X-ray absorptiometry in 270 premenopausal women aged 18–43 years, 163 postmenopausal women with spine fractures aged 54–83 years, and 209 women without fractures aged 54–87 years. The regression of BMC and aBMD on volume in the premenopausal women was used to calculate volume adjusted BMC and aBMD in postmenopausal women with and without fractures (adjusted BMC = observed BMC + [50 – observed volume] × 0.29; adjusted aBMD = observed aBMD + [50 – observed volume] × 0.0044). The data were expressed in the original units and as standard deviation scores (SD) above or below the young normal mean (T scores) or the age predicted mean (Z scores). All results were expressed as mean ± SEM. Women with spine fractures had reduced BMC (T = –2.35 ± 0.07 SD, Z = –1.18 ± 0.06 SD), volume (T = –1.08 ± 0.08 SD, Z = –0.82 ± 0.08 SD), aBMD (T = –3.06 ± 0.09 SD, Z = –1.14 ± 0.06 SD) and vBMD (T = –2.67 ± 0.10 SD, Z = – 0.94 ± 0.07 SD) (all p < 0.001). About 48% of the difference in BMC between postmenopausal women with and without spine fractures, and about 16% of the difference in aBMD was explained by the difference in vertebral volume between them. When women with and without spine fractures were intentionally matched by aBMD (and age, height, and weight), vertebral volume was reduced (Z = –0.66 ± 0.13 SD, p < 0.001). When women with and without fractures were intentionally matched by vertebral volume (and age, height, and weight), vBMD was reduced (Z = –1.07 ± 0.10 SD, p < 0.001). Women with spine fractures have smaller vertebrae with less bone in the smaller bone. About half the deficit in BMC relative to controls is due to their smaller bone size. The remainder may be due to reduced bone accrual, increased bone loss, or both. Thus, the pathogenesis of bone fragility is heterogeneous. Factors responsible for a deficit in bone mass (due to reduced accrual or excess bone loss) are unlikely to be identified when reduced bone size exaggerates the deficit, and increased bone size obscures it. Understanding the pathogenesis of bone fragility requires acknowledgment of this heterogeneity and the description of its varied morphological basis. This can be achieved by the study of the periosteal and endosteal surfaces of bone because the absolute and relative changes in these surfaces during growth and aging determine skeletal size, its mass, and architecture.
INTRODUCTION
Dual-energy x-ray absorptiometry provides a measure of bone mass expressed as the bone mineral content (BMC) unadjusted for bone size, or areal bone mineral density (aBMD), a measurement that corrects for the projected area (height and width) of the region scanned in the coronal plane but not its depth. Because patients with spine fractures often have reduced bone size,1-3 an independent determinant of bone strength,4, 5 the deficit in bone size may partly account for both the increased bone fragility and for the deficit in BMC and aBMD relative to age-matched controls.
If smaller bone size, reduced bone accrual, and excessive bone loss contribute to bone fragility, failure to account for the smaller bone size will overestimate the deficit in BMC produced by the reduced accrual of bone or excessive bone loss. By contrast, in patients with large bones, a normal or high BMC or aBMD relative to controls may obscure any deficit in volumetric bone mineral density (vBMD) leading to the erroneous conclusion that neither reduced accrual nor excessive bone loss occurred. The aim of this study was to confirm that women with spine fractures have reduced vertebral body size and to determine its contribution to the deficit in BMC and aBMD.
MATERIALS AND METHODS
Subjects
We studied 163 postmenopausal women, age range 54–83 years, with one or more clinically diagnosed spine fractures. The diagnosis of fracture was based on clinical examination and lateral X-ray radiographs. A fracture was defined as a vertebral end plate, wedge, or crush deformity based on lateral radiographs and a reduction of vertebral body height of >20%. The patients were recruited from the Metabolic Bone Clinic. We excluded patients with traumatic fractures and patients with fractures of the third lumbar vertebra. We also excluded patients with illnesses known to affect bone metabolism (e.g., thyroid disease, hyperparathyroidism, chronic liver or renal disease) and patients receiving medication known to affect bone density.
We also studied 748 healthy women: 343 premenopausal women aged 18–53 years with regular menstrual cycles and 405 postmenopausal women aged 45–87 years. All controls were healthy volunteers without fractures recruited from the community as part of the ongoing research in this department. Two hundred and seventy premenopausal women aged 18–43 years were studied to determine the T scores and the relationship between bone mass and bone size. (Seventy-three premenopausal women aged 44–53 years were not used in the derivation of the T score or derivation of the relationship between size and bone mass because slight bone loss may have occurred, see Statistical Analyses). Of the postmenopausal women, 209 (aged 54–87 years) were matched by age with the postmenopausal women with fractures. All were ambulatory. They had no illnesses and received no medication known to affect BMD. All subjects gave informed consent. The study was approved by the ethics committee of the Austin and Repatriation Medical Center.
Measurements of vertebral bone mass, volume and vBMD
BMC (g), vertebral body area (cm2), aBMD (g/cm2), vertebral body volume (cm3), and vBMD (g/cm3) of the third lumbar vertebra were measured by posteroanterior (PA) scanning using dual-energy X-ray absorptiometry (DPX-L, Version 1.3z; Lunar Corp., Madison, WI, U.S.A.). Vertebral body volume (V) was estimated using V = A3/2, where A is the projected area of the third lumbar vertebra obtained by PA scanning.6 This method estimates the minimum volume of a cube enclosing the vertebral body. Although this measurement overestimates volume,7 it correlates with true volume determined in vitro by submersion (r = 0.80, p < 0.001; Tabensky and Seeman, unpublished data, with permission). vBMD was calculated by dividing BMC (derived by PA scanning which includes the mass of the posterior processes) by the volume. The coefficient of variation for BMC, aBMD, volume, and vBMD was 1.4, 1.1, 1.7, and 1.5%, respectively.
Because reduced bone mass may affect edge detection and underestimate the projected bone area, 76 women with fractures were matched with 82 controls by aBMD (T scores within ± 0.02 SD) as well as by age, height, and weight to more rigorously determine whether vertebral size was reduced in women with fractures. We also assessed whether BMC, aBMD, and vBMD were reduced in women with fractures after intentionally controlling for bone size by matching 64 women with fractures and 64 women with no fractures by vertebral volume (T scores within ± 0.02 SD) as well as age, height, and weight. The criteria for matching between the controls and cases was age within ± 1 year, height within ± 3 cm, and weight within ± 3 kg, respectively.
Statistical analysis
Vertebral BMC and volume were expressed as a T score, the number of standard deviations (SD) above or below the young normal adult mean. For postmenopausal women with spine fractures, vertebral BMC and volume were also expressed as Z scores, the number of SD above or below the age-predicted mean derived by linear regression using data in 405 postmenopausal women. The Z score for an individual is derived by: the observed value minus the age-predicted value divided by SD of the reference population. The Z scores were also adjusted for height and weight (as well as age) based on multiple linear regression in the 405 postmenopausal women.8 Covariance of analysis was used to determine the difference of absolute values between groups adjusted for height. Two sample t-tests were used to determine any difference in BMC, volume, aBMD, and vBMD between fracture cases and age-matched controls. One-sample t-tests were used to determine whether the T or Z scores differed from zero.
Because of the known dependence of bone mass on bone size, we regressed BMC on volume in premenopausal women. To derive the volume-adjusted BMC in postmenopausal women with and without spine fractures, we used the data in 270 premenopausal women aged 18–43 years, under the assumption that this was a period of stability in BMC with little gain in bone mass or bone size due to growth and little bone loss due to aging. The regression equation was BMC = k (volume) + C. The following formula was used to calculate BMC adjusted for volume: observed BMC + (mean volume – observed volume) × k.9, 10
Comparison of the deficit in BMC in women with fractures relative to controls before and after adjustment for differences in bone size in each group indicates how much of the observed deficit is accounted for by the difference in bone size and how much is the result of reduced bone accrual, excessive bone loss, or both. The effect of bone size was also controlled by design by examining the magnitude of any difference in BMC, aBMD, and vBMD in patients with fractures after matching with controls by bone volume as well as age, height, and weight. All the results were expressed as mean ± SEM, and p values were two-tailed.
RESULTS
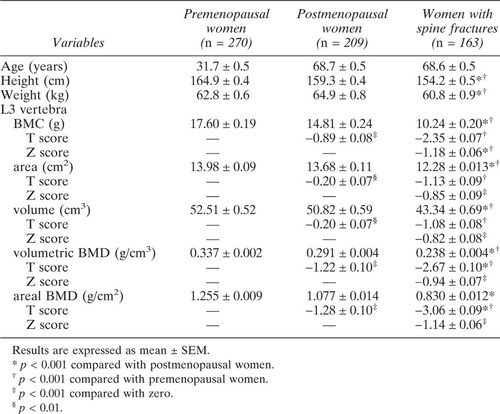
BMC correlated weakly with age in premenopausal women (r = 0.11, p = 0.04). BMC and vBMD diminished with advancing age in normal postmenopausal women (Table 1, Fig. 1). Vertebral volume also correlated with age in premenopausal women (r = 0.13, p = 0.01), but not in postmenopausal women. Vertebral volume was about 3% lower in postmenopausal than premenopausal women, but the difference was not significant after adjustment for height (Table 1, Fig. 1). vBMD was reduced by about the same amount as aBMD in postmenopausal women.

The distribution of bone mineral content (BMC, g), volume (cm3), and volumetric bone mineral density (vBMD, g/cm3) of the third lumbar vertebra as a function of age in 343 premenopausal women aged 18–53 years (gray circles), 405 postmenopausal women aged 45–87 years (open circles), and 163 women with spinal fractures aged 54–83 years (black circles).
BMC and aBMD were reduced in women with spine fractures relative to age-matched controls. Vertebral volume was about 15% lower (Table 1, Fig. 1). vBMD was slightly less reduced than BMC or aBMD. When adjusted for height and weight as well as for age, the deficits (expressed as Z scores) in BMC and BMD were only slightly diminished, whereas the Z score for volume halved, from –0.82 ± 0.08 to –0.43 ± 0.10, still a significant deficit (p < 0.001). The difference in volume persisted when 76 women with fractures were intentionally matched by aBMD (and age, height, and weight) with 82 postmenopausal women without fractures (44.7 ± 1.0 vs. 49.4 ± 0.9 cm3, respectively, p < 0.001). The deficit in vertebral volume Z score was –0.66 ± 0.13 SD (p < 0.001).
In the premenopausal women, there was a significant regression of BMC and aBMD on vertebral volume, with significant positive intercepts (Fig. 2). The slope of aBMD on volume was small: 10 cm3 change of volume resulted in about a 3% change in BMD. The regression slope was used to calculate BMC adjusted to a volume of 50 cm3 in postmenopausal women with and without fractures (adjusted BMC = observed BMC + [50 – observed volume] × 0.29). Similarly, the formula used to calculate volume adjusted aBMD was: observed aBMD + (50 – observed volume) × 0.0044.

The regression of vertebral BMC and areal BMD (aBMD) on vertebral volume in 270 premenopausal women aged 18–43 years. The dashed lines show the 95% confidence bands for individual values of y on x.
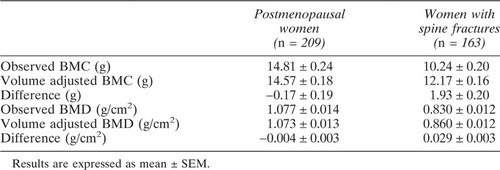
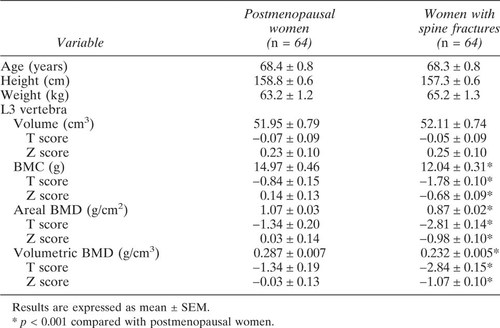
The observed and volume-adjusted values for BMC and aBMD for postmenopausal women with and without fractures are shown in Table 2. The observed difference in BMC between women with and without fractures was 4.57 ± 0.20 g, the volume adjusted BMC difference was 2.40 ± 0.16 g, a reduction of 2.17 ± 0.20 g relative to the unadjusted difference. So, almost half (48%) of the observed deficit in BMC in patients with fractures was accounted for by the reduction in volume. The deficit in aBMD in postmenopausal women with fractures was 0.25 ± 0.01 g/cm2 before and 0.21 ± 0.01 g/cm2 after volume adjustment. Thus, about 16% of the observed deficit in aBMD in patients with fractures was accounted for by the lower bone volume. Similar results were found when women with and without fracture were matched for vertebral volume as well as for age, height, and weight (Table 3).
DISCUSSION
We have confirmed reports that vertebral bone size is reduced in women with spine fractures,1, 2 demonstrated that this was not the result of an edge detection error, and reported that about 50% of the deficit in BMC is the result of reduced bone size. Smaller bone size was also found when patients with spine fractures were intentionally matched with controls by aBMD. To confirm that BMC was reduced for reasons other than the smaller bone size, the women with fractures were intentionally matched with women without fractures by bone size and were found to have deficits in BMC of similar magnitude to the bone size-adjusted deficit.
We calculated volume adjusted BMC in postmenopausal women with and without fracture, using the regression of BMC on volume in premenopausal women. Our approach was similar to the adjustment of radial BMC to a constant bone width (BW).9, 10 Because the regression lines have a positive intercept, using the slope is more accurate than dividing BMC by an index of size to obtain vertebral vBMD (Table 1) or BMC/BW in the radius.9, 10 The resultant variables are size dependent and decrease hyperbolically as size increases.11 We measured volume in unfractured vertebrae, but the high correlations between the dimensions of different bones allow us to infer that the fractured vertebrae also were initially smaller than normal.12
There have been several studies reporting that patients with spine fractures have smaller vertebral size. Gilsanz et al. reported 5–12% smaller vertebral cross-sectional area in patients with spine fractures relative to gender-age-, height-, weight-, and vBMD-matched controls without fractures.1 Mazess et al. reported that postmenopausal women with spine fractures had 7% smaller vertebrae compared with age- and height-matched controls without fractures.2 About 60% of the patients with fractures had vertebral size in the lowest tertile for bone size, while 10% had bone size in the upper tertile of the distribution.2
Although reduced bone size is reported to be an independent risk factor for fracture in several studies,1-3 finding reduced bone size in the fracture cases implies, but does not prove, that the reduced bone size was responsible for the bone fragility leading to fracture. Most studies suggest bone strength is positively correlated with bone size.5, 13 However, increased vertebral AP diameter has been found in patients with spine fractures.14, 15 Moreover, Yang et al. reported a inverse correlation between bone strength and increasing bone area in an in vitro study of the vertebral body devoid of its posterior elements.16 Further studies will be needed to address these disparate observations.
Bone size in the elderly is determined by peak bone size attained during growth and periosteal apposition during aging. Vertebral bodies undergo net periosteal apposition after skeletal maturity,17 but probably too slowly for the absence of this process to account for the smaller bone size in patients with fractures. The marginally smaller volume in normal postmenopausal women compared with premenopausal women was most likely a secular effect due to earlier birth, but this could not apply to the fracture patients who were age matched with controls.
Our results support the notion that reduced vertebral body size at skeletal maturity is likely to be determined during growth and may be an independent risk factor for vertebral fracture. In some cases, all bones are small in the same proportion, a circumstance manifested most obviously in reduced stature. But since the difference in vertebral volume remained significant after adjustment for height, some patients with fractures may have vertebrae that are disproportionately smaller relative to the rest of the skeleton.
Reduced size and reduced vBMD contributed equally to the reduced BMC in the fracture population, but the relative importance of these factors varied between individuals. In about 10% of patients, the low BMC was due entirely to lower volume (Z score <–1 SD) with normal vBMD (Z score >0 SD). At the other end of the scale were patients with normal volume in whom the low BMC was due entirely to the low vBMD (Table 3). But in the majority of patients both factors contributed.
Low peak bone size and low peak BMD are consequences of events that take place in the growing skeleton, providing further support for the notion that osteoporosis has its origins in growth.18, 19 Peak bone size depends on the rate and duration of growth plate cartilage cell proliferation, and the rate and duration of periosteal apposition, which are linked in order to maintain bone shape within narrow limits.12 The cancellous contribution to peak BMD depends on the balance between the formation of new trabeculae at the growth plate and their resorption in the metaphysis and the extent to which surviving trabeculae become thicker during the adolescent growth spurt.12 The cortical contribution to peak BMD depends on the rate of endocortical resorption throughout the growth period and the extent of endocortical apposition during the growth spurt.20 The various components of skeletal growth have been studied in greater detail for long bones, but the vertebral body can conveniently be regarded as two metaphyses with no intervening diaphysis.12 Genetic and environmental determinants will contribute to bone size and how much bone is in the bone at skeletal maturity, thus setting the stage for increased fracture risk many years later.
The use of volume-adjusted BMC does not increase the diagnostic sensitivity of densitometry. BMC and aBMD reflect both bone size and vBMD and so they discriminate between those who have and have not sustained a spine fracture and inform about the risk of future fracture. The deficit in BMC and aBMD were similar (Z = –1.18 SD vs. –1.14 SD, respectively) while the deficit in vBMD was less (Z = –0.94 SD). This “capturing” of size in the BMC and aBMD measurement may explain why these expressions of bone mass are similar predictors of fracture and breaking strength of bone.2, 7, 21, 22 However, the issue of diagnostic sensitivity was discussed in more detail in an earlier study.7 Our purpose here was to further the understanding of pathogenesis of bone fragility.
In conclusion, the pathogenesis of the bone fragility is heterogenous; reduced bone size, reduced peak bone accrual, and increased bone loss each contribute, in varying proportions from patient to patient. Factors reponsible for a deficit in bone mass (reduced accrual, bone loss, or both) are unlikely to be identified when reduced bone size exaggerates the deficit, while an increased bone size obscures it. Statistical methods cannot correct for confounding of this kind. Identification of the genetic and environmental factors contributing to bone fragility will require acknowledgment of this heterogeneity, the description of its varied morphological basis, and the use of more appropriately chosen control groups that take this heterogeneity into account.
Acknowledgements
We thank Sister Jan Edmonds for her assistance with subject recruitment for this study, and senior technologist Ms. Vanessa De Luca for her technical assistance. We also thank Dr. Guoqi Qian, Department of Statistics, La Trobe University for his constructive statistical assistance.


