Skeletal Involvement in Female Acromegalic Subjects: The Effects of Growth Hormone Excess in Amenorrheal and Menstruating Patients
Abstract
Bone involvement is a common clinical feature in acromegalic patients, though previous studies gave divergent results possibly because of the different gonadal status of the patients studied. To study the influence of estrogen milieu in these patients, we evaluated 23 acromegalic patients with active disease, subdivided into two groups: menstruating and amenorrheal patients, comparable for duration and activity of disease. Forty-two matched women served as controls. Skeletal involvement was studied by measuring: (a) the main biomarkers of bone turnover: serum alkaline phosphatase total activity (AP), bone GLA protein (BGP), serum carboxy-terminal propeptide of type I collagen (PICP), serum type I cross-linked N-telopeptide (ICTP), and urinary pyridinoline and deoxypyridinoline corrected for creatinine (Pyr/Cr, D-Pyr/Cr) and urinary calcium/creatinine ratio (Ca/Cr); (b) bone mineral density (BMD), as measured by quantitative computed tomography both at lumbar spine and distal radius, and by dual X-ray absorptiometry both at lumbar spine and at three femoral sites (Ward's triangle, femoral neck, and great trochanter). AP, BGP, ICTP, Pyr/Cr, D-Pyr/Cr were significantly higher in patients than in controls, independent of the menstrual pattern. Higher PICP levels were found in the whole group and in menstruating acromegalics when compared with control women; no difference was found in amenorrheal patients, who in turn showed higher urinary Ca/Cr values. When patients were considered all together, BMD at spine, femoral neck, and trochanter was higher than in controls. In contrast, when the gonadal status was taking into account and, menstruating and amenorrheal subjects were considered separately, BMD at spine, but not in other sites, was significantly higher in menstruating patients than in controls. In contrast, no difference of BMD values at any site was observed between amenorrheal patients and controls. The mean BMD Z scores allowed us to detect an unequal involvement of different skeletal sites. Our results show that bone turnover is increased in acromegalic women and suggest that GH anabolic effect on bone is more evident in the presence of estrogens and that different skeletal sites may be affected differently by hormone excess.
INTRODUCTION
GROWTH HORMONE (GH) is an important factor in the regulation of both bone growth and metabolism during lifespan.1-3 GH anabolic effects on bone have been mainly investigated in in vitro studies4-12; these effects are direct7-10 and mediated by insulin like growth factors.4,11,12 Moreover, clinical studies have provided information to improve our understanding of the role of GH on bone in both physiological and pathological conditions.1,13-22 The progressive decline in GH secretion is considered to be among the factors contributing to age-related and postmenopausal bone loss,18,23-25 and some authors have suggested that GH may play a role in the treatment of osteoporosis.1,3,13-17
Skeletal involvement is a common clinical feature in acromegalic patients. Previous studies, based on the measurement of biochemical markers of bone metabolism, have shown an increased bone turnover in such patients.26-29 However, data regarding bone mass are still conflicting.28-34 The different gonadal status from different series of patients might be a possible explanation of these divergent results: GH excess could not prevent the adverse effect of estrogen deficiency on the skeleton. To test this hypothesis, the present study on the pattern of skeletal involvement in female acromegalic patients with different gonadal milieu has been performed.
MATERIALS AND METHODS
Patients
Twenty-three female acromegalic patients, aged 29–70 years (mean age 45.3 ± 12.6 years), body mass index (BMI) 20.8–34.6 (mean BMI 27.9 ± 4.4) with active disease were studied. They were selected out of a larger series of 67 patients followed up in our Center, with the aim to study two groups which differed only in the gonadal status. In all patients, GH values were above 2 ng/ml after oral glucose. Fasting plasma insulin-like growth factor 1 (IGF-I) and insulin-like growth factor binding protein 3 (IGFBP-3) levels were above the normal range. The estimated duration of the disease was 6.5 ± 5.1 years. Four patients had previously undergone surgery, while none had undergone radiotherapy. Two patients were under treatment with bromocriptine. No patient had renal or hepatic impairment; prolactin, thyroid, and cortisol hormone levels were normal. No patient had any other diseases nor consumed substances affecting bone metabolism.
The sample was divided into two groups. The first (group A) included 11 subjects, aged 29–50 years (mean age 38.8 ± 7.3 years), BMI 20.9–34.0 (mean 28.6 ± 4.1 years) with either regular bleedings or only minor abnormalities of menstrual cycles (more than six cycles/year). The second (group B) included 12 patients, aged 30–70 years (mean age 52.6 ± 12.5 years), BMI 20.8–34.6 (mean 27.8 ± 4.8) with secondary amenorrhoea lasting for more than 2 years (range 2–20 years, mean 8.2 ± 6.3). The mean estimated duration of the disease did not differ in the two groups (A = 5.3 ± 2.1 years vs. B = 7.3 ± 6.4 years; p = NS).
Forty-two women, matched for age (range 30–71 years, mean 48.8 ± 11.6 years), BMI (range 21.4–35.0, mean 27.8 ± 4.7), and menstrual history, served as controls. All subjects had normal physical examinations and routine laboratory tests and were not taking medications known to influence bone metabolism. They were divided into two groups with different gonadal status: the first (group An) included 18 subjects, aged 30–51 years (mean 40.2 ± 7.2 years), BMI 21.4–30.7 (mean 26.2 ± 3.2) with normal menstrual cycle; the second (Bn) included 24 subjects, aged 30–71 years (mean 55.3 ± 9.9), BMI 21.5–35.0 years (mean 28.9 ± 5.2) with a situation of hypogonadism lasting for more than 2 years (range 2–29 years, mean 10.0 ± 8.9), due to postmenopausal status (21 subjects) or to secondary untreated amenorrhea (three subjects with secondary hypothalamic amenorrhea, who served as controls for two young amenorrheal acromegalic patients). No significant difference in BMI was observed among the four groups of subjects. Serum prolactin levels were in the normal range and did not differ between postmenopausal subjects and subjects with secondary hypothalamic amenorrhea (data not shown). In both amenorrheal patients and controls, serum estradiol levels were below 10 pg/ml and did not differ between the two groups.
Biochemical determinations
Serum and urinary samples (fasting spot urine) of patients and controls were collected after an overnight fast and stored at −70°C until assayed. In all patients, serum total calcium (Ca), phosphorus (P), creatinine (Cr), and alkaline phosphatase total activity (AP) were determined by a multichannel autoanalyzer. In acromegalic patients, serum IGF-I was evaluated by radioimmunoassay (RIA) after acid-ethanol extraction (Nichols Institute Diagnostics, San Juan Capistrano, CA, U.S.A.), serum IGFBP-3 by RIA (Nichols Institute Diagnostics, BT Wychen, The Netherlands), and serum GH by immunoenzymometric assay (Eurogenetic Italy, Turin, Italy). Intra- and interassay CVs were 3 and 8.4% for IGF-I, 4.8 and 6.2% for IGFBP-3, and 2.9 and 4.6% for GH, respectively. Sensitivity was 0.1 ng/ml for GH, 13.5 ng/ml for IGF-I and 0.25 ng/ml for IGFBP-3, respectively.
Bone GLA protein (BGP) was measured by immunoradiometric assay (IRMA) for the intact molecule (ELSA-OST-NAT, CIS BioInternational, Gif-Sur-Yvette, France); intra- and interassay CVs were 3.8 and 4.7%, respectively, and the sensitivity was 0.3 ng/ml.
In all control subjects and in 14 patients (7 from group A and 7 from group B), collagen metabolic by-products were assessed. Serum carboxy-terminal propeptide of type I collagen (PICP) was determined by RIA (PICP RIA Kit, Orion Diagnostica, Espeo, Finland); the intra- and interassay CVs were 3.2 and 5.1%, respectively, and the sensitivity was 0.34 mg/ml. Serum type I cross-linked N-telopeptide (ICTP) was also measured by RIA (Telopeptide ICTP, Orion Diagnostica); the intra- and interassay CVs were 4.8 and 6.5%, respectively, and the sensitivity was 0.34 ng/ml.
In all subjects, urinary calcium, total pyridinoline (Pyr), and deoxypyridinoline (D-Pyr) excretions were also evaluated and corrected for urinary creatinine (Ca/Cr, Pyr/Cr, and D-Pyr/Cr, respectively). Urinary Pyr and D-Pyr were measured by fluorometric detection after reverse phase high pressure liquid chromatography (HPLC) utilizing a commercial Kit (Bio-Rad Laboratories, Italy). The urine samples were prepared for HPLC by acid hydrolysis, followed by separation on a cellulose column. The intra- and interassay CVs were 5.4 and 9.2% for Pyr, 6.6 and 12.3% for D-Pyr, respectively.
Bone densitometry
In all subjects, bone mineral density (BMD) was evaluated at axial and appendicular skeletal sites with different composition in cortical and trabecular tissue by means of different devices. Spinal BMD was evaluated by both single-energy quantitative computed tomography L1–L4 (QCT) (Toshiba CT Xpeed; Toshiba Medical Systems Division, Tokyo, Japan) that selectively measures trabecular true density (in vivo precision 1.8%) and by dual X-ray absorptiometry L2–L4 (DXA; Norland XR-26; Norland Instruments, Fort Atkinson, WI, U.S.A.) that assesses BMD of total vertebral bodies (in vivo precision 1.0%) in 21 patients (11 from group A and 10 from group B) and in all controls. Radial BMD was measured by peripheral QCT (Stratec XCT 960; Stratec Medizintechnik GmbH, Pforzheim, Germany) in 18 patients (9 from group A and 9 from group B) and in 24 controls (10 from group An and 14 from group Bn); the last equipment (in vivo precision 1.2%) allows the measurement either of an integrated value (pQCT) or of trabecular (pQCTt) and cortical (pQCTc) BMD, separately, at an ultradistal site of the nondominant arm. BMD was finally evaluated by DXA at three femoral sites: neck (NECK), Ward's triangle (WT) and great trochanter (TROCH) (in vivo precision, respectively, 2.1, 3.5, and 2.4%) in 20 patients (10 from group A and 10 from group B) and in 26 normal subjects (12 in group An and 14 in group Bn).
Statistical analysis
The results are described as mean ± SD. For each variable, normality of distribution was tested with the “W statistic.” Mean comparisons between the whole groups of patients and controls were made using t-test for unpaired data. The two-way analysis of variance (ANOVA) test was performed to evaluate the possibility of interaction of GH excess with the estrogen milieu. Thereafter, because this interaction was not found, ANOVA among the four groups was made using the one-way ANOVA test; when significant differences were found, the Bonferroni's t-test for multiple comparisons was performed. The associations between variables were tested by Pearson's product moment correlation; stepwise multiple regression was performed to find out possible correlations between indices of disease activity (i.e., GH and IGF1) and the other variables. To compare the values of bone mass measured at various skeletal sites with different devices in females of varying ages, individual BMD values were normalized by relating them to those of the reference population of our Center35 and expressed as SD units (or Z-transform), the distribution of which is centered on a mean of 0 with an SD of 1. Mean Z score values were then compared. Probability values of less than 0.05 were considered significant.
RESULTS
GH, IGF-I, and IGFBP-3
In all patients, fasting GH levels (mean of at least three daily determinations for each patient) were 23.1 ± 26.6 ng/ml (range 2.8–115.6 ng/ml). IGF-I values were 1212 ± 462 ng/ml (range 520–2018 ng/ml), and IGFBP-3 levels were 8.4 ± 3.6 mg/l (range 4.9–18.9 mg/l). These parameters were not different between the two groups (GH group A mean 19.3 ± 16.8, range 2.8–51.7 ng/ml vs. group B mean 26.8 ± 33.5, range 3.4–115.6 ng/ml; IGF-I group A mean 1199 ± 502, range 520–1940 ng/ml vs. group B mean 1231 ± 440, range 780–2018 ng/ml; IGFBP-3 group A mean 8.8 ± 4.3, range 4.9–18.9 mg/l vs. group B mean 7.9 ± 2.8, range 5.6–13.6 mg/l).
Serum Ca, P, Cr, and urinary Ca excretion
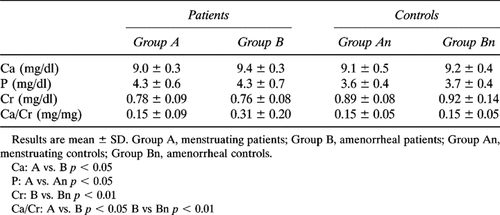
As shown in Tables 1A and 1B, serum Ca levels were not different between all patients and controls, but in amenorrheal patients they were significantly higher than in menstruating ones. Serum P levels were significantly higher in patients than in controls. Serum Cr values were significantly lower in the whole group of patients and in amenorrheal ones than in respective controls. Finally, fasting urinary Ca/Cr levels were significantly higher in the whole group of patients than in controls; no statistical difference was found between menstruating controls and group A patients, while Ca/Cr levels were significantly higher in amenorrheal acromegalic women than in both menstruating patients and amenorrheal controls (Tables 1A and 1B).
Markers of bone turnover
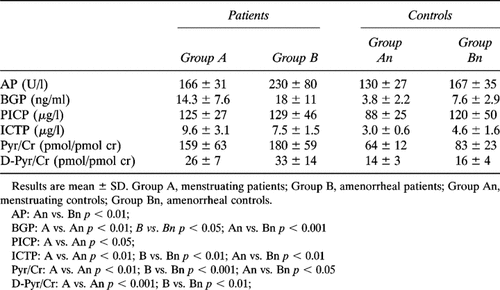
As shown in Table 2A, AP, BGP, PICP, ICTP, Pyr/Cr, and D-Pyr/Cr levels were significantly higher in patients than in controls. BGP, ICTP, Pyr/Cr, and D-Pyr/Cr levels in each subgroup of patients were significantly higher than in appropriate controls. PICP levels in patients of group A was significantly higher than in appropriate controls, while no difference was found between amenorrheal patients and their control group (Tables 2A and 2B).
Bone mass
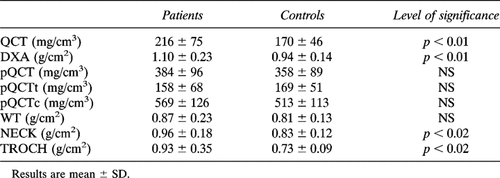
In the whole group of patients, spinal BMD as measured by both QCT and DXA was significantly higher than in respective controls (Table 3A), whereas radial BMD was not significantly different, even when trabecular (pQCTt) and cortical (pQCTc) bone density were separately considered (Table 3A). In all patients, femoral BMD was significantly higher than in respective controls at NECK and TROCH sites, whereas no significant difference was found at WT (Table 3A).
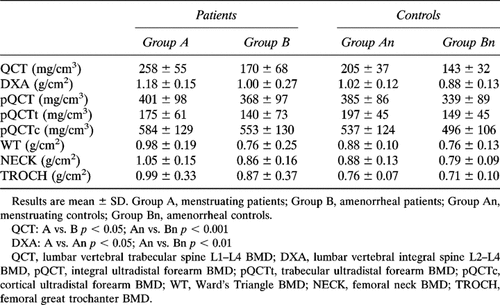
When subjects were divided with respect to gonadal status, menstruating patients showed higher BMD at the spine, as measured by DXA, than controls. In contrast, BMD values at any site were not significantly different in amenorrheal patients as compared with control subjects. Moreover, when only acromegalic patients were considered, menstruating subjects showed higher bone mass measured at spine by QCT, but not in other skeletal sites, than amenorrheal subjects (Table 3B).
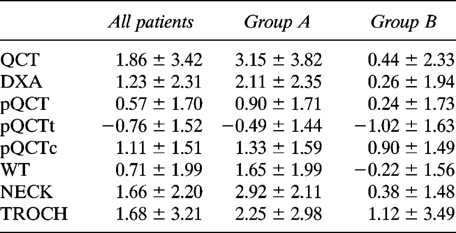
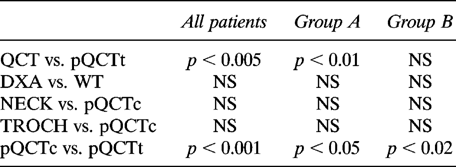
Z-score values showed an unequal pattern of the BMD measured at various skeletal sites (Fig. 1). As shown in Table 4B, in the whole group of acromegalics and in menstruating patients, the comparison of BMD Z scores of different sites showed that trabecular bone density is increased at the spine when compared with the forearm, while cortical bone Z values showed similar behavior at different sites. Moreover, the comparison of Z values of the forearm showed that BMD is increased at cortical bone with respect to trabecular bone in acromegalic patients.

Mean Z values of BMD levels measured at different skeletal sites: all patients (white square), group A (diagonal line square), group B (black square). Results are mean ± SD. Group A, menstruating subjects; Group B, amenorrheal subjects; QCT, lumbar vertebral trabecular spine L1–L4 BMD; DXA, lumbar vertebral integral spine L2–L4 BMD; pQCT, integral ultradistal forearm BMD; pQCTt, trabecular ultradistal forearm-BMD; pQCTc, cortical ultradistal forearm BMD; WT, Ward's Triangle BMD; NECK, femoral neck BMD; TROCH, femoral great trochanter BMD. Significant p values are illustrated in Table 4B.
Correlations
In the whole sample of acromegalics, P and Ca/Cr values were directly correlated with GH and IGF-I. On the contrary, Cr values were inversely correlated with both GH and IGF-I levels.
BGP, ICTP, and Pyr/Cr values showed a significant positive correlation with GH, but not with IGF-I. No correlation was found between GH, IGF-1, IGFBP-3 levels, and BMD measured at various sites. Stepwise multiple regression did not reach statistical significance, probably because of the sample size.
DISCUSSION
Several studies have reported the anabolic effect of GH on bone.1,3,13-17,21 In vitro studies have shown that GH can act both directly and indirectly on osteoblasts.3-11 Biochemical and histomorphometrical studies have revealed that GH increases bone turnover,19,20,33,34 the effect being higher for bone formation than for resorption.1,15,36 Moreover, studies on GH-deficient children showed an anabolic effect of GH on bone: the administration of substitutive therapy in prepubertal age caused higher linear growth and bone mass in these patients.21 Also, in adults, GH deficiency has been shown to be associated with lower BMD levels,22,37 but the effects of GH treatment on bone mass in these subjects are discordant.13,38-43 Studies on animal models showed that GH supplementation increases BMD36 and could counteract the negative effect of the lack of estrogen on BMD.44
Several studies have shown an increased bone turnover rate in acromegalic patients,26-29,33,34 whereas data on BMD are conflicting.28-32 This could be due to the small size of the samples studied, which included both male and female acromegalic patients, not always with active disease. Therefore, potential misleading factors, in particular gonadal status, could have influenced such results.
To limit the possible influence of such factors, we enrolled for this study only female patients with active acromegaly. They were divided into two groups with different gonadal status but comparable as regards activity and duration of the disease.
The results of our study, in accordance with previous reports,26-29 show that in acromegaly bone turnover is increased; in fact the markers of both bone formation and resorption are significantly higher than those of the control subjects. The increase of bone turnover seems to be dependent on a direct consequence of the chronic GH excess since several markers of bone remodeling are correlated to GH levels rather than to IGF-1 levels. This finding is consistent with a direct action of GH on bone tissue, as suggested by the demonstration of GH receptors on osteoblasts.9,10 GH also induces a local skeletal production of IGF-I, that is not entirely reflected by its total serum concentration.45 Bone turnover markers did not significantly differ between menstruating and amenorrheal patients. This finding suggests that, at least in a small sample, GH excess is the predominant factor in determining the accelerated bone turnover, possibly concealing the effects of different estrogen milieu.
However, fasting urinary calcium excretion (Ca/Cr) was significantly increased in amenorrheal versus menstruating patients but not in amenorrheal versus menstruating controls. This finding, in the presence of the same degree of disease activity in the two groups of patients, suggests that calcium balance may be more negative when the lack of estrogens is associated with an increased bone turnover as that induced by GH excess.
Our data demonstrate that GH excess is associated with increased BMD at spine. This finding is due to the difference of BMD between patients and controls observed in menstruating but not in amenorrheal subjects, suggesting, therefore, that the anabolic effect of GH excess is evident in the presence of normal estrogen levels.
The finding that our acromegalic patients showed lower creatinine levels than controls, could suggest that the glomerular filtration rate may have an influence on BMD. However, when compared with controls, serum creatinine levels were significantly reduced only in amenorrheal patients, whose BMD was not increased, but not in acromegalic menstruating patients, having higher BMD. These present data indicate, therefore, that there is no association between lower serum creatinine levels and higher BMD.
Our data clearly demonstrate that the anabolic effect of GH excess is present only at spine level but not in other sites of similar bone composition such as forearm and WT. Similarly, also in cortical bone, a different effect of GH excess was observed in different sites, BMD being increased in TROCH and NECK but not in forearm. However, since the positive effect of GH excess on TROCH and NECK was lost when subjects were analyzed by ANOVA according to their gonadal status, caution is needed in the interpretation of these data. The divergent effects of GH excess on different skeletal sites characterized by similar tissue composition are indicated also by the comparison of the mean Z score values of BMD of several skeletal sites (Table 4B and Fig. 1).
These findings suggest a regional site-specific sensitivity of cortical and trabecular bone to GH excess possibly due to a different mechanical loading; this phenomenon becomes more evident in the presence of estrogens. Moreover, the different mean Z values of cortical and trabecular bone measured at forearm suggest that GH excess may exert divergent effects on either trabecular or cortical tissue of the same skeletal site. Finally, we did not find any significant correlation between parameters of disease activity and BMD, possibly because changes in bone turnover induced by disease may not immediately result in BMD modifications.
In conclusion, our data demonstrate that GH excess increases bone turnover and that the anabolic effect of GH is more evident in the presence of estrogens. Moreover, trabecular and cortical bone show different sensitivity to GH excess at various skeletal sites.


