Use of ultrasound to predict difficult intubation in Chinese population by assessing the ratio of the pre-epiglottis space distance and the distance between epiglottis and vocal folds
Abstract
Objective:
To investigate the accuracy of using the ratio of pre-epiglottis space distance (Pre-E) and the distance between the epiglottis and the vocal folds (Pre-E/E-VF) measured by the ultrasound to predict potential difficult airway in the Chinese population.
Design:
A prospective clinical study.
Setting:
The pre-operative assessment service clinic of Tuen Mun Hospital.
Patients:
Patients with age of 18 years or above, who were scheduled for elective surgery requiring general anesthesia with direct laryngoscopy and tracheal intubation.
Results:
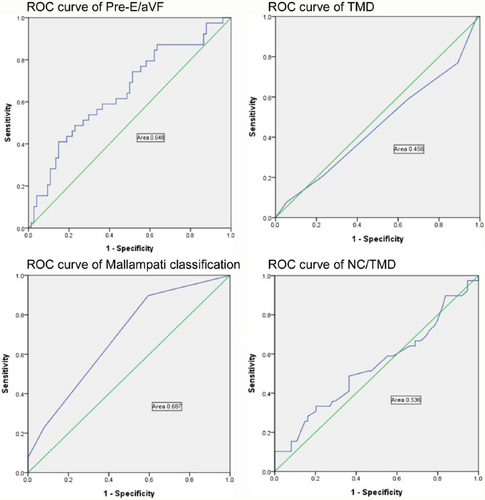
A total of 113 patients with direct laryngoscopic assessment during elective operations were included. Thirty-nine (34.5%) patients had potential difficult airway which was defined as documented Cormack–Lehane classification grade 2b, 3, or 4 by the anesthetists. Measurement of the distance from the epiglottis to the anterior vocal folds (Pre-E/aVF) ratio had better inter-rater reliability and accuracy comparing to the measurements of the distances from the epiglottis to the midpoint between the vocal folds and to the posterior vocal folds. The performance of using the Pre-E/aVF ratio to predict potential difficult airway was compared with other clinical tests (the Mallampati classification, the thyromental distance and the neck circumference to thyromental distance ratio). By using the Pre-E/aVF ratio of 1, the sensitivity and specificity to predict a potential difficult airway were 79.5% and 39.2%, respectively (p = 0.044). The ultrasound assessment method had a comparable predictive value as the Mallampati classification (the area under the receiver operator characteristic curves 0.648 vs 0.687). The negative likelihood ratio of the ultrasound assessment method was the lowest among all the other airway assessment methods.
Conclusion:
The ultrasound airway assessment method could serve as a non-invasive test and supplement the currently used clinical assessment methods. A lower cut-off point of the Pre-E/E-VF ratio should be used in the Chinese population.
Introduction
Ultrasound (US) imaging technique has been developed into an invaluable bedside tool providing important clinical information with a major impact on acute patient care in both emergency department (ED) and intensive care unit (ICU). The spectrum of applications for the use of US has experienced tremendous growth due to the low cost, non-invasiveness and relatively short learning curve associated with its use. Recently, US has also been applied in the airway management.1 US allows direct visualization of bilateral lung expansion following endotracheal intubation and helps to predict successful extubation by assessing diaphragmatic movement (displacement of the liver and spleen during a spontaneous breathing).2 In addition, US has been used to predict post-extubation stridor by measuring the width of air column during endotracheal tube cuff deflation3 and also to evaluate prominent blood vessels in the neck during percutaneous dilatational tracheostomy.4
Unanticipated difficult airway is always challenging to anesthesiologists, intensivitists and emergency physicians. The incidence of difficult intubation was reported ranging from about 5% to 11%5-7 in different settings, such as patients under general anesthesia and critically ill patients in ED and ICU. Failed or delayed intubation is associated with significant morbidity and mortality.8 The incidence of failed intubation is about 1 in 1 to 2000 in elective operation setting9,10 and about 1 in 50 to 100 in the ED11 and ICU.12 Avoidance of airway complications not only requires knowledge and skill of intubation technique but also careful assessment, thorough planning and preparation before the procedure.
Airway assessment is essential to facilitate airway management planning. Numerous bedside screening tests have been proposed to predict difficult airway and intubation.
Commonly used bedside clinical tests to assess airway before tracheal intubation, including the Mallampati classification and thyromental distance (TMD), are not accurate.13 The Cormack–Lehane (CL) classification is a widely used airway assessment method.14 However, it depends on direct laryngoscopy assessment which is an invasive procedure and cannot be used as a predictor tool before the patients undergo intubation.
US imaging provides a simple and non-invasive technique for clinical assessment of the patient's airway. Ezri et al. described an US measurement method of anterior neck soft tissue to predict difficult airway. Pre-tracheal soft tissue more than 28 mm and a neck circumference (NC) more the 50 cm at the level of vocal cords predicted a difficult airway, but these parameters was only applied in obese patients.15 Another US assessment method to predict difficult airway using sublingual US view to assess the visibility of the hyoid cartilage was proposed by Hui et al. Although this method was also reported to be highly correlated with the conventional CL classification,16 most patients might not tolerate the placement of a US probe in their sublingual space. Gupta et al. described another simple US airway assessment method by measuring the ratio of pre-epiglottis space distance (Pre-E) and the distance between the epiglottis and the vocal folds (E-VF) in the submandibular view. The ratio of Pre-E and E-VF (Pre-E/E-VF ratio) was reported to be highly correlated with the CL classification. A Pre-E/E-VF ratio of 2 to 3 was correlated with the CL grade 3 (difficult airway).17 However, the Gupta method has not yet been validated in the Chinese population, and local experience of using US in assessing airway is limited. Therefore, a prospective clinical study was conducted to investigate the accuracy of using the Pre-E/E-VF ratio measured by the US to predict potential difficult airway in Chinese population.
Materials and methods
The subjects were recruited in the pre-operative assessment service (PAS) clinic of Tuen Mun Hospital. Chinese patients with age of 18 years or above, who were scheduled for elective surgery requiring general anesthesia with direct laryngoscopy and tracheal intubation, were included in the study. Patients were excluded if they had contraindications for a proper direct laryngoscopy including limited mouth opening, head and neck pathologies (e.g. tumors and facial fracture or cervical spine instability), underwent tracheostomy, had limited neck extension (<30°) or refused to participate in the study. Patients were enrolled in the study after obtaining written informed consent. The age, sex, NC, body height, body weight, the body mass index, the TMD and the Mallampati classification (Appendix 1) of the patients were recorded.
Measurements and image acquisitions
All the sonographic measurements were taken at the PAS clinic of Tuen Mun Hospital.
The scans were performed by three doctors and three radiographers. All were students of the course of the Master of Science in Diagnostic Ultrasonography in the Chinese University of Hong Kong and had acquired the basic operating technique in using ultrasonography. All the operators spent 1 month on practicing the technique for obtaining the standard US image before initiating the study. About 20 patients were scanned during the period but they were excluded in the final analysis.
Data were collected using the Mindray portable M7 US system, and the linear transducer L12-4s was employed with small part preset. In order to standardize the image, the image was zoomed in the area of interest (the epiglottis space, the E-VF) occupying two-third of the image view.
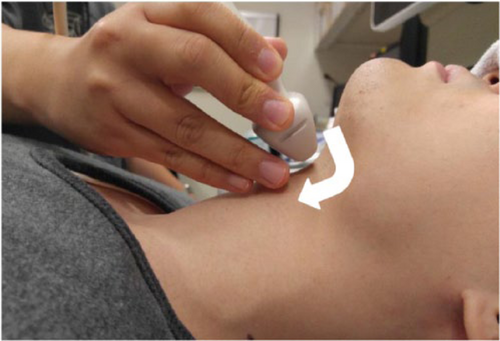
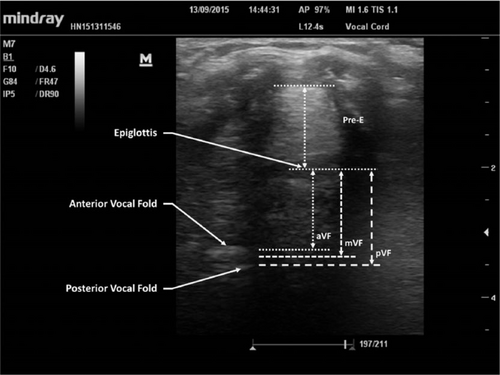
Patient was positioned in supine position with active maximal head tilt-chin lift. Ample amount of gel was applied. The US probe was disinfected before the assessment of each patient. The probe was placed in the space between hyoid and thyroid cartilage in the midline. The position of the probe remained unchanged, and then the probe was rotated in the transverse plane from cephalad to caudal direction until an oblique transverse view bisecting the epiglottis and the base of the vocal folds was obtained17 (Figure 1). The depth of the Pre-E, the distances from the epiglottis to the anterior vocal folds (aVF), to the midpoint between the anterior and posterior vocal folds (mVF), and to the posterior vocal folds (pVF) were measured (Figure 2). The Pre-E/aVF, Pre-E/mVF and Pre-E/pVF ratios were then calculated.
The US images were captured anonymously and securely stored on an encrypted hard disk.

Technique of US scan.
Patient was in supine position with active maximal head tilt-chin lift; US probe was placed in the space between hyoid and thyroid cartilage in the midline, and then rotated in the transverse plane from cephalad to caudal to obtain the standard US view.

US view of the oblique transverse plane at the hypopharynx bisecting the epiglottis and the base of vocal folds.
Pre-E: pre-epiglottis space distance; aVF: distance from the epiglottis to the anterior vocal folds; mVF: distance from epiglottis to the midpoint between the anterior and posterior vocal folds; pVF: distance from epiglottis to posterior vocal folds.
Reliability assessment
Before conducting the study in the patients, 10 volunteers fulfilling the inclusion and exclusion criteria of the study were recruited to assess the inter-rater and intra-rater reliabilities of the measurements by the operators. During the study in the real patients, each patient was scanned by two operators independently and the inter-rater reliability of the measurements was also evaluated.
Outcome measure
The anesthetic records of the patients were reviewed for the grade of laryngoscope view using the CL classification after the scheduled elective operations (Appendix 2). Patients with CL classification grade 2b, 3, or 4 were classified to have potential difficult airway.18 The anesthetists, who performed airway assessment for the patients in the operation, were blinded to our US assessment result.
Sample size estimation
The sample size was calculated by assuming a power of 80% and significant level of 5%. Based on our clinical experience, the ratio of potential difficult airway to non-difficult airway was assumed to be 1:2. To assume the accuracy of the US assessment method to be 0.6717 with the null hypothesis of the area of the receiver operator characteristic (ROC) curve of 0.5, the total sample size required was 90 (30 cases of potential difficult airway and 60 cases of non-difficult airway) as calculated by PASS 2011 software by NCC, US. With the consideration of the default rate (assumed to be 40%), the number of subjects to be scanned in the study was estimated to be 150.
Statistical analysis
The Statistical Package for Social Sciences (SPSS) version 22.0 for Windows was used for analysis. The intra-class correlation coefficient (ICC) was calculated to assess the inter-rater and intra-rater reliabilities. The ROC curve was drawn to assess the performance of the test, and the cut-point of Pre-E/E-VF ratio for the most appropriate prediction the CL grades was determined. The sensitivity, specificity, positive and negative predictive values, positive and negative likelihood ratio and accuracy to predict a potential difficult airway (documented CL grade 2b, 3, or 4 by the anesthetist's assessment) using the determined Pre-E/E-VF ratio were compared with the Mallampati classification, TMD and NC/TMD ratio.
Results
Totally, 153 patients were scanned during the study period. Forty cases were excluded due to the use of laryngeal mask airway (N = 9), operation performed under spinal and regional anesthesia (N = 18), cancelation of operation (N = 8) and no documented airway assessment in the anesthetic record (N = 5). Finally, 113 patients were included. Sixty-nine of them were male, and the male-to-female ratio was about 6:4. Other demographic data of the patients are shown in Table 1. For the airway assessment results by the anesthetists, 74 (65.5%) patients had CL classification grade either 1 or 2a and 39 (34.5%) patients had potential difficult airway (CL classification grade 2b, 3, or 4) (Table 2). The average time taken to complete the US examination of the patient's airway by each operator in the PAS clinic was about 1 min.
All the operators were able to acquire the US technique to obtain the standard image after 1 month of practice. For the reliability measurements, all the operators generally had good intra-rater and inter-rater reliabilities for the measurements of the Pre-E /aVF, Pre-E /mVF, and Pre-E /pVF ratios in the volunteers. However, the measurements of the Pre-E/aVF ratio had the best intra-rater and inter-rater reliabilities compared to the measurements of the Pre-E/mVF and Pre-E/pVF ratios. The ICCs for the inter-rater reliabilities in the real patients were also high, and similar findings were observed in the measurement of the Pre-E/aVF ratio, which showed the best inter-rater reliability (Table 3).
| Range | Mean | SD | |
|---|---|---|---|
| Age (years) | 19–84 | 56.1 | 12.9 |
| Body weight (kg) | 39.5–110.1 | 63.1 | 12.5 |
| Height (cm) | 117.8–181.4 | 160.8 | 9.0 |
| Body mass index (BMI) | 15.6–52.2 | 24.5 | 4.9 |
| Thyromental distance (TMD) (cm) | 4–9 | 6.2 | 1.1 |
| Neck circumference (cm) | 29–46 | 36.2 | 3.3 |
| CL classification | Frequency | Percentage |
|---|---|---|
| Grade 1 | 43 | 38.1 |
| Grade 2a | 31 | 27.4 |
| Grade 2b | 24 | 21.2 |
| Grade 3 | 14 | 12.4 |
| Grade 4 | 1 | 0.9 |
| Total | 113 | 100 |
- CL: Cormack–Lehane.
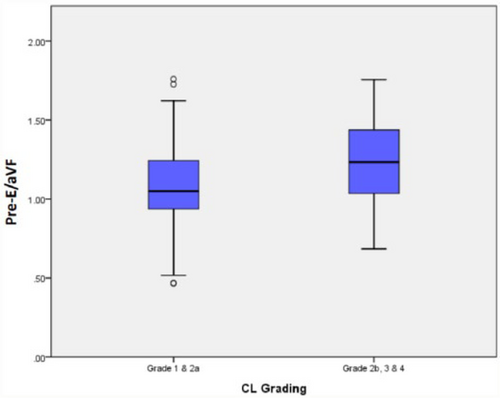
The area under the ROC curves (AUCs) of the Pre-E/aVF, Pre-E/mVF, and Pre-E /pVF ratios were 0.648, 0.632, and 0.635, respectively. Due to the superior inter-rater reliability and accuracy, the Pre-E/aVF ratio was adopted in the final analysis and its performance to predict potential difficult airway was compared with other clinical tests. No patients had a Pre/aVF ratio more than 2. The cut-off of Pre-E/aVF ratio of 1 was determined at the point on the ROC curve nearest to the upper left corner of the ROC curve. The sensitivity and specificity of adopting the cut-off of Pre-E/aVF ratio of 1 were 79.5% and 39.2% (p = 0.044). The distribution of the Pre/aVF ratio in the patients with non-difficult airway and in those with potential difficult airway was demonstrated in the boxplot (Figure 3). Compared to the other clinical tests (TMD, Neck/TMD and Mallampati score), the US assessment method had the lowest negative likelihood ratio (Table 4). The ROC curves of different methods are shown in Figure 4.
| Reliability measurements in the volunteers | ||||||
|---|---|---|---|---|---|---|
| Operator | Measurement of Pre-E/aVF | Measurement of Pre-E/mVF | Measurement of Pre-E/pVF | |||
| Intra-rater reliability | 95% CI | Intra-rater reliability | 95% CI | Intra-rater reliability | 95% CI | |
| 1 | 0.967 | 0.882–0.992 | 0.953 | 0.832–0.988 | 0.947 | 0.812–0.986 |
| 2 | 0.969 | 0.886–0.992 | 0.978 | 0.920–0.994 | 0.968 | 0.883–0.992 |
| 3 | 0.940 | 0.789–0.984 | 0.962 | 0.865–0.990 | 0.894 | 0.651–0.972 |
| 4 | 0.962 | 0.864–0.990 | 0.911 | 0.699–0.977 | 0.918 | 0.721–0.979 |
| 5 | 0.939 | 0.778–0.984 | 0.943 | 0.799–0.985 | 0.859 | 0.555–0.963 |
| 6 | 0.959 | 0.853–0.989 | 0.992 | 0.743–0.980 | 0.885 | 0.626–0.970 |
| Inter-rater reliability | Inter-rater reliability | Inter-rater reliability | ||||
| All | 0.990 | 0.975–0.997 | 0.951 | 0.884–0.986 | 0.952 | 0.886–0.986 |
| Reliability measurements in the patients | ||||||
| Inter-rater reliability | Inter-rater reliability | Inter-rater reliability | ||||
| All | 0.920 | 0.885–0.944 | 0.855 | 0.796–0.897 | 0.824 | 0.755–0.875 |
- Pre-E/aVF: distance from the epiglottis to the anterior vocal folds; Pre-E/mVF: distance from the epiglottis to the midpoint between the anterior and posterior vocal folds; Pre-E/pVF: distance from the epiglottis to the posterior vocal folds; CI: confidence interval.
Discussion
Prediction of a difficult airway is essential to prevent unanticipated difficult intubation and adverse outcomes, and to facilitate the establishment of contingency plan for the airway management. In our study, the incidence of difficult laryngoscopy (CL grade 3 or 4) was 13.3% which was higher than the reported incidence in precious studies.19 About one-third of the patient had potential difficult airway (CL grade 2b, 3, or 4) and the incidence was similar to our estimation.
| Test | AUC | Sensitivity | Specificity | PPV | NPV | +LR | −LR | p-valuea |
|---|---|---|---|---|---|---|---|---|
| Pre-E/aVF >1 | 0.648 | 79.5% | 39.2% | 40.8% | 78.4% | 1.31 | 0.52 | 0.044* |
| Mallampati classification ≥3 | 0.687 | 23.1% | 91.9% | 60.0% | 69.4% | 2.57 | 0.86 | 0.026* |
| TMD <6 cm | 0.456 | 79.5% | 23.0% | 35.2% | 68.0% | 1.03 | 0.89 | 0.765 |
| NC/TMD >5 | 0.536 | 74.4% | 21.6% | 33.3% | 61.5% | 0.95 | 1.19 | 0.629 |
- PPV: positive predictive value; NPV: negative predictive value; +LR: positive likelihood ratio; −LR: negative likelihood ratio.
- a Chi-square test.
- * Statistically significant.

Boxplot for the distribution of the Pre-E/aVF ratio in the patients with non-difficult airway (CL grades 1 and 2a) versus the patients with potential difficult airway (CL grades 2b, 3, and 4).

ROC curves of US airway assessment method and other clinical tests.
The result of our study was different from that of the original study. No patients having a Pre-E/E-VF ratio (Pre-E/aVF ratio) more than 2 were observed. Thus, the findings from Gupta's study were not applicable to the Chinese population. A lower cut-off of Pre-E/E-VF ratio (Pre-E/aVF ratio = 1) was adopted in our study. We also modified the measurement of the Pre-E/E-VF using the Pre-E/aVF ratio instead of the Pre-E/mVF ratio which was used in the original study due to the higher reliability and accuracy in the measurement.
We compared the accuracy of several clinical tests and the US airway assessment method to predict potential difficult airway. Overall, all the clinical tests had only marginal diagnostic value and the findings were similar to the previous studies.5 TMD is an indicator of the mandibular space and reflects how easy or difficult of the tongue to be displaced by the laryngoscope blade. The NC/TMD ratio was reported to have a better predictive value than the TMD in predicting a difficult airway.20 However, our study showed that neither the TMD nor the NC/TMD ratio could discriminate between easy airway and potential difficult airway in the patients.
In our study, the US assessment method was shown to have a comparable predictive value as the Mallampati classification. The Mallampati classification is a simple, widely used pre-anesthetic airway assessment test. It provides estimation of the size of the tongue relative to the oral cavity and also the adequacy of oral cavity space to permit intubation. However, meta-analysis had shown that the Mallampati classification had only marginal predictive value and was inadequate as a stand-alone test to predict difficult airway.21 Our study showed a superior accuracy of the Mallampati classification and the US assessment method to predict potential difficult airway compared to the other two clinical tests, but their predictive values were marginal. Nevertheless, as a single test, the US assessment method was believed to be superior to the Mallampati classification because the performance of the Mallampati classification was inconsistent as the technique of assessment was not standardized (with or without phonation, and with different head positions). The US assessment method could provide a more objective airway assessment with standardized procedure. In addition, the US assessment method was shown to have a lower negative likelihood ratio compared to the Mallampati classification indicating that patients with a negative test result had a lower probability of potential difficult airway. However, training and practice were required for the operators to acquire the skill and improve the proficiency in obtaining the standardized US image.
There are several important limitations in our study. First of all, the Mallampati classifications of the patients’ airway were retrieved from the anesthetic records. The technique of assessment was not standardized which might lead to errors. Second, there was no international consensus of defining an intubation score and the outcome measure of difficult airway varied in difficult studies. Thus, the result of our study about the performance of the Mallampati classification might be different from other studies in which different outcome measures were adopted. Third, the laryngoscope view depended on the experience and skill of the anesthetists. The inter-rater and intra-rater reliabilities of the airway assessment by the anesthetists were not assessed in this study. Fourth, there was a significant default rate in our study. Five of the patients had no documented CL grade in the anesthetic records because video laryngoscopes were used during the intubation procedure. The use of video laryngoscopes might imply that a potential difficult airway was suspected during the pre-anesthetic assessment. Exclusion of these patients from the analysis could lead to bias as the number of patients with potential difficult airway was limited in our study. In addition, the applicability of the US airway assessment technique, similar to the Mallampati classification, is limited for those relatively stable patients instead of patients requiring emergency airway management. Finally, a difficult laryngoscopy was only a surrogate outcome measure for a difficult intubation which could be influenced by other factors including the range of mouth opening, neck mobility, and patient's clinical condition.7 Thus, bedside tests assessing a single parameter have only limited predictive value for difficult intubation.
Conclusion
The US airway assessment method can serve as a non-invasive test and supplement to the currently used clinical assessment methods including the Mallampati classification but its accuracy remains limited. The cut-off point of the Pre-E/E-VF used in the original Gupta method is not applicable in the Chinese population. Further studies are needed to explore the combination of the US assessment method with other bedside tests in order to improve the diagnostic value in predicting difficult intubation. Furthermore, the current clinical use of video laryngoscopes may change the accuracy of predictors of difficult airway, and thus, a different definition of difficult airway and intubation may be required for the future study.
Declaration of conflicting interests
The author(s) declared no potential conflicts of interest with respect to the research, authorship, and/or publication of this article.
Ethical considerations
This study was approved by the clinical research ethics committees of New Territories West Cluster of Hospital Authority. Written informed consent was obtained from the patients, and the anesthetic management of the patients was not affected by the findings of this study.
Funding
Expenses of recruiting volunteers in this study were supported by the research fund from the course of Master of Science in Diagnostic Ultrasonography in the Chinese University of Hong Kong. There were no resources implication in the patient management and no funding from the ultrasound company in this study.
Appendix 1
Mallampati classification.
| Class 1 | Full visibility of tonsils, uvula, and soft palate |
| Class 2 | Visibility of hard and soft palate, and upper portion of tonsils and uvula |
| Class 3 | Soft and hard palate and base of uvula |
| Class 4 | Only hard palate visible |
Appendix 2
Cormack–Lehane classification.18
| Grade | Laryngoscopic view | Likelihood of difficult intubationa |
|---|---|---|
| 1 | Full view of the vocal cords | 0.9% |
| 2a | Partial view of the vocal cords | 4.3% |
| 2b | Only the arytenoids and epiglottis seen | 67.4% |
| 3 | Only epiglottis visible | 87.5% |
| 4 | Neither the epiglottis nor glottis seen | Very likely |
- a Difficult intubation was defined as requiring more than one laryngoscopy attempt, use of special blade or other intubation aid.


